The first years of life are considered a critical period for developing cognitive abilities, a phase marked by rapid brain development and heightened susceptibility to environmental influences(Reference Grantham-McGregor, Cheung and Cueto1,Reference Thompson and Nelson2) . During this phase, cognitive abilities, such as intelligence, often assessed by intelligence quotient (IQ) tests, show an accelerated increase, reaching a certain stability around the age of 10(Reference Braaten and Norman3–Reference Bünger, Grieder and Schweizer5). However, the failure to achieve the full potential of cognitive development in early life can negatively influence behaviours and health throughout life, increase the risk of mortality(Reference Batty, Deary and Gottfredson6–Reference Kilgour, Starr and Whalley10), compromise educational attainment, negatively affect income in adulthood and potentially contribute to the perpetuation of the cycle of poverty between generations(Reference Grantham-McGregor, Cheung and Cueto1).
Given the accelerated brain development that occurs during this period, dietary intake emerges as a key factor for supporting healthy neurodevelopment(Reference Anjos, Altmäe and Emmett11). During the first years of life, processes such as synaptogenesis, neurogenesis and myelination occur intensively, and the developing brain remains highly plastic and sensitive to environmental exposures(Reference Thompson and Nelson2,Reference Prado and Dewey12) . These processes require an adequate supply of macronutrients (e.g. proteins, long-chain PUFA and glucose) and micronutrients (e.g. Fe, iodine, Zn and vitamins), which are needed to sustain the substantial metabolic demands of the brain during this period(Reference Mattei and Pietrobelli13–Reference Cusick and Georgieff15). Such nutrients play essential roles in a range of neurodevelopmental pathways across different brain regions, and when these requirements are not adequately supported, neurodevelopment may be disrupted, with potential long-term consequences, including impairments in cognitive abilities(Reference Prado and Dewey12,Reference Cusick and Georgieff15) . Conversely, diets of poor nutritional quality, particularly those high in ultra-processed foods, may interfere with these neurodevelopmental processes through mechanisms involving systemic inflammation, oxidative stress and alterations in the gut–brain axis, which may, in turn, adversely affect cognitive function(Reference Mottis, Kandasamey and Peleg-Raibstein16,Reference Rondinella, Raoul and Valeriani17) .
These mechanisms have prompted extensive investigation into the role of individual micronutrients in cognitive development, leading to a substantial body of evidence on their potential benefits(Reference Anjos, Altmäe and Emmett11,Reference Nyaradi, Li and Hickling18–Reference Lam and Lawlis20) . However, nutrients are not consumed in isolation, but as part of food combinations that may exert synergistic or antagonistic effects(Reference Tangney and Scarmeas21). Therefore, assessing dietary intake through more comprehensive approaches that consider the broader dietary context and capture the interactive effects among multiple dietary components has become increasingly important(Reference Nyaradi, Li and Hickling18). Among the approaches employed is the analysis of dietary patterns, which can be derived from dietary intake data and reflect eating behaviours, as they are identified based on correlations among foods or food groups that tend to be consumed together(Reference Hu22).
Evidence suggests that dietary patterns begin to form in childhood and tend to remain consistent over time, with unhealthy patterns often showing the greatest persistence(Reference Mikkilä, Räsänen and Raitakari23–Reference Luque, Escribano and Closa-Monasterolo25). Childhood is therefore a crucial period for the establishment of eating habits that can persist and impact health across the lifespan(Reference Cosmi, Scaglioni and Agostoni26,Reference Scaglioni, De Cosmi and Ciappolino27) .
Given the growing trend of early introduction of low-quality diets and its implications for child development, some studies have evaluated the influence of dietary patterns on cognitive performance in healthy children, using cross-sectional(Reference Leventakou, Roumeliotaki and Sarri28,Reference Marinoni, Giordani and Mosconi29) and longitudinal(Reference Gale, Martyn and Marriott30–Reference Smithers, Golley and Mittinty34) approaches. A meta-analysis of studies conducted with children in high-income countries found that dietary patterns were associated with a small but statistically significant increase (OR = 1·03, P ≤ 0·01) in the odds of influencing cognitive abilities(Reference Nilsen, Ruiz and Tulve35).
However, the results remain inconsistent and have predominantly been derived from studies conducted in high-income countries. Thus, it is crucial to investigate this association in low- and middle-income countries, where diet quality and diversity are often more limited than in high-income countries(Reference Mayén, Marques-Vidal and Paccaud36). Therefore, this study aims to characterise dietary patterns at 2 years of age and investigate their association with cognitive performance, measured by IQ scores at 6–7 years of age, in children from the 2015 Pelotas Birth Cohort (Brazil).
Methods
This longitudinal study used data from the 2015 Pelotas Birth Cohort in Brazil. Between 1 January and 31 December 2015, all live-born children delivered in the maternity hospitals of Pelotas, whose mothers resided in the urban area of the municipality, were invited to participate in the study. Of the 4333 eligible births, 4275 mothers agreed to participate, defining the perinatal study and the original sample of this cohort. This article used data from the following follow-ups: perinatal, 3 and 12 months and at 2, 4 and 6–7 years of age. Of the original cohort, 97·2 % (n 4110) were followed up at 3 months, 95·4 % (n 4018) at 12 months, 95·4 % (n 4014) at 2 years, 95·4 % (n 4010) at 4 years and 92·0 % (n 3867) at 6–7 years of age. The analytical sample included children with information on food consumption at age 2 and cognitive performance at age 6–7 (Figure 1). Additional information and methodological details on the 2015 Pelotas Birth Cohort can be found elsewhere(Reference Bertoldi, Barros and Hallal37–Reference Murray, Leão and Flores39).
Flowchart of the 2015 Pelotas Birth Cohort and the children included in the study.

The study protocol, from perinatal to 4-year follow-up, was approved by the Research Ethics Committee of the School of Physical Education at the Federal University of Pelotas under protocol number 522,064, and the protocol for 6–7-year follow-up was approved by the Research Ethics Committee of the Faculty of Medicine at the same university, under protocol number 5,032,997. In all follow-ups, participation in the study was formalised by the mother or legal guardian signing an informed consent form.
Dietary intake assessment
Dietary intake was assessed at 2 years of age and collected using a questionnaire containing questions related to the child’s usual diet based on the following question: ‘Now I am going to ask you some questions about <CHILD>’s diet. Please answer based on the foods that are regularly consumed every day or almost every day. Thinking about <CHILD>’s usual consumption, does he/she eat/drink…’. The questionnaire, adapted from the food intake markers form of the Brazilian National Food and Nutrition Surveillance System(40), assesses the habitual consumption of specific foods or food groups. Some adjustments were made to the instrument based on local consumption profiles, particularly regarding examples of food items(Reference Pereira, Buffarini and Domingues41). The questionnaire utilised ‘yes’ or ‘no’ response options and was administered by a trained interviewer to the child’s mother or guardian.
The food items investigated included sausages and processed meats (such as nuggets, hamburgers, ham, mortadella, salami, sausage and hot dogs); packaged snacks (like chips); instant noodles; sweet biscuits; sweets and candies (such as candies, lollipops, chewing gums, chocolates or jelly); soft drinks; processed juices (boxed, bottled, powdered juice or boxed coconut water); meats (beef, chicken, fish, pork or offal); eggs; liver; cereal grains and starches (rice, potatoes, cassava/manioc or pasta); beans; baby foods (purees and soups); fruits; vegetables; natural fruit juices; savoury crackers; infant formulas; milk (cow’s milk, liquid or powdered) and yogurt.
Dietary patterns
Dietary patterns were generated using principal component analysis based on the food items in the questionnaire, allowing strongly correlated food items to be combined to form the components(Reference Hu22). The Kaiser–Meyer–Olki and Bartlett’s sphericity tests were applied to assess the appropriateness of the principal component analysis(Reference Fávero and Belfiore42,Reference Olinto, Kac, Sichieri and Gigante43) .
The number of components to be extracted was defined based on interpretability criteria, eigenvalues and the Cattell scree plot test, in which the points with the most significant slope indicate the number of components to be retained(Reference Olinto, Kac, Sichieri and Gigante43,Reference Ocké44) . An eigenvalue cut-point greater than 1·5 was applied to ensure that only components explaining a meaningful proportion of the variance were retained, a criterion also noted in a previous methodological review when many components exceed the 1·0 threshold(Reference Newby and Tucker45). An orthogonal rotation (varimax) was applied to maximize the higher factor loadings and minimise the lower loadings, facilitating the interpretability of the components(Reference Olinto, Kac, Sichieri and Gigante43). Food items with factor loadings greater than |0·30| were considered to be strongly associated with these components and were, therefore, the most representative in the description and labelling of dietary patterns.
Component scores were calculated for each child by multiplying their standardised intake of all food groups by the corresponding rotated factor loadings and then summing these products. The resulting scores were divided into terciles to classify adherence to each dietary pattern: children in the lowest tercile were considered to have low adherence, while those in the middle and highest terciles were classified as having high adherence.
Furthermore, supplementary analyses were performed using dietary intake both as standardised scores and as mutually exclusive categories, which describe children’s dietary intake profiles by considering different patterns simultaneously. The detailed methodology for these analyses is available in the online Supplementary material.
Cognitive performance
The children’s cognitive performance was assessed by trained psychologists using the adapted and standardised version of the Wechsler Intelligence Scale for Children – 4th edition for the Brazilian population(Reference Wechsler46) at 6–7 years of age. The ten mandatory subtests were applied (similarities, vocabulary, comprehension, cubes, figurative concepts, matrix reasoning, digits, sequence of numbers and letters, code and symbol search), which assess different cognitive abilities and provide IQ scores. The scores were obtained according to the norms and conversion tables for the Brazilian population described in the Wechsler Intelligence Scale for Children – Fourth Edition test application and correction manual(Reference Wechsler46).
Covariates
The covariates were identified as potential confounding factors based on a literature review and the construction of a directed acyclic graph using DAGitty 3.1 software (https://www.dagitty.net/). The directed acyclic graph illustrates the minimum adjustments needed to estimate the direct effect and is presented in simplified form in online Supplementary Figure 1.
From the perinatal study, the variables included were sex (male and female); maternal age in years (<20, 20–34 and ≥35); maternal schooling in years (≤4, 5–8, 9–11 and ≥12) and socioeconomic status (A-B, C and D-E), categorised according to the Brazilian Association of Research Companies, where A-B correspond to the wealthiest groups and D-E to the poorest(47).
At 3 and 12 months of age, the duration of exclusive breast-feeding (months) was assessed. Foods introduced before 6 months was classified based on the data from the 12-month follow-up into four categories: a) no, when no food other than breast milk was introduced, which is considered the appropriate practice for this age range; b) healthy food, when foods such as fruits, vegetables and cereal grains were introduced; c) unhealthy food, when processed foods rich in sugars or fats were introduced and d) both, when both healthy and unhealthy foods were introduced.
From the 2-year follow-up, the following variables were included: number of people in the household, not including the child (1, 2, 3, 4 or more); attended pre-school (yes, no), positively coded if the child attended pre-school at any point before age of 2; maternal work outside the home since the child’s birth (yes, no); parent–child relationship score, measured by a subscale of the Parenting and Family Adjustment Scales, with higher scores indicating better relationships (0–15)(Reference Sanders, Morawska and Haslam48); and maternal depressive symptoms assessed by the Edinburgh Postnatal Depression Scale, with a cut-off point ≥ 10 to classify maternal depression (yes, no)(Reference Santos, Matijasevich and Tavares49). In addition, a cognitive stimulation score (0–4) was created based on the sum of positive answers to the following questions: a) whether the child had been taken to the park in the last week (yes, no); b) whether the child had been taken to other people’s houses in the last week (yes, no) and c) whether the child had any storybooks at home (yes, no); d) whether someone had read or told the child a story (yes, no)(Reference Barros, Matijasevich and Santos50).
The z-scores for weight, height and head circumference for ages up to 2 years were calculated according to the WHO growth curves(51), using WHO Anthro software [https://www.who.int/toolkits/child-growth-standards/software] and based on data collected at all follow-ups during this period. These indicators were later combined into a single constructed variable, referred to as early-life deficits, defined as the presence of any deficit identified when the z-score was ≤ –2 standard deviations in at least one follow-up up to the age of 2(Reference Gonçalves, Barros and Buffarini52).
From the 4-year follow-up, the number of older siblings (0, 1, 2 or more) and family structure were included. Family structure at 4 years was used as a proxy for family structure at 2 years, as this information was not available at that time. It was categorised according to whether the child lived with one, both or neither of his or her parents, regardless of whether they were biological, social or adoptive.
In addition to the minimum sufficient adjustment set defined by the directed acyclic graph, a fully adjusted model was also tested, including all potential confounders identified a priori. This extended model incorporated gestational and behavioural characteristics (parity, pre-pregnancy BMI, gestational weight gain, physical activity during pregnancy, number of prenatal visits, smoking and alcohol consumption during pregnancy) and child characteristics (skin colour, gestational age, birth weight and social interactions in play activities). As the effect estimates did not materially change, only the minimally adjusted model is presented in the main manuscript, whereas the fully adjusted model is available in the online Supplementary material.
Statistical analysis
The original and analytical samples were described according to all the covariates, reporting the absolute frequencies (N). Categorical variables were expressed as proportions (%) and 95 % CI. Normally distributed continuous variables were described using means and standard deviation (sd), whereas non-normally distributed variables were reported using medians and interquartile ranges (IQR).
Beta coefficients (β) and their respective 95 % CI were estimated using crude and adjusted linear regression models to assess the association between dietary patterns and cognitive performance. The association between adherence to dietary patterns (high and low adherence) and IQ scores was analysed, considering the low adherence category as the reference.
Exploratory analyses were conducted, based on literature and biological plausibility, to investigate whether the associations between adherence to dietary patterns and IQ scores might differ according to sex (male and female), birth weight (< 2500 g, 2500–3500 g and > 3500 g), gestational age at birth (<37 weeks, ≥37 weeks), duration of exclusive breast-feeding (months) and presence of early-life deficits (some deficit, no deficit). All variables were initially included as confounders, as defined in the directed acyclic graph. Interaction terms were incorporated into the adjusted models, and results were stratified when the interaction was significant for at least one dietary pattern. When no significant interaction was detected, the variable remained only as a confounder in the adjusted models.
All the assumptions for using linear regression were checked. Variables were treated according to fit criteria. The analyses were carried out using the Stata statistical package (version 15·1), adopting a 5 % significance level.
Missing data
Differences in covariates between the original cohort and the analytical sample were examined. As a sensitivity analysis, inverse probability weighting was used to evaluate whether weighting improved covariate balance between the original cohort and the analytical sample. The probability of remaining in the analytical sample was estimated using logistic regression under increasingly flexible specifications (main effects, quadratic terms and first-order interactions). Stabilised weights were then derived, and covariate balance before and after weighting was assessed using absolute standardised differences (online Supplementary Figure 2), adopting < 0·10 as the threshold for adequate balance. The specification that achieved the best overall balance, and acceptable weight distribution was selected for the weighted analyses(Reference Austin and Stuart53,Reference Hashimoto and Yasunaga54) .
Results
Of the 4275 children included in the original cohort, 3483 (81·5 %) had information on dietary intake at 2 years and cognitive performance at 6–7 years of age, and this was the analytical sample for this study (Figure 1). Overall, the analytical sample was broadly comparable with the original cohort. Just over half of the children were boys (50·5 %); most were children of mothers aged between 20 and 34 (70·8 %) with between 9 and 11 years of schooling (34·9 %). Most families were in socio-economic class C (50·7 %), and the most frequent family structure involved the child living with both parents (69·8 %). Only 23·4 % were exclusively breastfed for the first 6 months, without receiving any other food (Table 1). Around 11·4 % of the children had a weight-for-age deficit, 18·2 % had a height-for-age deficit and 9·2 % had a head circumference-for-age deficit during the first 2 years of life (data not shown in the table). Overall, 22·5 % exhibited at least one of these deficits (Table 1).
Characterisation and comparison of the original cohort and the analytical sample. Pelotas Birth Cohort, 2015, Brazil

CI: confidence interval; IQR: interquartile range.
* Without including the child.
† Deficit in weight, height or head circumference.
‡ Based on parks visits, house visits, storybooks at home and storytelling.
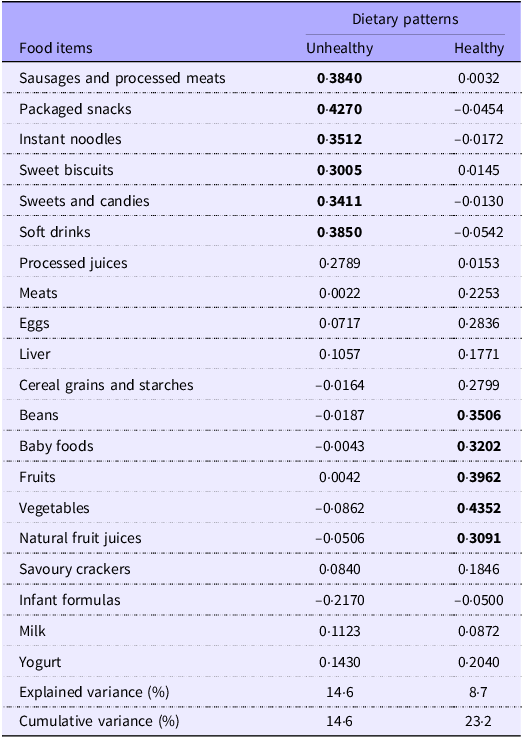
The tests conducted to assess the correlations between food items and the appropriateness of using principal component analysis to identify dietary patterns yielded adequate results, confirming its suitability (Kaiser–Meyer–Olki = 0·795; Bartlett’s test of sphericity, P < 0·001). The extraction of two factors was determined based on the scree plot and eigenvalues ≥ 1·5. After rotation, the dietary patterns explained 23·2 % of the total variance. The first pattern was characterised by snacks, instant noodles, sweet biscuits, sweets and candies, soft drinks, sausages and processed meats and was labelled as an ‘unhealthy’ pattern. The second, labelled ‘healthy’, was characterised by beans, baby foods, fruits, natural fruit juices and vegetables. The factor loadings of each food item for the patterns identified are shown in Table 2.
Distribution of factor loadings of food items for each dietary pattern at 2 years of age. Pelotas Birth Cohort, 2015

Factor loadings greater than |0·30| are highlighted.
At 6–7 years of age, the children had a mean IQ score of 87·4 points (sd: 14·0) and a median of 87 points (IQR: 21·0), with scores ranging from 43 to 131 points, with higher values representing higher IQ (data not shown in the table).
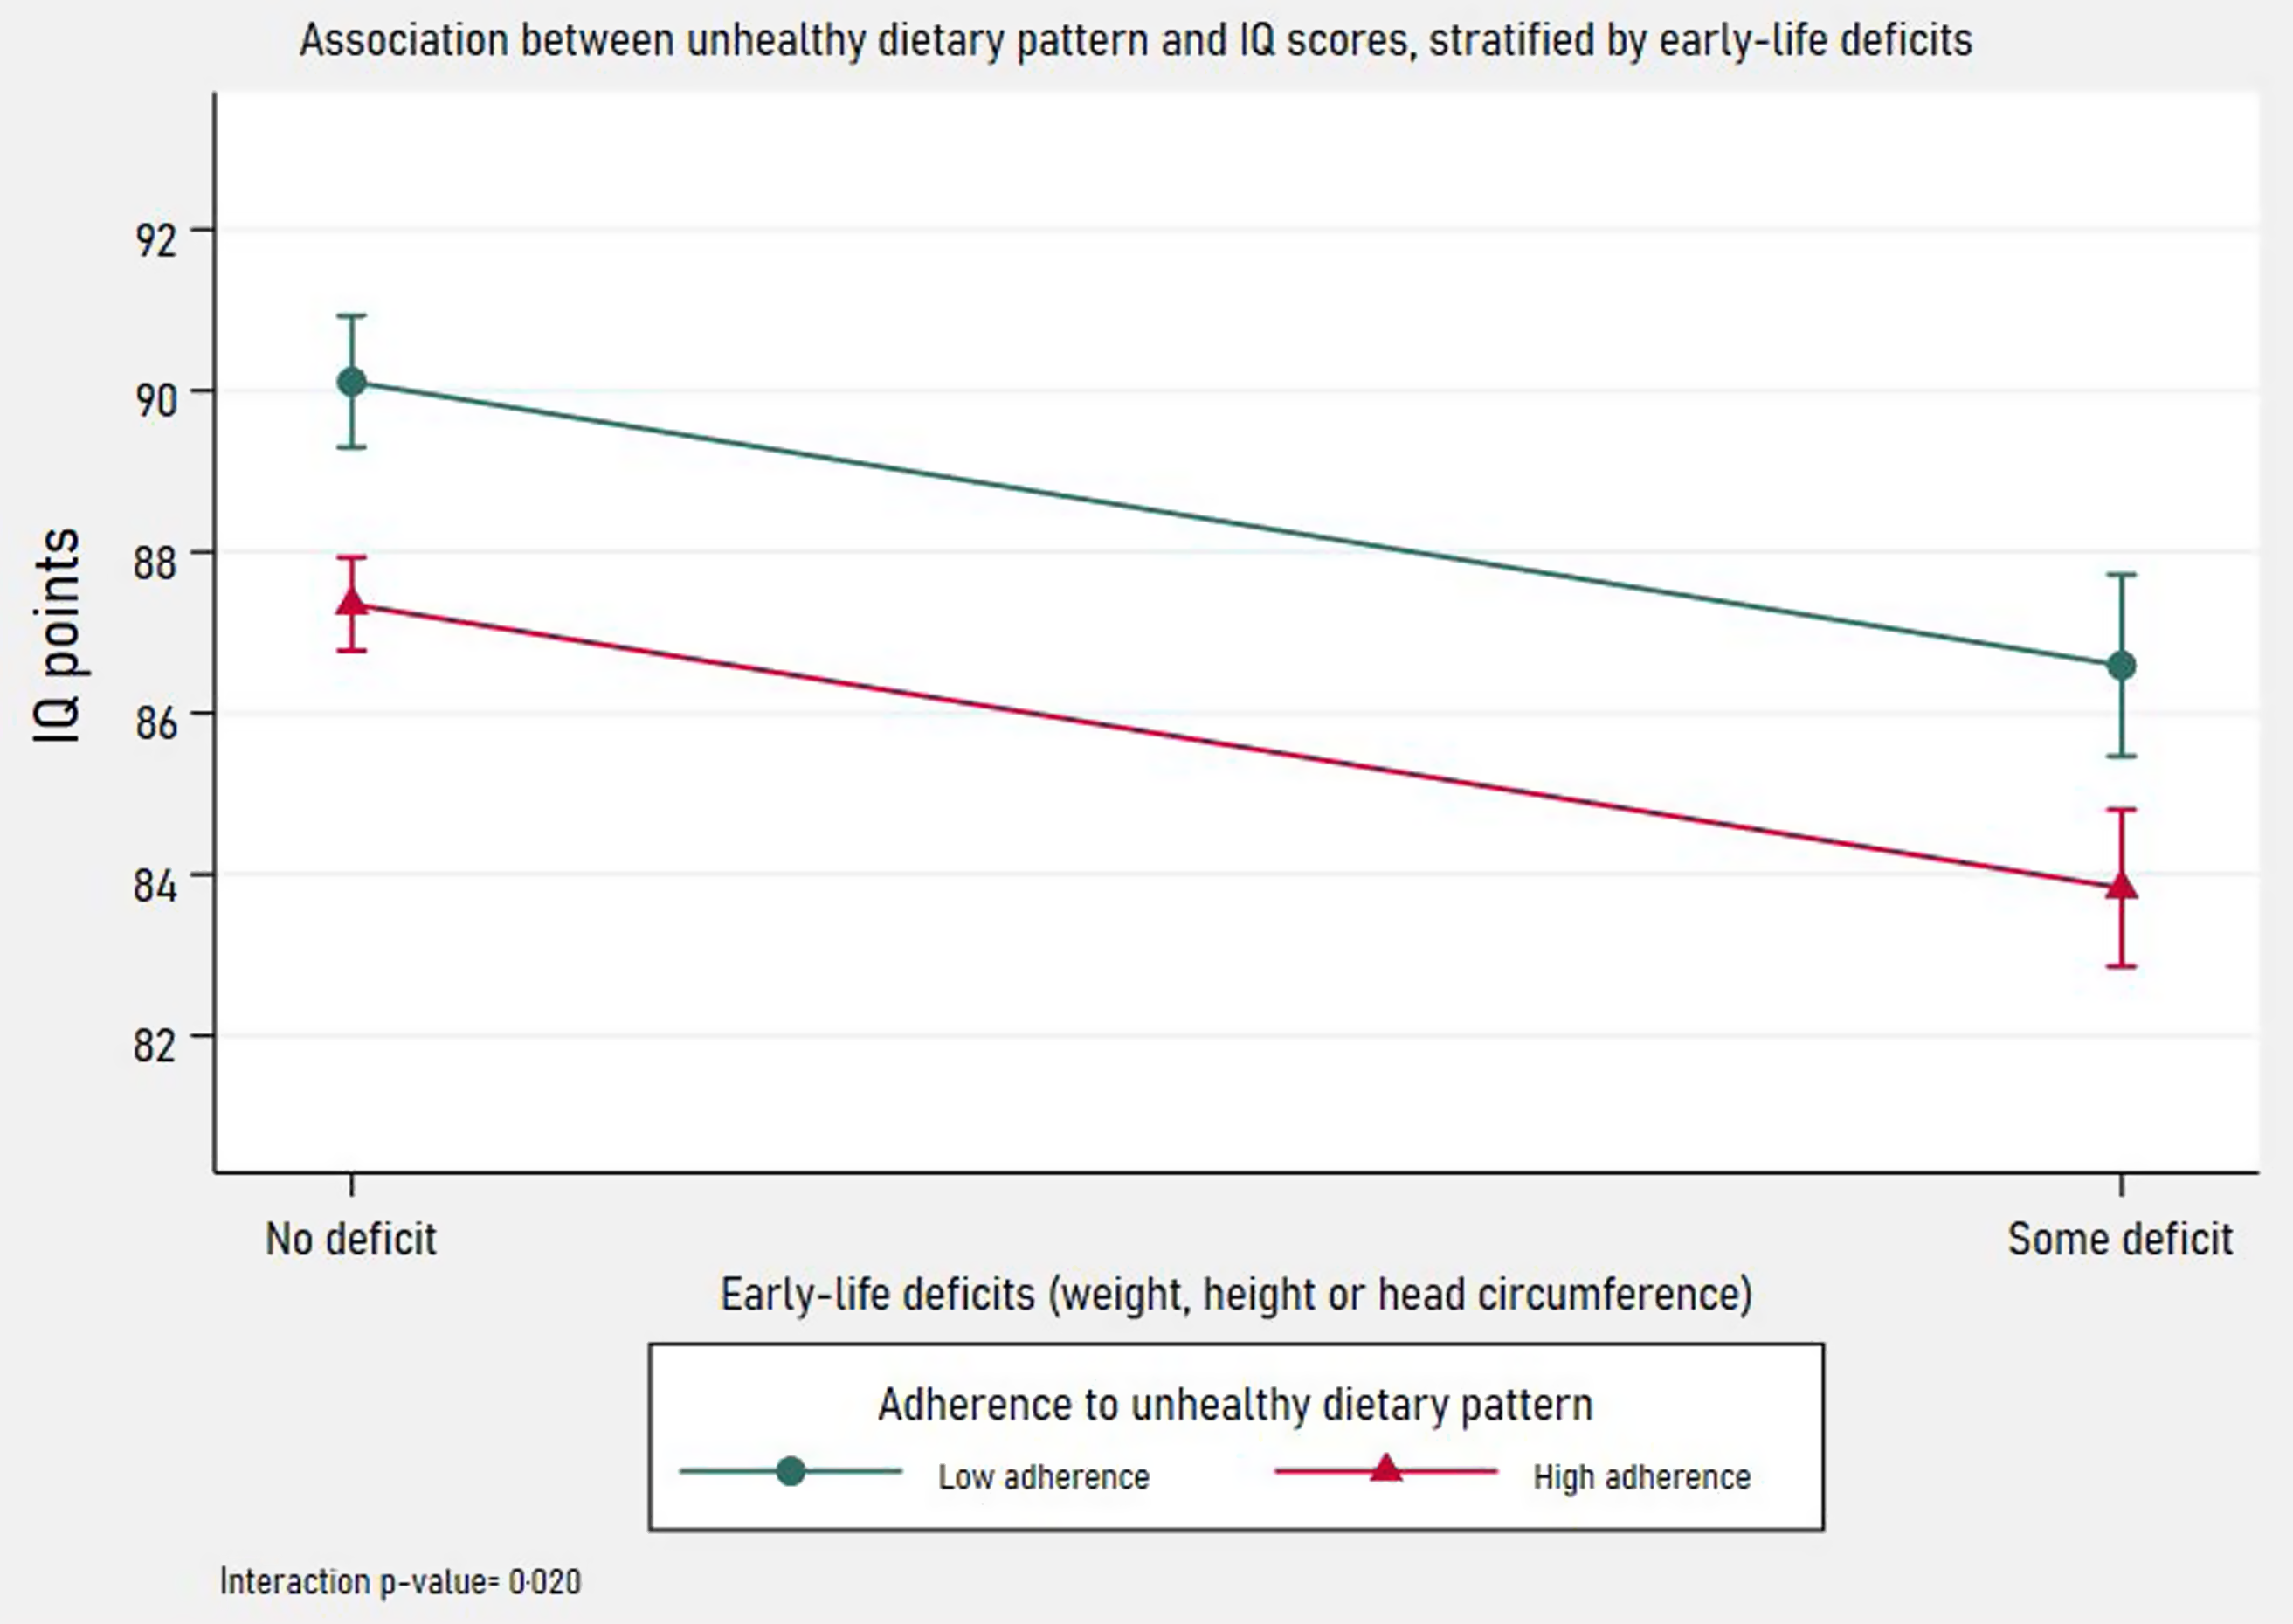
Exploratory interaction analyses identified that the association between adherence to the unhealthy dietary pattern and IQ scores was significantly modified by the presence of early-life deficits (weight, height or head circumference for age) (interaction P = 0·020 in the adjusted analysis) (Figure 2). No evidence of effect modification was found for sex, birth weight, gestational age or duration of exclusive breastfeeding in the adjusted analysis (P > 0·05 for all variables).
Adjusted* association between adherence† to unhealthy dietary pattern at 2 years of age and cognitive performance at 6–7 years: effect modification by early-life deficits (weight, height or head circumference). Pelotas Birth Cohort, 2015, Brazil. Legend: IQ, intelligence quotient. *Adjustments for child’s sex, maternal age, maternal schooling, maternal work, maternal depression, family structure, parental relationship, socio-economic status, number of people in the household, number of older siblings, preschool, score of stimulation, duration of exclusive breastfeeding and food introduction before 6 months. † Low adherence (first tercile) and high adherence (second and third terciles).

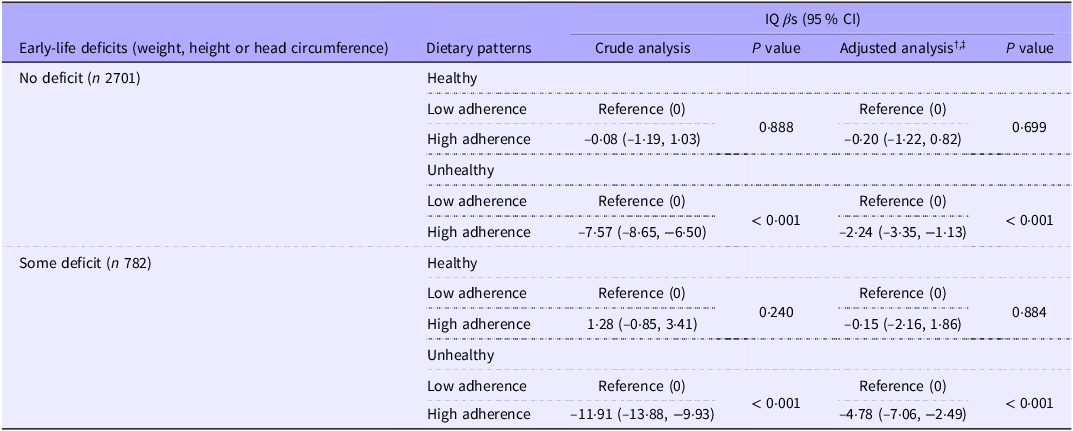
The association analysis showed a strong negative association between the unhealthy dietary pattern and IQ scores, both in the crude and adjusted analyses (P < 0·001). Children with high adherence to the unhealthy dietary pattern and deficits in weight, height or head circumference for their age showed a 4·78-point reduction in IQ (95 % CI: −7·06, −2·49) compared with those with low adherence. In contrast, children without such deficits had a 2·24-point reduction in IQ (95 % CI: −3·35, −1·13), even after adjusting for covariates. On the other hand, no significant associations were identified between the healthy dietary pattern and IQ scores (Table 3).
Crude and adjusted associations between low and high adherence * to healthy and unhealthy dietary patterns at age 2 and IQ at ages 6–7, stratified by early-life deficits (weight, height or head circumference). Pelotas Birth Cohort, 2015, Brazil (n 3483)

IQ, intelligence quotient; βs, beta coefficients; CI: confidence interval.
* Low adherence (first tercile) and high adherence (second and third terciles).
† Adjustments for child’s sex, maternal age, maternal schooling, maternal work, maternal depression, family structure, parental relationship, socio-economic status, number of people in the household, number of older siblings, preschool, score of stimulation, duration of exclusive breast-feeding and food introduction before 6 months.
‡ n of the adjusted analysis: no deficit (n 2393) and some deficit (n 647).
As a sensitivity analysis, inverse probability weighting was performed using the simplest specification (main effects only), which provided adequate covariate balance and an acceptable weight distribution. Absolute standardised differences before and after inverse probability weighting are shown in online Supplementary Figure 2. Although weighting further improved covariate balance, the weighted models yielded effect estimates virtually identical to the unweighted crude and adjusted analyses, indicating that the findings were robust to missing covariate data (online Supplementary Table 1).
Additional adjustments incorporating a broader set of confounding variables related to child and gestational characteristics (online Supplementary Table 2) did not change the significance levels or materially affect the effect measures (online Supplementary Table 3). Supplementary analyses using continuous scores of dietary patterns and mutually exclusive categories of patterns also produced consistent findings (online Supplementary Tables 4 and 5).
Discussion
In this study, two main dietary patterns were identified among children at age 2: one predominantly consisting of foods considered healthy, and the other characterised by high consumption of foods considered unhealthy, primarily ultra-processed foods (UPF). The main results indicate that the unhealthy dietary pattern was statistically associated with lower IQ scores at ages 6–7, even after adjusting for a wide range of confounders, including family and socioeconomic factors, maternal, gestational and child characteristics and aspects related to the child’s care and feeding. Furthermore, in the interaction analysis, early-life deficits (weight, height or head circumference for age) intensified the negative effect of high adherence to an unhealthy dietary pattern on children’s IQ scores. However, no statistically significant associations were observed between the healthy dietary pattern and cognitive performance.
In general, the results of this study align with those of other longitudinal studies conducted in high-income countries, which reported lower IQ scores in children with greater adherence to less healthy patterns during the early years of life(Reference Marinho, Severo and Vilela31–Reference Smithers, Golley and Mittinty34). Previous studies with children from the Avon Longitudinal Study of Parents and Children cohort reported a reduction of up to 2 IQ points (ranging from 0·68 to 1·67 points) at age 8 in children with higher scores in less healthy dietary patterns between 6 months and 3 years of age, primarily characterised by UPF high in salt, fat and sugar(Reference Northstone, Joinson and Emmett33,Reference Smithers, Golley and Mittinty34) .
However, comparing the results with the literature can be difficult due to the different methodological approaches, including the study design, the variability of the techniques used to assess dietary intake and the use of different psychometric instruments to assess cognitive abilities(Reference Leventakou, Roumeliotaki and Sarri28,Reference Marinho, Severo and Vilela31) . In addition, among the few studies available on children, the target populations were substantially different, including mainly children from high-income countries(Reference Leventakou, Roumeliotaki and Sarri28–Reference Smithers, Golley and Mittinty34), which may reflect on the quality of the food consumed(Reference Mayén, Marques-Vidal and Paccaud36,Reference Allen, Williams and Townsend55,Reference Turrell and Vandevijvere56) .
In the analyses presented in this study, the detrimental effect on cognitive performance observed among children with high adherence to an unhealthy dietary pattern was even greater among those with deficits in weight, height or head circumference. For children without these deficits, the reduction in IQ was approximately 2 points, while for those with deficits, it was nearly 5 points, suggesting that these children are more vulnerable to the adverse effects of an unhealthy dietary pattern.
Similar results were found by a study that observed that the daily consumption of margarine in children born small for gestational age at the age of 3 was associated with a reduction of approximately 4 points in IQ at the age of 7(Reference Theodore, Thompson and Waldie57). Furthermore, a longitudinal study carried out in the Netherlands with adolescents observed that a less healthy pattern adopted when they were 1-year old, similar to the Western pattern (characterised by processed foods, high in fat and sugar), negatively influenced brain volume at 10 years and IQ at 13 years, suggesting that brain morphology may be a mediator of the effect of unhealthy dietary intake on later cognitive performance(Reference Mou, Blok and Barroso32).
Previous studies have shown that birth conditions and postnatal growth can influence later cognitive ability(Reference Nilsen, Ruiz and Tulve35,Reference Camargo-Figuera, Barros and Santos58–Reference Ahmed, Kramer and Bernard60) . Children with a deficit in height and head circumference from birth to the first year of life were more likely to be classified as having a low IQ(Reference Camargo-Figuera, Barros and Santos58). In addition, other studies suggest that insufficient growth during the first two years of life is related to impaired cognitive development(Reference Black, Walker and Fernald61). Thus, despite the high prevalence of deficits observed in this study, the results are consistent with those of another birth cohort study conducted in Brazil, which reported prevalence rates of 12 %, 17·2 % and 8·8 % for weight, height and head circumference deficits for age during the first year of life, respectively(Reference Camargo-Figuera, Barros and Santos58).
A possible explanation for the lower IQ scores among children with high adherence to the unhealthy pattern is the rapid brain development that occurs during the early years of life(Reference Grantham-McGregor, Cheung and Cueto1,Reference Thompson and Nelson2) , in which brain plasticity is more pronounced, making the brain more susceptible to environmental influences(Reference Bee and Boyd62). Other biological mechanisms capable of explaining the observed association between the unhealthy dietary pattern and cognitive performance may be related to the gut–brain axis, since diet in the first years of life can affect the composition of the gut microbiota(Reference Laursen, Andersen and Michaelsen63,Reference Koenig, Spor and Scalfone64) and thus influence gut–brain communication and brain functions(Reference Dalile, Van Oudenhove and Vervliet65). The dissemination of a Western lifestyle, characterised by diets rich in UPF with high levels of fat, Na, sugar and food additives but low in nutrients and fibre, can lead to changes in microbial composition, damage to intestinal barrier functions and compromise the metabolism of neurotransmitters in the gut and brain, impacting brain functions(Reference Derrien and Veiga66,Reference Song, Song and Liu67) .
Among the studies that did not observe similar associations for a pattern considered less healthy, the following characteristics are highlighted: (a) low proportion of variance explained by the identified dietary pattern, which may compromise the ability to detect significant associations(Reference Leventakou, Roumeliotaki and Sarri28); (b) the use of cross-sectional approaches, which do not allow the assessment of the long-term consequences of an unhealthy diet(Reference Leventakou, Roumeliotaki and Sarri28,Reference Marinoni, Giordani and Mosconi29) and (c) the limited representation of lower socio-economic groups in the analysed samples, which may reflect the types of foods consumed(Reference Gale, Martyn and Marriott30), given the lower consumption of unhealthy foods among wealthier individuals in high-income countries(Reference Turrell and Vandevijvere56).
In contrast to the findings presented here, other studies have identified positive associations between dietary patterns considered healthier and cognitive performance(Reference Gale, Martyn and Marriott30,Reference Smithers, Golley and Mittinty34) . A study with children from Avon Longitudinal Study of Parents and Children showed that higher adherence to a healthier pattern at 1 and 2 years of age (characterised by the consumption of fruits, vegetables, fruit juices, cheese and eggs) was associated with slightly higher IQ scores at 8 years of age(Reference Smithers, Golley and Mittinty34).
In this study, the lack of association observed for the healthy dietary pattern can be largely explained by its lower variability (8·7 %) compared to the unhealthy pattern (14·6 %). This lower variability is primarily due to the fact that a very high proportion of children in the analytical sample (approximately 92 %) habitually consumed four or more of the foods that characterise the healthy pattern. As a result, most children had similar consumption values, which reduced differences between individuals and, consequently, the statistical ability to detect significant associations. Findings from a Brazilian study based on data from the National Health Survey support this explanation, showing that most of the Brazilian population in this age group regularly consumed beans, fruits and vegetables(Reference Santin, Gabe and Levy68) – foods that characterise this dietary pattern.
Furthermore, the results of this study show that the unhealthy dietary pattern at 2 years of age is predominantly characterised by the consumption of UPF. This finding is consistent with the growing availability of UPF in low- and middle-income countries, where these products are increasingly introduced early in childhood(Reference Pries, Filteau and Ferguson69). In Brazil, previous evidence also shows a high frequency of these products in the diets of children up to 2 years of age(Reference Pereira, Buffarini and Domingues41,Reference Giesta, Zoche and Corrêa70–Reference Spaniol, Costa and Souza73) , a period during which their consumption should be avoided, as recommended by the Dietary Guidelines for Brazilian Children(74). Early exposure to highly energy-dense and low-nutrient foods may displace the intake of more nutrient-rich options and shape food preferences for similar flavours later in life(Reference Calcaterra, Cena and Rossi75), potentially leading to higher consumption of UPF at older ages(Reference Conway, Heuchan and Heggie76). Considering that UPF consumption generally increases as children grow older(Reference Conway, Heuchan and Heggie76,Reference Leffa, Hoffman and Rauber77) , these findings may highlight how early dietary patterns can establish trajectories that influence cognitive performance. Subsequent dietary intake may also partly explain or contribute to the associations observed in this study. Taken together, these results reinforce concerns about the potentially harmful effects of these foods, including their possible influence on cognitive performance, as evidenced in this study.
The results of this study should be interpreted considering some limitations. First, the questionnaire used to assess dietary intake at age 2 is qualitative and does not capture the frequency or quantity of foods consumed. However, because it reflects habitual intake, foods consumed very frequently or very rarely tend to be reported with reasonable accuracy(Reference Pereira, Sichieri, Kac, Sichieri and Gigante78), and the instrument was developed based on Brazilian National Food and Nutrition Surveillance System dietary markers, which are commonly used in Primary Health Care to identify healthy and unhealthy eating practices(40). Second, parents’ reports of their children’s unhealthy dietary intake may be underestimated. However, as this is expected to be a non-differential error, and therefore independent of children’s cognitive performance, it would tend to underestimate the associations observed. Third, the study did not include variables such as maternal cognitive performance and diet during pregnancy, which were identified as relevant in the causal structure. Given this limitation, the analyses included additional adjustments for gestational characteristics and behaviours (such as pre-gestational BMI, gestational weight gain, physical activity, smoking, alcohol consumption and number of prenatal visits), which may correlate with maternal diet during pregnancy; however, their inclusion did not change the magnitude or significance of the results. Although maternal cognitive performance was not directly measured, its influence on cognitive stimulation(Reference Marinho, Severo and Vilela31) was addressed by adjusting for a stimulation score(Reference Barros, Matijasevich and Santos50) and by using maternal schooling as a proxy, given its well-established positive correlation with intelligence(Reference Strenze79,Reference Deary, Strand and Smith80) .
The study has several strengths. First, it is one of the few longitudinal studies conducted in Brazil, following individuals from birth to childhood, allowing for the assessment of the long-term effects of dietary intake on cognitive performance. Additionally, it is among the few studies conducted in a middle-income country to examine this association, providing insight into a distinct socio-economic context, and is also one of the first to report effect modification based on the presence of early-life deficits (weight-for-age, height-for-age or head circumference-for-age). The high follow-up rates and, consequently, the large sample size further strengthen the study. Furthermore, childhood cognitive performance was assessed by trained and standardised psychologists, minimising information bias and ensuring consistency in assessments. Moreover, the analyses considered several potential confounding factors and were conducted using a robust data analysis strategy, including inverse probability weighting to mitigate possible selection bias. Additionally, the investigation of dietary patterns, including dietary intake and combinations rather than isolated nutrients and foods, is also a positive aspect, as it provides a broader perspective that better reflects what is observed in the sample, in contrast to studies focused on isolated foods and nutrients(Reference Allès, Samieri and Féart81). From a public health perspective, this approach can provide more actionable insights and guide policies aimed at promoting healthier eating habits(Reference Marques-Vidal, Waeber and Vollenweider82,Reference Schwerin, Stanton and Smith83) . Finally, supplementary analyses conducted using different strategies to assess dietary patterns demonstrated consistent results, reinforcing the robustness of the findings. However, further research should be encouraged to investigate this association across different socio-economic contexts and at distinct ages during childhood. Additionally, research exploring the biological mechanisms underlying the observed associations is warranted.
Although the attenuation levels observed in the adjusted effect estimates do not rule out the possibility of residual confounding, the results for the unhealthy dietary pattern seem consistent with the literature. Moreover, although the effect may be considered of small magnitude, resulting in a 2–4-point reduction in IQ among children with high adherence to the unhealthy dietary pattern, such changes might represent a clinically relevant effect, particularly when accumulated during a critical period of development. In public health contexts, even modest shifts in average cognitive scores, when applied across large populations, can have significant and disproportionate consequences, especially at the extremes of the distribution(Reference Carey, Ridler and Ford84,Reference Gilbert and Weiss85) .
The observed results reinforce the hypothesis that diet quality can influence cognitive performance and support the strengthening of programmes that promote healthy eating habits from the earliest years of life as a strategy to prevent deficits and improve cognitive performance. This is particularly important in low- and middle-income countries, where challenges related to childhood nutrition are even more pronounced, as it highlights the need to ensure that children have access to adequate quality food.
These findings also have important implications for public health actions. They underscore the urgent need for strategies that not only promote healthy eating but also explicitly aim to reduce the intake of UPF in early childhood, particularly among nutritionally vulnerable children. In Brazil, guidance on early feeding is an essential part of Primary Health Care, and our results reinforce the importance of strengthening counselling during routine child health visits, emphasising the need to limit the habitual offer of UPF. Moreover, these findings highlight an opportunity to improve the implementation of existing national recommendations, such as the Dietary Guidelines for Brazilian Children, given that, despite these established guidelines, the consumption of UPF is already common at this age(74).
Supplementary material
For supplementary material/s referred to in this article, please visit https://doi.org/10.1017/S000711452610628X
Acknowledgements
The authors thank the participants of the 2015 Pelotas Birth Cohort, their families and the fieldwork team involved in data collection.
This article is based on data from the study ‘Pelotas Birth Cohort, 2015’ conducted by the Postgraduate Program in Epidemiology at the Federal University of Pelotas with the collaboration of the Brazilian Public Health Association (ABRASCO). The first phase of the 2015 Pelotas (Brazil) Birth Cohort was funded by the Wellcome Trust (095582). Funding for specific follow-up visits was also received from the Conselho Nacional de Desenvolvimento Científico e Tecnológico (CNPq) and Fundação de Amparo a Pesquisa do Estado do Rio Grande do Sul (FAPERGS) and Children’s Pastorate sponsored follow-up at 24 months and FAPERGS – PPSUS and the Bernard van Leer Foundation (BRA-2018-178) for the 4-year follow-up. At the 4-year follow-up, the 2015 cohort was also funded by the Department of Science and Technology (DECIT/Brazilian Ministry of Health). The 6–7 years follow-up received funding from the Department of Science and Technology of the Ministry of Health (Department of Science and Technology (DECIT/Brazilian Ministry of Health), Instituto Todos Pela Saúde, Celer Biotecnologia SA, FAPERGS PqG 21/2551-0002004 −0 and CNPq through public notices: 407813/2021-7, 406582/2021-1 and 406582/2021-1. G. T. H. received support from CAPES. A. D. B. and M. R. D. received support from CNPq. M. X. C. is supported by the Wellcome Trust (grant number: 225019/Z/22/Z).
G. T. H., T. R. F. and A. D. B. contributed to the conception and development of analytic strategies for the study. T. R. F., M. R. D., P. C. H. and A. D. B. were involved in the fieldwork and data collection for the 2015 cohort. G. T. H. conducted the literature review, statistical analyses and drafted the manuscript. G. T. H., T. R. F., M. X. C., P. C. H., M. R. D. and A. D. B. made significant contributions to the data interpretation and critical revision of the text. All authors approved the final version of the manuscript.
The authors declare no conflicts of interest.