I. INTRODUCTION
The lifetimes of several key nuclear reactor components are highly influenced by radiation exposure over years of operation in complex harsh environments. In a nuclear reactor, the displacement damage from the neutron flux in combination with the products of different fission or fusion reactions accumulates inside material structures and modifies their physical attributes, including thermal properties. Reference Matzke1 Finding materials that can sustain the extreme conditions in a reactor remains a challenge. Reference Yvon and Carr2 Ion irradiation experiments have been used to rapidly screen new material responses to displacement damage and the accumulation of hydrogen isotopes, helium, or combinations thereof. Reference Was3 The volume that is damaged by ion irradiation is inherently limited by the end of range of the ion in the material of interest. As a result, characterization of these materials requires specialized measurement techniques that can quantify degradation, formation, and evolution of radiation induced damage in a near surface, submicrometer region. Reference David, Goms, Carlot, Roger, Fournier, Valot and Raynaud4
Degradation in the thermal conductivity of materials used in reactor fuel or fuel cladding is an issue that poses serious efficiency problems and safety concerns. The aftermath of the Fukushima accident (March 2011) revealed that during the tsunami, failure of the reactor cooling process led to what is known as loss of coolant accident. Reference Suud and Anshari5 In such situations, low thermal conductivity fuel, fuel pellets, or fuel cladding can impede heat removal from the reactor core contributing to disastrous consequences. Following this accident, the Nuclear Regulatory Commission (NRC) issued a letter to major nuclear fuel vendors requesting that their thermal performance analysis codes take into account the effects of thermal conductivity degradation from radiation damage. 6
Despite the critical need to understand the thermal properties of materials in nuclear applications, research in this domain has been relatively limited. In fact, discrepancies in the reported thermal conductivity of uranium dioxide have not been resolved until very recently, Reference Gofryk, Du, Stanek, Lashley, Liu, Schulze, Smith, Safarik, Byler, McClellan, Uberuaga, Scott and Andersson7 despite the ubiquitous use of uranium dioxide as a nuclear fuel for the past several decades. This result alludes to the importance of improving experimental techniques used to study the thermal properties of in-reactor material structures.
Several studies have investigated the effects of radiation damage on the thermal properties of different materials. Reference David, Goms, Carlot, Roger, Fournier, Valot and Raynaud4,Reference Tanabe8–Reference Ben-Belgacem, Richet, Terrani, Katoh and Snead16 In general, these studies reported a significant reduction in the thermal conductivities of the considered structures. Displacement damage and transmutation products inside materials act as defects or scattering sites for heat carriers. Electrons and phonons will scatter on point defects, grain boundaries, and other structural defects causing a reduction in thermal conductivity.
The importance of thermal characterization for nuclear power production along with the difficulty in resolving defects within submicrometer depths reflects the need for a well established experimental characterization technique for nuclear applications. Modulated photothermal techniques have been used for this purpose over the past few years. Reference David, Goms, Carlot, Roger, Fournier, Valot and Raynaud4,Reference Cabrero, Audubert, Pailler, Kusiak, Battaglia and Weisbecker17–Reference Pakarinen, Khafizov, He, Wetteland, Gan, Nelson, Hurley, El-Azab and Allen21 In these techniques, heating from a modulated optical source causes an oscillatory temperature field on the sample surface that is measured by phase sensitive detection instrumentation. David et al. Reference David, Goms, Carlot, Roger, Fournier, Valot and Raynaud4 used modulated thermoreflectance microscopy to study thermal conductivity degradation in irradiated ceramic materials. Jensen et al. Reference Jensen, Chirtoc, Horny, Antoniow, Pron and Ban19 used lock-in infrared thermography and photothermal radiometry to study the effect of proton irradiation on SiC. More recently, Khafizov et al. Reference Khafizov, Yablinsky, Allen and Hurley20 used a double color laser based modulated thermoreflectance method without a metal coating to report on the thermal conductivity of proton irradiated silicon. Pakarinen et al. Reference Pakarinen, Khafizov, He, Wetteland, Gan, Nelson, Hurley, El-Azab and Allen21 used time-resolved thermal wave microscopy to measure a reduction of 35–55% in the thermal conductivity of UO2 upon irradiation with 3.9 MeV of helium ions.
In this paper, we will focus on time-domain thermoreflectance (TDTR) as a technique to characterize the degradation of thermal properties in materials due to ion irradiation. TDTR is an optical nondestructive pump–probe experiment that has been widely used over the past three decades to study different thermal transport phenomena in bulk materials, nanostructures, and across interfaces. Reference Paddock and Eesley22–Reference Hopkins25 Recently, Oh et al. Reference Oh, Ravichandran, Liang, Siemons, Jalan, Brooks, Huijben, Schlom, Stemmer, Martin, Majumdar, Ramesh and Cahill26 and Tong et al. Reference Tong, Fu, Levander, Schaff, Pantha, Lu, Liu, Ferguson, Zhang, Lin, Jiang, Wu and Cahill27 used thermal measurements from TDTR as a metric for the crystalline quality of epitaxially grown SrTiO3 films and to resolve nanometer-scale disorders in In x Ga1−x N alloys, respectively. They demonstrated that thermal measurements through TDTR can detect defects and structural disorders beyond the resolution of traditional x-ray diffraction and high resolution transmission electron microscopes. Gorham et al. Reference Gorham, Hattar, Cheaito, Duda, Gaskins, Beechem, Ihlefeld, Biedermann, Piekos, Medlin and Hopkins28 used picosecond acoustics collected during TDTR measurements to suggest the existence of a vibrational bridge within 2.2 nm of the interface between aluminum and silicon that caused a reduction in thermal boundary resistance upon proton irradiation; a result not viable by conventional microscopy methods. In addition, electron-beam damage in scanning electron microscope (SEM) or transmission electron microscope (TEM) can further degrade the crystalline quality of samples and leads to the misinterpretation of performed measurements. Reference Smeeton, Kappers, Barnard, Vickers and Humphreys29,Reference Egerton, Li and Malac30 For example, Smeeton et al. Reference Smeeton, Kappers, Barnard, Vickers and Humphreys29 showed that inhomogeneous strain caused by electron-beam damage can lead to falsely detect indium clusters in TEM measurements on InGaN quantum wells. In addition, Weisensee et al. Reference Weisensee, Feser and Cahill12 used TDTR to study the effect of argon ion irradiation on epitaxially grown UO2 and U3O8 thin films.
In this study, we demonstrate the use of TDTR as a powerful, noncontact, nondestructive experimental method to study the effect of radiation induced damage on the thermal properties of materials used in advanced nuclear reactors. In Sec. II, we review the main components of a TDTR setup and briefly cover the different thermal transport phenomena that have been studied using this technique. In Sec. III, we present the first ever reported thermal conductivity results on optimized ZIRLO, a material that has been recently introduced as a fuel cladding in pressurized water reactors (PWR). In Sec. IV, we demonstrate the use of nanolayered metallic multilayers as effective radiation resistant materials. Helium and proton implantations of copper–niobium multilayers show no significant influence on the thermal conductivity. In Sec. V, we analyze the effect of varying ion dose and ion beam energy on the thermal conductivity of silicon. The increase in ion dose increases the number of defect sites while increasing the ion energy increases the projected range of ions into material, pushing defect sites deeper into silicon. The results show a decrease in thermal conductivity with ion dose and an increase in thermal conductivity with ion energy. In Sec. VI, we summarize our findings and mention a few experimental advancements that would facilitate the integration of TDTR into nuclear reactors. We support all of our findings with full cascade damage calculations using SRIM software simulations (Stopping and Range of Ions into Materials). Reference Ziegler, Ziegler and Biersack31
II. TDTR
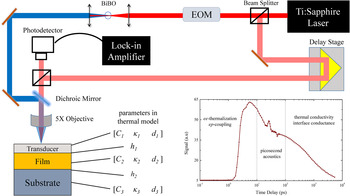
The thermal conductivities of all our samples were measured by TDTR. Reference Cahill23,Reference Schmidt, Chen and Chen24,Reference Hopkins, Serrano, Phinney, Kearney, Grasser and Harris32 Figure 1 shows the main components of our TDTR system. In our setup, a Ti:Sapphire laser emits a train of subpicosecond, light pulses at a central wave length of 800 nm and a repetition rate of 80 MHz. A polarizing beam splitter separates the laser output into two paths, a pump and a probe. The pump pulses are sinusoidally modulated by an electro-optic modulator (EOM) at a frequency f. The probe is directed along a mechanical delay stage that controls the relative optical path difference between the two beams. Both the pump and the probe are coaxially focused on the sample by an objective lens. The samples are usually coated with a metal film of thickness ∼50–100 nm that acts as a temperature transducer. The pump modulation creates an oscillatory temperature rise at the modulation frequency, f. The change in the surface temperature is assumed to be proportional to the change in the transducer reflectance for small temperature rises. The probe beam is backreflected into a photodetector carrying a frequency component at the pump modulation frequency. The change in the thermoreflectance signal due to the pump heating is of the order of 10−4 K−1 (Ref. Reference Wang, Park, Koh and Cahill33) and thus requires the use of a lock-in amplifier. The same modulation signal driving the EOM is supplied to a lock-in amplifier as a reference signal. The cooling of the sample after the created heating event is recorded by monitoring the change in the ratio of the in-phase to out-of-phase components of the lock-in signal while varying the time delay between the pump and probe. The time delay is controlled by a mechanical delay stage, which can move in steps that create a pump–probe time delay of a few femtoseconds, giving a temporal resolution that is only limited by the laser pulse width (less than 1 ps). We note that in our setup, we convert the 800 nm pump light into 400 nm light using a BiBO crystal, which is a nonlinear optical crystal that applies a second harmonic generation to the incident light. Reference Ghotbi, Ebrahim-Zadeh, Majchrowski, Michalski and Kityk34 This conversion better filters and isolates the pump from the photodetector through the use of long-pass optical filters.
A simplified schematic of the main components of our TDTR system. In the thermal model, each layer is represented with three parameters: the volumetric heat capacity, C, the thermal conductivity, κ, and the thickness, d. The figure also shows a plot of a typical TDTR measurement. The plot was shifted by +7 ps to allow for logarithmic scaling.

Figure 1 shows a sample data set from a TDTR scan divided into three time regimes. During the first few picoseconds, electrons in the metal transducer absorb the energy in the pump pulse. Hot electrons thermalize quickly and transfer their energy to the cold lattice. This time regime is suitable to study the physics of nonequilibrium electrons and the dynamics of electron–phonon coupling. Reference Eesley35–Reference Giri, Foley and Hopkins37 The rapid, near surface-localized heating of the metal transducer creates a strain wave originating from the pulse-induced thermal expansion that propagates through the transducer at the speed of sound. Due to the acoustic mismatch between the transducer and the film, a portion of the wave gets reflected back to the surface and records as an acoustic echo in the thermoreflectance signal. The shape and time delay of the acoustic echoes can be used to investigate the atomic bonding and disorder at the interface, Reference Gorham, Hattar, Cheaito, Duda, Gaskins, Beechem, Ihlefeld, Biedermann, Piekos, Medlin and Hopkins28,Reference Tas, Loomis, Maris, Bailes and Seiberling38,Reference Losego, Grady, Sottos, Cahill and Braun39 determine the thickness of the transducer, and study the generation, attenuation, and transmission of phonons across interfaces. Reference Thomsen, Strait, Vardeny, Maris, Tauc and Hauser40,Reference Thomsen, Grahn, Maris and Tauc41
The third time regime corresponds to the diffusion of heat from the transducer to the film via phonon–phonon, electron–electron, or electron–phonon interactions. In a typical TDTR measurement, the data collected in this regime are compared to the solution of the heat diffusion equation in a multilayer structure. In this solution, each layer has three corresponding parameters: the volumetric heat capacity, C, the thermal conductivity, κ, and the layer thickness, d. The thermal interface conductance, h, between layers adds an additional unknown in the thermal model. At most, two parameters can be fit from a single TDTR measurement. The other parameters are often taken from literature or estimated. The details of the thermal model are given elsewhere.
Reference Cahill23,Reference Schmidt, Chen and Chen24,Reference Hopkins, Serrano, Phinney, Kearney, Grasser and Harris32
The components of our apparatus are linked together through a Labview code. The sample plot shown in Fig. 1 takes ∼3 minutes to generate using our TDTR setup at the University of Virginia. In general, 4–5 measurements are performed on each sample totaling a time of less than 15 minutes. Given the small laser spot sizes used in TDTR (2–100 µm), a typical sample area can be as small as 0.25 cm2. This area is mainly for the ease of sample handling. In theory, we can characterize areas as small as the laser spot sizes and TDTR has been utilized to perform thermal conductivity maps with micrometer scale resolutions.
Reference Huxtable, Cahill, Fauconnier, White and Zhao42,Reference Zheng, Cahill and Zhao43
The thicknesses of the samples that can be tested using TDTR are only limited by the thermal penetration depth, given by
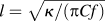 $l = \sqrt {{\kappa \mathord{\left/ {\vphantom {\kappa {\left( {\pi Cf} \right)}}} \right. \kern-\nulldelimiterspace} {\left( {\pi Cf} \right)}}}$
(Ref. Reference Koh, Singer, Kim, Zide, Lu, Cahill, Majumdar and Gossard44). For typical TDTR modulation frequencies (100 kHz–20 MHz), this depth is on the order of a few ten's of nanometers to a few micrometers, depending on the thermal conductivity and heat capacity of the sample. By changing the pump modulation frequency, we vary the thermal penetration depth and can resolve defects and interfaces located at different depths from the sample surface.
Reference Hopkins, Duda, Clark, Hains, Rotter, Phinney and Balakrishnan45
This illustrates that TDTR can be used to probe small volume scales and can characterize depth dependent damage.
All TDTR measurements reported in this study were performed at room temperature with laser spot radii of 25 and 12 µm for the pump and probe beams, respectively.
III. OPTIMIZED ZIRLO
Zirconium alloys, or Zircaloys, are used as fuel cladding to separate nuclear fuels from coolant liquid in PWR. Zirconium has a low neutron scattering cross-section, high hardness, and high corrosion resistance making it suitable for high temperature and high mechanical strength nuclear applications. However, the oxidation of zirconium in water or air can significantly degrade its corrosion resistance Reference Allen, Konings, Motta and Konings46 and increase hydrogen pick-up which can lead to embrittlement. As a result, numerous studies have been conducted to increase the corrosion resistance of Zircaloys and improve their mechanical properties.
ZIRLO, a low oxidation Zircaloy, was introduced in the early nineties and has demonstrated superior performance compared to the widely used Zircaloy-4 at that time. A remarkable decrease in PWR fuel rod failure rates has been observed upon replacement of Zircaloy-4 with ZIRLO in several nuclear reactors across the world. Reference Kim47 The composition of ZIRLO is mostly zirconium with 1 wt% niobium, 1 wt% tin, and 0.1 wt% iron. Recently, Westinghouse developed a new cladding material, optimized ZIRLO, by reducing the tin content to 0.6–0.8 wt% while keeping the niobium and iron content the same as in ZIRLO. Reference Foster, Yueh and Comstock48 This optimized ZIRLO has better corrosion resistance, higher fuel burn-ups, and similar creep rate as compared to ZIRLO. Reference Wikmark, Hallstadius and Yueh49
The thermal properties of these cladding materials represent a critical parameter in reactor design, especially when using them at high temperatures for high fuel burn ups. To the best of our knowledge, the thermal properties of optimized ZIRLO are relatively unknown. In this section, we report measurements on the thermal conductivity of optimized ZIRLO using TDTR. The measurements can be used as a baseline for comparison to thermal conductivity degradation due to ion irradiation by researchers in the field.
We measured the thermal conductivity of two samples of optimized ZIRLO that were cut from different areas of the same metal sheet. The samples were ∼1 mm thick with an area of about 1.5 cm2 and were coated with ∼76 nm of aluminum for TDTR measurements.
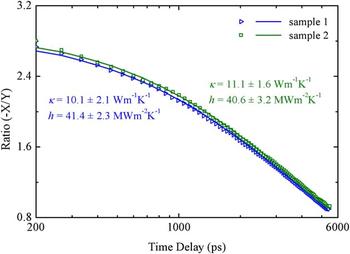
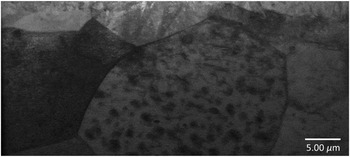
Figure 2 shows the TDTR data, best fit model calculations, and best fit values for the thermal conductivity of the two optimized ZIRLO samples, along with the best fit values for the interface conductance between the Al coating and optimized ZIRLO. For TDTR analyses, we use a two layer model where the properties of the aluminum film were taken from the literature and the volumetric heat capacity of optimized ZIRLO is taken as the weighted average of its constituent metals. The two unknowns in the thermal model are the thermal conductivity of the optimized ZIRLO, κ, and the thermal interface conductance, h, between aluminum and optimized ZIRLO. These two parameters were varied to fit the data to our thermal model. At least seven measurements were performed at different locations on each of the samples. We obtain a thermal conductivity of optimized ZIRLO and Al/optimized ZIRLO interface conductance of 10.1 ± 2.1 W m−1 K−1 and 41.4 ± 2.3 MW m−2 K−1 for sample 1 and 11.1 ± 1.6 W m−1 K−1 and 40.6 ± 3.2 MW m−2 K−1 for sample 2, respectively. The spread in the thermal conductivity is larger than what we expect from a typical TDTR measurement on different locations of a typical sample. This spread can be attributed to the local variation of thermal conductivity over the optimized ZIRLO sheet that the samples were cut from. A TEM image for a sample taken from the same sheet is shown in Fig. 3 and reveals a significant variation in microstructure over a small area. Therefore, we report the average of the two samples, 10.7 ± 1.8 W m−1 K−1, as the thermal conductivity of optimized ZIRLO.
Data points (symbols) and best fit curves (solid lines) for the TDTR measurements on Al/optimized ZIRLO samples 1 and 2. The average thermal conductivity of optimized ZIRLO from the two measured samples is 10.7 ± 1.8 W m−1 K−1 as determined from our multiple TDTR measurements.

Cross-sectional TEM (Ref. 50) on optimized ZIRLO showing the variation in the microstructure.

IV. COPPER NIOBIUM MULTILAYERS
The reduction in the thermal conductivity due to ion radiation Reference David, Goms, Carlot, Roger, Fournier, Valot and Raynaud4,Reference Tanabe8–Reference Ben-Belgacem, Richet, Terrani, Katoh and Snead16 alludes to the importance of developing high radiation tolerant materials. It is well known that interfaces can act as sinks for point-defects. High interface densities can be achieved by fabricating nanoscale multilayers. Chemical and thermal stabilities at the interface of such multilayers are important factors in the design of radiation tolerant structures. It has been demonstrated that nanolayered Cu–Nb multilayers show abrupt interfaces with no intermixing up to temperatures as high as 800 °C, Reference Misra, Hoagland and Kung51 a result of their positive enthalpy of mixing. The chemical and thermal stabilities of these structures make them promising candidates for developing model systems to aid in the design of in-reactor radiation resistant materials. Reference Zhernenkov, Gill, Stanic, DiMasi, Kisslinger, Baldwin, Misra, Demkowicz and Ecker52 Radiation damage from helium implantation of nanolayered Cu–Nb structures has been extensively studied in the past few years. Reference Zhernenkov, Gill, Stanic, DiMasi, Kisslinger, Baldwin, Misra, Demkowicz and Ecker52–Reference Demkowicz, Misra and Caro56 Studies have shown that interfaces in Cu–Nb multilayers can trap high concentrations of helium, shrinking down helium bubble sizes to 1–2 nm in short period thickness samples (4–5 nm) Reference Höchbauer, Misra, Hattar and Hoagland53,Reference Hattar, Demkowicz, Misra, Robertson and Hoagland54 and leading to a reduction in swelling. Reference Zhernenkov, Gill, Stanic, DiMasi, Kisslinger, Baldwin, Misra, Demkowicz and Ecker52 To the best of our knowledge, there has been no thermal conductivity measurements conducted on these materials. In this section, we investigate the effect of proton and helium ion irradiation on the thermal conductivity of Cu–Nb multilayers. The irradiation of metallic multilayers can lead to a degradation in the thermal conductivity of the layers or a reduction in the thermal interface conductance between the layers due to ion beam mixing. Reference Gundrum, Cahill and Averback57
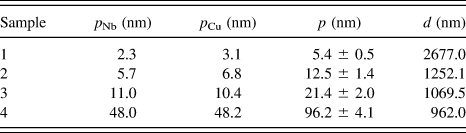
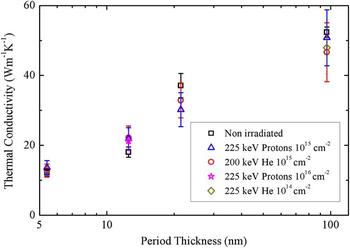
Four Cu–Nb multilayer films were synthesized via DC magnetron sputtering. Sample details are given in Table I. The films were grown on intrinsic (100) silicon substrates. The average period thicknesses ranged from 5.4 to 96.2 nm and the total film thickness between 962 and 2677 nm. Two sets of repeats of the same samples were then ion irradiated. The first set was irradiated with 225 keV of protons to ion doses of 1015 cm−2 and the other set was implanted with 200 keV helium ions to the same ion doses. Additionally, a repeat of sample 4 was irradiated with 225 keV helium ions to a dose of 1014 cm−2 and another repeat of sample 2 was irradiated with 225 keV protons to a dose of 1016 cm−2. All samples were coated with 75 nm of aluminum after ion irradiation for TDTR measurements. A total of five TDTR measurements were performed on each sample to determine the thermal conductivity of the Cu–Nb multilayers.
Layer thickness, p Nb or p Cu, period thickness, p, and total thicknesses, d, of the Cu–Nb samples.

In the TDTR analyses, the heat capacity and thermal conductivities of the Al film and the silicon substrate were taken from the literature. A weighted average of the bulk heat capacities of Cu and Nb was used for the heat capacity of the Cu–Nb multilayer sample. We assume that the thermal resistance between the Cu–Nb multilayer film and the silicon substrate is negligible. Hence, the Al/Cu–Nb interface conductance and the thermal conductivity of the Cu–Nb film are the only unknowns in our thermal model and are simultaneously varied to fit the data to the model using a nonlinear least-square fitting routine.
The thermal conductivity results on the control and irradiated samples are shown in Fig. 4, plotted as a function of period thickness. It is evident that within experimental uncertainties, ion irradiation did not cause a reduction in the thermal conductivity of Cu–Nb multilayers. Even at helium implants with energy as high as 200 keV and doses of 1015 cm−2 and proton implants of 225 keV and 1016 cm−2, no significant changes in thermal conductivities were observed. It has been shown that Cu–Nb interfaces have high excess atomic volume due to constitutional vacancy concentrations. Reference Demkowicz, Bhattacharyya, Usov, Wang, Nastasi and Misra55 As a result, radiation induced vacancies and interstitials are attracted to the interface and have a high probability of annihilation. Reference Zhang, Li, Anderoglu, Wang, Swadener, Höchbauer, Misra and Hoagland58 Such annihilation processes may lead the irradiated Cu–Nb samples to recover the thermal conductivity of the nonirradiated samples.
Thermal conductivity of Cu–Nb multilayers plotted versus period thickness. The figure shows that ion irradiation of different energies and doses of helium ions or protons does not affect the magnitudes of thermal conductivity of Cu–Nb multilayers. This demonstrates the possibility of using Cu–Nb multilayers as radiation resistant materials in advanced nuclear systems.

To better understand the effect of ion implantation on our samples, we perform SRIM calculations on sample 4 (see Table I). The calculations show that the 200 keV helium and 225 keV proton implantations to doses of 1015 cm−2 will lead to a projected range and longitudinal straggle thickness of ∼509 and 110 nm for the helium implantation and ∼1.16 µm and 164 nm for the proton implantation, respectively. We note that the thermal penetration depth at the TDTR modulation frequency of 8.8 MHz in the four samples ranges from ∼400 nm for the least conductive sample to 770 nm for the most conductive one. This means that for the case of helium implantation, the straggle falls on the verge of the penetration depth for sample 1 to within that for sample 4 and falls completely outside the thermal penetration depth for the proton irradiated set of samples. This suggests that regardless of whether TDTR is sampling the most defected region or not, no change in thermal conductivity is observed in these Cu–Nb multilayers. This is in contrast to the results in Sec. V, where we show that the thermal conductivity of silicon depends on the location of the defected region with respect to the thermal penetration depth. SRIM calculations also show that helium and proton irradiations produce 185 and 21.6 vacancies per ion, respectively. In addition, helium results in approximately 0.09 displacements per atom (dpa) at the peak of the target recoil distribution. These numbers are unlikely to cause a reduction in the thermal conductivity of copper or niobium films. Reference Birtcher and Blewitt59 The thermal interface conductance between copper and niobium layers can be deduced from the thermal conductivity measurements using a series resistor model. Reference Wilson and Cahill60,Reference Cheaito, Hattar, Gaskins, Yadav, Duda, Beechem, Ihlefeld, Piekos, Baldwin, Misra and Hopkins61 Given that the thermal conductivities of the Cu–Nb multilayer samples were not affected by ion irradiation, we conclude that the interface conductance between individual Cu and Nb layers is rendered unchanged. Gundrum et al. Reference Gundrum, Cahill and Averback57 reported the existence of 9 nm intermixed interfacial layer at aluminum–copper interface for 1 MeV of krypton ion irradiation to a dose of 3 × 1015 cm−2. While we can not confirm whether ion beam mixing occurred in our ion irradiated Cu–Nb samples, we can safely claim that if ion beam mixing existed, it did not affect the transport in these structures. Further experiments with higher irradiation doses are required to further assess effects of radiation induced damage on metallic multilayers.
V. ION DOSE VERSUS ION BEAM ENERGY
So far, we have demonstrated the use of TDTR to evaluate the impact of ion implantation on two different metallic systems through direct measurement of their thermal conductivities. Thermal conductivity measurements have proven to be highly sensitive to point defects and can be used to assess the quality of different materials. Reference Oh, Ravichandran, Liang, Siemons, Jalan, Brooks, Huijben, Schlom, Stemmer, Martin, Majumdar, Ramesh and Cahill26,Reference Tong, Fu, Levander, Schaff, Pantha, Lu, Liu, Ferguson, Zhang, Lin, Jiang, Wu and Cahill27 The distribution of point defects resulting from ion irradiation into materials is dictated by the ion beam energy and the ion dose. The former dictates the magnitude of ion concentration inside materials while the latter determines the depth at which this concentration is maximum. Both parameters influence the level of induced damage.
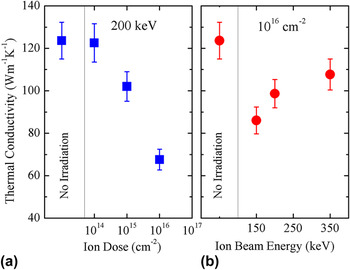
In this section, we use TDTR to study the effect of varying ion doses and ion beam energies on the evolution of the thermal conductivity of silicon subjected to proton irradiation. The thermophysical properties of silicon are well known and silicon has often been used as a reference material for TDTR measurements. Two sets of samples were prepared. In the first set, we subject three silicon samples to different proton doses of 1014 cm−2, 1015 cm−2, and 1016 cm−2 at a fixed beam energy of 200 keV. This creates disordered regions of different defect concentrations but of the same projected range into the three samples. For the second set, we fix the ion dose to 1016 cm−2 and subject our samples to ion beam energies of 150, 200, and 350 keV. The ion beam energies create a defected region (straggle) at different depths from the silicon surface. After the ion irradiation, samples are coated with 90 nm of aluminum for TDTR measurements. For TDTR analyses, we use a two-layer thermal model in which the only unknowns are the thermal conductivity of silicon and the thermal interface conductance between aluminum and silicon. All the other parameters are taken from the literature.
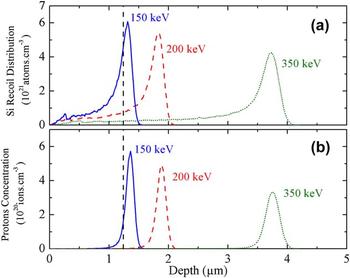
Thermal conductivity measurements on the irradiated samples are shown in Fig. 5 along with those results from a nonirradiated control sample for comparison. In Fig. 5(a), a decrease of ∼45% in thermal conductivity is observed comparing the nonirradiated sample to the sample subjected to maximum irradiation dose. This decrease in thermal conductivity is directly related to the increase in the defect concentration due to the increase in irradiation dose. The observed trend mimics the evolution of thermal conductivity and possibly other physical properties in radiation rich environments. Figure 5(b) shows the thermal conductivity versus proton beam energy. The three irradiated samples show a reduction in thermal conductivity when compared to the nonirradiated sample. Surprisingly, the trend shows an increase in thermal conductivity with the increase in proton beam energy. To better understand this trend, we perform SRIM calculations to simulate irradiation conditions of the three different proton beam energies on a silicon target. These simulation results are shown in Fig. 6.
Thermal conductivity of silicon plotted as a function of (a) proton irradiation dose at a constant beam energy of 200 keV and (b) proton beam energy at a constant dose of 1016 cm−2. The data indicate a drastic reduction in thermal conductivity with dose as compared to the nonirradiated sample and an increase in thermal conductivity with ion beam energy.

SRIM calculations that simulate (a) silicon recoil distribution and (b) proton concentration for the 150, 200, and 350 keV proton beam energies to 1016 cm−2 dose plotted as a function of irradiation depth. The vertical line is an estimate to the thermal penetration depth in the TDTR measurement carried at 12.2 MHz modulation frequency. The figure shows that as we increase the ion beam energy, damage is pushed further from the silicon surface and as a result reduces the defect densities within the area sampled by the TDTR measurement.

Figure 6(a) shows the silicon recoil distribution as a function of irradiation depth for the 150, 200, and 350 keV proton energies. The plot represents the concentration of all silicon atoms that were knocked-out of their lattice sites creating vacancies. Similarly, Fig. 6(b) shows proton concentrations for the same beam energies plotted versus the irradiation depth. The two plots illustrate the depth dependence of the induced damage inside silicon. It is clear that this damage is mainly concentrated at the ions' projected range where the straggle was formed. As we increase the ion beam energy, the defected region moves deeper inside silicon leading to a reduced defect concentration in the near surface region. The projected ranges for 150, 200, and 350 keV obtained from SRIM calculations are 1.32, 1.83, and 3.69 µm, respectively. Looking back at our TDTR measurements, we note that the measurements were performed at a modulation frequency of 12.2 MHz. At this modulation frequency, the thermal penetration depth for the three irradiated samples of different ion energies is 1.16–1.3 µm (see Sec. II). Therefore, the damage within the area sampled by TDTR varies significantly with the ion beam energy. As the implantation energy increases, damage moves deeper into silicon and a lower defect density area is sampled by the TDTR measurement. The vertical line shown in Fig. 6 is set to the average thermal penetration depth in the three samples (1.24 µm) and shows the portion of the defected area intercepted by the thermal wave in the TDTR measurement. It is clear that TDTR samples more damage in the case of lower proton-beam energies. This explains the measured increase in thermal conductivity with ion beam energy.
It is worth mentioning that the two sample sets studied here were prepared at different times. The statistical nature of ion irradiation would explain the inconsistency in the percentile reduction in thermal conductivity observed between the two sets, given their relatively similar or identical irradiation conditions. This means that in order to get an accurate measure of the influence of radiation damage on material properties, larger sample sets need to be considered. This more extensive study would require multiple measurements to increase statistical certainty for which TDTR would be a well suited technique, due to the relatively short time associated with collecting TDTR data (2–3 mins for a single measurement).
VI. CONCLUSION AND OUTLOOK
We have illustrated the use of TDTR as a powerful tool to study the evolution of radiation-damage by thermal conductivity measurements for nuclear applications. We presented the first ever reported measurement on the thermal conductivity of optimized ZIRLO. Measurements on silicon subjected to different irradiation conditions showed that TDTR measurements can be used to investigate depth-dependent damage. Copper–niobium multilayers displayed radiation damage tolerance and showed no significant change in thermal conductivity under high irradiation energies and doses.
Over the past few years, copious efforts have been made to reduce the size, cost, and complexity of TDTR apparatuses. The use of fiber optic cables can simplify optics alignment and replace several expensive optics components. Reference Capinski and Maris62 Performing the experiment in the frequency domain, in the configuration known as frequency domain thermoreflectance, allows for the replacement of expensive pulsed lasers with less costly continuous wave lasers and reduces the size of the experiment. Reference Schmidt, Cheaito and Chiesa63,Reference Malen, Baheti, Tong, Zhao, Hudgings and Majumdar64 These recent improvements could aid in the integration of TDTR into nuclear reactors to periodically monitor structural material damage caused by irradiation.
ACKNOWLEDGMENTS
This work was performed in part at the Center for Atomic, Molecular, and Optical Science (CAMOS) at the University of Virginia. P. E. H. recognizes support from the Naval Research Young Investigator Program (Grant No. N00014-13-4-0528). Authors acknowledge Evans Analytical Group for TEM data. We are appreciative of funding through Sandia National Laboratories. Sandia National Laboratories is a multiprogram laboratory managed and operated by Sandia Corporation, a wholly owned subsidiary of Lockheed Martin Corporation, for the U.S. Department of Energy's National Nuclear Security Administration under contract DE-AC04-94AL85000.