Introduction
The ultimate objective of precision viticulture is to increase crop production and profitability through a more optimized use of farm inputs (e.g., pesticides) and, consequently, reducing the environmental impacts associated with conventional field management due to over-application of inputs (Tey and Brindal, Reference Tey and Brindal2012). Associated environmental and economic concerns in different administrative areas have led to the creation of European Policy to regulate a sustainable and rational use of agricultural products and pesticides (European Commission, 2009). Precision viticulture strategies allow farmers to point out the decision making to European Union’s Directives, included in the Common Agricultural Policy.
The use of precision viticulture strategies involves identifying within-field spatial variability and designing site-specific optimal management strategies (Matese et al., Reference Matese, Toscano, Di Gennaro, Genesio, Vaccari, Primicerio, Belli, Zaldei, Bianconi and Gioli2015). One of the most innovative technologies to quantify this variability is the use of Unmanned Aerial Vehicles (UAVs) equipped with sensors. The main advantages of the UAV platforms, in comparison with airborne or satellite missions, are their minor costs and high flexibility in flight scheduling (Torres-Sánchez et al., Reference Torres-Sánchez, López-Granados, Serrano, Arquero and Peña2015a). Moreover, UAVs can automatically fly at low altitudes and with large overlaps, which allows for obtaining high-resolution data and 3-dimensional (3D) models of the crop-field (Hung et al., Reference Hung, Xu and Sukkarieh2014), which is an essential information to full utilization of precision viticulture (Shi et al., Reference Shi, Thomasson, Murray, Pugh and Rooney2016).
Cover crops are a common practice used as a management tool in vineyards under irrigated conditions in Spain. Cover crops slow erosion, improve soil, smother weeds, enhance nutrient and moisture availability, help control many pests and bring a host of other benefits to the farm, such as reducing the need for herbicides and other pesticides and helping safeguard personal health (Clark, Reference Clark2012). In addition, cover crops can support the optimal growth of grapevine and the desired yield quantity and quality (Ripochi et al., Reference Ripochi, Metay, Celette and Gary2011). However, weed population in the cover crops has been increased by the quick natural spread of C. dactylon (bermudagrass) (Valencia et al., Reference Valencia, Civit, Esteve and Recasens2015). C. dactylon is a perennial, creeping by means of stolons and rhizomes, very competitive grass, tolerant of reap, and widely adapted to soils and climate (FAO, 2016). Moreover, as it is a summer perennial grass, it could compete for soil resources with vineyard, and especially for water due to the fact that the Mediterranean climate is characterized by severe droughts in summer (Ripochi et al., Reference Ripochi, Metay, Celette and Gary2011). Although C. dactylon can be controlled by glyphosate, the herbicide application timing is crucial, as it must be done when bermudagrass is totally dormant and the crop is not affected. Thus, the eradication of this weed is difficult and it has become a serious problem in cultivated land (FAO, 2016).
At the effective herbicide application time, the cover crop is at early vegetative stage, and the bare soil and C. dactylon have similar RGB response. This spectral similarity is a limitation in the application of conventional pixel-based image analysis methods, which can be solved by using object-based image analysis (OBIA) (Blaschke, Reference Blaschke2010). OBIA is a powerful methodology that combines spectral, contextual and topological information in the classification algorithm, reporting much better results in spectral similarities scenarios (Peña et al., Reference Peña, Torres-Sánchez, de Castro, Kelly and López-Granados2013).
The main objective of the present study was to develop an innovative OBIA procedure for the automatic and accurate mapping of C. dactylon patches in vineyards with inter-row cover crops by using UAV imagery. These infestation maps may be used to propose precision viticulture strategies that achieving a reduction in the use of weed control products.
Materials and methods
Study area and image acquisition
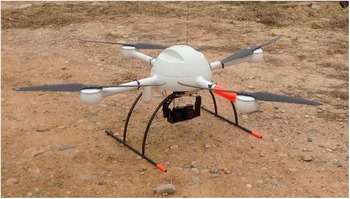
The investigation was carried out in a commercial vineyard (Pinot Noir) located in Raimat, (Lleida, Northeastern Spain). The vines were irrigated and trellis-trained with rows separated by 3 m and vine spacing of 2 m, and inter-row cover crop naturally infested by C. dactylon. Cover crops were mainly composed by grass species (e.g. Festuca spp.). The aerial images were taken in February 2016 with a quadrocopter UAV platform with vertical take-off and landing, model MD4-1000 (Microdrones GmbH, Siegen, Germany) (Figure 1), equipped with a commercial point-and-shoot camera, model Olympus PEN E-PM1 (Olympus Corporation, Tokyo, Japan). This low-cost camera takes red-green-blue (RGB) images of 12-megapixel spatial resolution and 8-bit radiometric resolution. The UAV was programmed to fly at 30 m altitude and take the images with a 60% side-lap and a 93% forward-lap, leading to a spatial resolution of 1 cm/pixel.
The UAV used in this investigation.

Image mosaicking and generation of the Digital Surface Model (DSM)
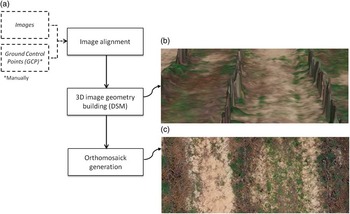
This process consisted of three steps in order to obtain a unique image composition covering the whole field (Figure 2). Agisoft Photoscan Professional Edition (Agisoft LLC, St. Petersburg, Russia) software was employed to automatically generate the mosaicked image; only the localization of 5 ground control points taken with a GPS for georeferencing the DSM and orthomosaic was a manual procedure. Thereby, the software firstly searched for common points in the images and matched them to align the sequence of images collected in the continued flight. Then, the software built the 3D image geometry (named Digital Surface Model) based on the estimated camera positions and images themselves that represented the overflown area and the geometry of the tree crown. And finally, the individual images were projected over the DSM to generate the orthophoto. The final product was the orthomosaicked image covering the entire field where every pixel corresponded to individual RGB spectral information and X,Y,Z coordinates.
a) The flowchart for the automatic orthomosaicking procedure, b) detail of DSM for the vineyard, c) detail of Orthomosaic image for the vineyard.

Object-based image analysis
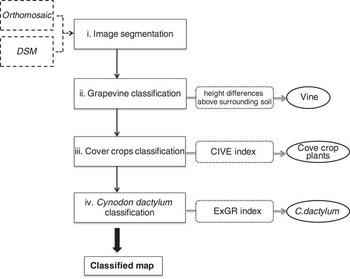
A customized and robust OBIA algorithm was developed to obtain a four-class map (i.e., vine, cover crop, C. dactylon, bare soil). The procedure consisted of four steps, as following:
-
I. Image segmentation: the orthomosaic image was segmented for object generation (chessboard segmentation), mainly using both spectral and spatial information.
-
II. Grapevine classification: grapevine objects were detected based on DSM by comparing height differences above surrounding soil. As images were taken after the pruning, the vine average height was used as threshold for vine classification.
-
III. Cover crops classification: at the time images were taken, cover crops were at early vegetative stage and presented a green color. On the other hand, C. dactylon patches infested the cover crops and were at dormancy stage showing a similar spectral response to bare soil. Discrimination of cover crop class was based on spectral information that was used to calculate an efficient green vegetation index: Color index of vegetation (CIVE, Eq. 1) (Kataoka et al., Reference Kataoka, Kaneko, Okamoto and Hata2003). The determination of the optimum CIVE value for cover crops discrimination in the UAV images was conducted by an automatic and iterative threshold approach following the Otsu method (Otsu, Reference Otsu1979) implemented in eCognition according to Torres-Sánchez et al. (Reference Torres-Sánchez, López-Granados and Peña2015b).
(1) $$CIVE=0.441R{\minus}0.881G{\plus}0.385 B{\plus}18.78745$$
-
IV. Cynodon dactylon classification: once the vegetation vine and cover crop were classified, the remains objects of the image, which corresponded to C. dactylon and bare soil objects, were classified by using the vegetation index Excess Green minus Excess Red (ExGR, Eq. 2) (Neto, Reference Neto2004). The optimum threshold to separate both classes was automatically obtained using the Otsu method.

 $$ExGR=\left( {2G{\minus}R{\minus}B} \right){\minus}1.4G{\minus}B$$
Both vegetation indices, CIVE and ExGR, were selected based on previous spectral analyses to achieve the best separation between green and dry vegetation, and between C. dactylon and bare soil, respectively. The OBIA procedure was developed with the eCognition Developer 9 software (Trimble GeoSpatial, Munich, Germany), it is completely automatic, so it does not need any user intervention (Figure 3).
The OBIA-based flowchart for monitoring vines, cover crops, C. dactylon patches and bare soil.

Evaluation of OBIA Algorithm Performance
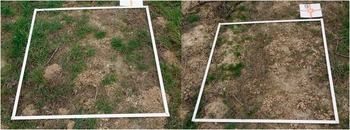
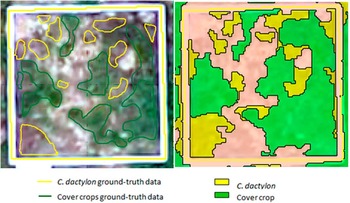
The performance of the OBIA algorithm was evaluated by comparing the results obtained in the classified map with real data observed in 24 georreferenced ground-truth 1×1-m2 sampling frames located in the field (Figure 4). The sampling frames were distributed in the study area in order to represent the weed infestation observed in the field. On-ground pictures of the sampling frames were used to identify C. dactylon and cover crop plants. Thus, weed experts carried out visual classification of the ground-truth data and, next, OBIA procedure was validated by quantifying the number of correct classified frames compared with the observed data, i.e., those sampling frames in which all the weed plants were correctly attributed to weed objects.
Example of some sampling frames distributed along the field.

Results and discussion
The OBIA algorithm identified correctly every individual grapevine in the image, demonstrating the efficiency of the DSM as part of the OBIA algorithm. Cover crops were accurately recognized and classified in the sampling frames (Figure 5), which was possible because of the segmentation process can create objects as small as cover crop plant size. Thereby, the very high spatial resolution of UAV imagery was a crucial issue to detect the cover crops at very early vegetative stage. On the other hand, Otsu method correctly achieved the optimum threshold to classify cover crops inter-vine rows, thus allowed the automation of the OBIA algorithm. The two previous steps of vegetation classification (vine and cover-crop) have strong implications for the success of the next one in the OBIA procedure, since they minimize potential errors in detecting vegetation weed objects (C. dactylon).
a) Ground-truth data for one sampling frame; b) Classified map for the sampling frame.

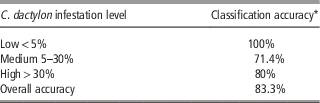
C. dactylon coverage was determined as the percentage of pixels classified as weed per unit of ground surface according to three infestation levels: low <5%, medium (5%–30%), high >30%. The number of classes and threshold are user-configurable. Results obtained in classified map for C. dactylon are show in Table 1.
Accuracy assessment for the classified map.

Accuracy assessments varied according to the weed coverage. Accuracy obtained for low and high infestation levels were better than those achieved for medium level, with correct classification percentages ranging from 80% to 100%. The lower results obtained for medium weed coverage could be due to the fact that bermudagrass formed brighter/clearer and less dense patches in those frames, mixing its reflectance response with the bare soil one and making the C. dactylon detection more complicated. The use of textural features in OBIA algorithm may be an accurate solution for this drawback, as this technology has been proven to be an appropriate tool for vegetation composition and structure (Wood et al., Reference Wood, Pidgeon, Rade loff and Keuler2012).
Alternatively, the errors observed in the classification map were mainly due to false positive, which means weed coverage was overestimated in most of the cases. Although that error must be corrected by using textural parameters, it could be more acceptable to the farmers because they usually prefer a conservative option and avoid leaving weed patches untreated (Peña et al., Reference Peña, Torres-Sánchez, Serrano-Pérez, de Castro and López-Granados2015).
The challenge of this work consisted of detecting weed patches in the cover crop in a specific moment where the herbicide application treatment is allowed and effective. At that phenological moment, specifications of high spatial resolution and innovative image analysis technology are required. The result of this research documented the efficiency and robustness of the OBIA procedure based on UAV imagery for weed classification in cover crops, and indicated the necessity to include textural parameters to achieve higher classification map accuracy. Moreover, the output of this OBIA technology offers useful information related to three-dimensional (3D) structure of vine as area, height and volume of every grapevine as well as row gaps. The results obtained in this paper would contribute to design site-specific management map that would allow use efficient herbicide doses at effective date, and thereby, adjust vineyards to the demands of the current regulatory framework.
Conclusions
The use of OBIA technology based on UAV imagery allowed the automatic classification and mapping of vine, cover crop and weeds in vineyards. This map would allow designing site-specific management strategy of the vineyard, e.g. mowing activities for cover crops and site-specific treatment for weeds. Taking into account the treatment map is developed at the efficient application time, the C. dactylon map would become in a reliable and effective control, which leads to decrease economical and environmental costs.
Acknowledgements
This research was partly financed by the AGL2014-52465-C4-4R project (Spanish Ministry of Economy and Competition, FEDER Funds). Research of Dr. de Castro, Dr. Peña and Dr. Torres-Sánchez were financed by the Juan de la Cierva, Ramón y Cajal and FPI (MINECO), Programs, respectively. The authors thank RAIMAT S.A for allowing developing field-work in the Raimat farm, and Dr. Jordi Recasens and Francisco Valencia (both from University of Lleida) for their valuable assistance during the field work and weed identification.