Introduction
There are approximately 900,000 full-time, part-time, and volunteer emergency medical services (EMS) personnel in the United States who treat 22 million patientsReference Maguire and Walz1 and bring approximately 18 million patients to hospital emergency departments each year.Reference Pitts, Niska, Xu and Burt2 The US Department of Labor (DOL) Bureau of Labor Statistics estimates that there were 201,000 paid EMS workers in 2006.3
Recent reports indicate that both the injury rate and the fatality rate within the EMS occupation are well above the national average for all workers in private industry. A study in 2002 found that the EMS occupational fatality rate during the years 1992 through 1997 averaged 12.7 fatalities per 100,000 workers per year; this rate is comparable to the fatality rates for firefighters and police officers, and is more than twice the national average for all occupational groups.Reference Maguire, Hunting, Smith and Levick4 Subsequent research by the same author found 34.6 non-fatal injuries and illnesses per 100 full-time workers per year from 1998 through 2002; this rate is higher than the rates for police and firefighters and higher than the rates reported for any other occupational group in the United States.Reference Maguire, Hunting, Guidotti and Smith5
Responses to a 1998 survey of nationally registered EMTs revealed an estimated 8.1 injuries and illnesses per 100 EMS providers per year.Reference Studnek, Ferketich and Crawford6 Evaluations of employer data on injuries among EMS workers in Baltimore, Maryland (USA) in 1992 found that 226 occupational injuries occurred among 197 full-time workers in that one year; 41% of the injuries resulted in at least one lost day of work.Reference Gershon, Vlahov, Kelen, Conrad and Murphy7 One study reported that about 30% of EMS respondents were injured in the preceding 12 months.Reference Heick, Young and Peek-Asa8 Other studies have found that the rate of lost work time as a result of injuries was higher for EMS than for fire or police,Reference Suyama, Rittenberger, Patterson and Hostler9 and that sprains and strains were the leading causes of injuries for all emergency services.Reference Reichard and Jackson10 In addition, research indicates that EMS workers suffer from stress as well as injuries resulting from assaults, ambulance crashes, needle sticks, and disaster response.Reference Maguire and Kahn11–Reference Mitchell, Maguire and Guidotti20
The purpose of this study is to examine the characteristics of fatal injuries and determine the rates and relative risks of non-fatal injuries among EMTs and paramedics (hereafter referred to collectively as EMTs) in the US.
Methods
Study Design
This was a retrospective cohort study using pre-existing data collected by the US Department of Labor (DOL), Bureau of Labor Statistics.
Population and Setting
The DOL collects injury and fatality data from across the US and publishes data on occupational injuries, illnesses, and fatalities using information from two programs: (1) the Survey of Occupational Injuries and Illnesses (SOII); and (2) the Census of Fatal Occupational Injuries (CFOI).21 The SOII collects injury and illness data from a random sample of private sector employers. Detailed data, such as occupation, demographic, and case characteristics are collected for injuries and illness requiring one or more days away from work. The CFOI collects and publishes data on every work-related fatality in the United States during a calendar year, using multiple data sources, such as death certificates, Occupational Safety and Health Administration (OSHA) reports, media accounts, and medical examiner reports. Both programs represent cooperative efforts between state offices and the national office. Coding decisions, such as determining which occupation code to use for a particular worker, are initially made by the state office, and were then reviewed by national office employees.
The DOL has been publishing workplace injury information since 1912.22 Early 20th century efforts to collect workplace injury data were limited in scope, either to specific industries or to companies that voluntarily reported data. The Occupational Safety and Health Act of 1970 required employers to maintain injury and illness logs, and the Bureau of Labor Statistics to collect these data. The Survey of Occupational Injuries and Illnesses has been published for each reference year since 1972. Beginning with year 1992, the Bureau of Labor Statistics has published fatality data with the Census of Fatal Occupational Injuries. The DOL began classifying EMTs as a unique occupational group beginning in 2003.
As the SOII is based on a random sample of private-sector employers, the injury and illness estimates may differ from the results obtained of other samples, or from a census of the entire survey frame.
Human Subject Committee Review
This project was reviewed by the Institutional Review Board and received exemption #Y09BM08163 on March 24, 2009. The requirement for informed consent was waived by the Institutional Review Board.
Measurements
The data reviewed included occupational fatalities or injuries with lost work time that occurred from 2003 through 2007 among US workers classified by their employer as EMTs. Rates and relative risks associated with the non-fatal injury cases with lost work days were determined and characteristics of the fatal cases were described.
Sample Size Determinations
Non-fatal cases included EMTs employed in the private sector with injuries resulting in at least one day of lost work time. Fatal cases included private sector and government-employed EMTs.
Analytical Methods
Rates were calculated using standard DOL formulas;23, 24 the standard DOL nomenclature was used.25 Relative risks and 95% confidence intervals of the EMT rates compared to the national average (a comparison of EMT rates to other specific occupational groups is beyond the scope of this paper) were calculated.
Results
During the study period, 21,690 injury and illness cases with lost work days, and 59 fatalities among EMTs were reported. Of the non-fatal cases, 3,710 (17%) resulted in ≥31 days of lost work time. More than 14,000 injures (67%) involved sprains or strains; the back was injured in 9,290 cases (43%); the patient was listed as the source of injury in 7,960 cases (37%). The most common causes of injury or illness were overexertion (56%), falls (10%), transportation (9%), and contact with an object (eg, struck by an object; 8%). A total of 530 assault cases (an average of over 100 per year) were reported.
Of the reported 59 fatalities, 51 (86%) were transportation-related, and five (8%) were due to assaults; 33 (56%) were classified as “multiple traumatic injuries” (multiple injuries such as a “burn and a fracture”).26
Non-fatal Injuries
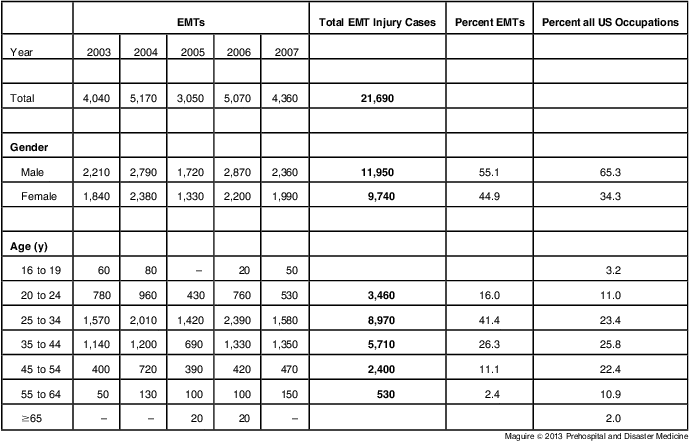
For the years 2003 through 2007, the total of non-fatal occupational injuries ranged from a low of 3,050 in 2005 to a high of 5,170 in 2004. Fifty-five percent of these non-fatal injuries occurred among male EMT workers; 41% occurred among workers who were 25 to 34 years of age. Approximately 50% of the non-fatal injuries resulted in six or more lost work days.
Table 1 describes the number of reported non-fatal occupational injury cases by gender and age group among EMTs for the years 2003 through 2007.
Number and percent of cases for emergency medical technician (EMT) occupational injuries with lost work days from 2003 to 2007 by age group and gender compared to percent of all U.S. cases with lost work days. Dash indicates data do not meet publication guidelines. Data may not sum to totals due to rounding and the exclusion of data that do not meet publication guidelines. The US Department of Labor rounds findings to the nearest ten.

The incidence rates of non-fatal occupational injuries among EMTs were available from the DOL for 2006 and 2007 only. In 2007, there were 349.9 cases of EMTs losing one or more day of work per 10,000 full-time employees, compared to an average of 122.2 for all private industry occupations (RR = 2.9; 95% CI, 2.7-3.0). A full-time employee was defined as working 2,000 hours per year (ie, 40 hours a week for 50 weeks). In 2006, the incidence rate of injury was 453.8, which is 3.6 times the 2006 average rate of 127.8 (95% CI, 3.4-3.7). Table 2 lists the incidence rate per 10,000 full-time EMT workers per year compared to the rate among all private industry employees in 2006 and 2007.
Incidence Rates for Injuries with Lost Work Days per 10,000 Full-time Employees for Emergency Medical Technicians (EMTs) and Total US Private Industry Workers, 2006-2007

During the years 2003 through 2007, EMTs suffered a total of 14,470 sprains and strains; there were 12,280 injuries to the trunk (including 9,290 back injuries), and 3,080 lower extremity injuries; vehicles were the source of 2,630 injuries, and health care patients were the source of 7,960 injuries; 12,100 injuries were the result of overexertion (including 8,040 lifting injuries); transportation incidents resulted in 1,940 injuries; and, there were 530 assaults during this period.
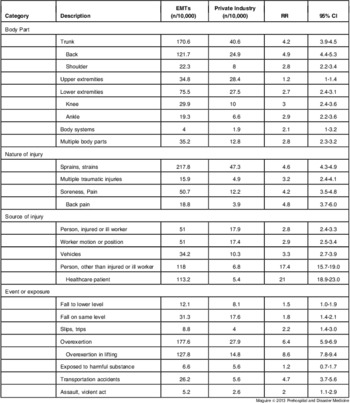
Table 3 displays the injury rates and relative risks per 10,000 full time workers for reported cases with lost work days for EMTs compared with the national average for all private industry in 2007. The table, and the following paragraphs, describes the findings by body part, nature of injury, source and event or exposure.
Injury Rates per 10,000 Full-time Workers for Cases Resulting in Lost Work Days among Emergency Medical Technicians (EMTs) and Private Industry Workers in 2007

Among EMTs, the back was the part of the body most often affected, with 35% of reported injury cases attributed to back injury, and an incidence rate of 121.7 back injuries with lost work days per 10,000 full time workers in 2007. Knee injuries comprised 8% of EMT injury cases with an incidence rate of 29.9 (RR = 3.0; 95% CI, 2.4-3.6), and shoulder injuries accounted for 6% of the injuries with an incidence rate of 22.3 (RR = 2.8; 95% CI, 2.2-3.4). When comparing the injury rates among EMTs to the national average, the incidence of trunk and back injuries was four times greater than the national average, while shoulder, knee, ankle and injuries to multiple body parts each had relative risks of approximately three.
Sprains and strains were the most common injuries leading to days away from work, accounting for 62% of the cases in 2007, and for more than 60% of the cases each year from 2003 through 2007. In 2007, the incidence rate of sprains and strains among EMTs was 217.8 per 10,000 full time workers; this rate is 4.6 times higher than that of the national average (95% CI, 4.3-4.9). Soreness and pain (including back pain) were responsible for 14% of the injury cases among EMTs. The relative risk for cases of soreness and pain is 4.2 (95% CI, 3.5-4.8), while the relative risk for cases of back pain with lost work days is 4.8 (95% CI, 3.7-6.0).
The highest reported rates by source of injury involved persons (person other than injured or ill worker and health care patient), followed by “floor, ground surfaces” and vehicles.
Overexertion was listed as the precipitating event among 305.4 per 10,000 EMT workers (51%). This was followed by falls on same level (390, 9%), transportation accidents (330, 8%), and contact with objects or equipment (330, 8%). Of the overexertion cases, 1,000, or 45%, were due to lifting a health care patient, 480, or 22%, by lifting tools, instruments, or equipment, and another 210, or 10%, from holding or carrying a patient. The relative risk for injuries resulting from “overexertion in lifting” was 8.6 times higher among EMTs than the national average (95% CI, 7.8-9.4). For transportation-related incidents, the relative risk was 4.7 times higher among EMTs than the national average (95% CI, 3.7-5.6); for assaults, the relative risk among EMTs was twice the national average (95% CI, 1.1-2.9).
Fatal Injuries
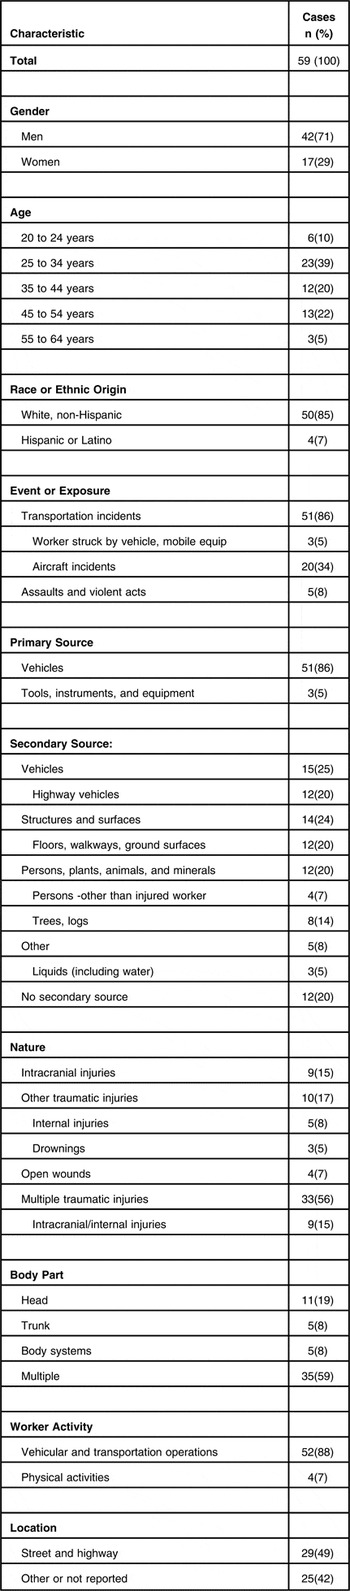
There were 59 fatal work-related injuries among EMTs during the period 2003 to 2007. Of the fatally-injured EMT workers, 42 (71%) were male and 17 (29%) were female; this is similar to gender profile proportion of employment in 2007. Private industry employed 39 (66%) of the fatally-injured workers, while governments employed 20 (34%). Workers age 25-34 years accounted for 39% of the fatally-injured EMTs (n = 23).
A majority (n = 51, 86%) of the fatal injuries occurred as a result of transportation incidents; 23% of the transportation-related fatalities resulted from highway incidents. Aircraft incidents were responsible for 20 (34%) of the fatalities. Five (8%) fatalities were caused by assaults and violent acts. Table 4 lists the number and percent of fatal injuries among EMTs from 2003 through 2007 by various characteristics.
Fatal Occupational Injury Cases among Emergency Medical Technicians Employed in the Public and Private Sector, all United States, 2003-2007

Discussion
Data from the US Department of Labor show that the rate of work-related injuries among EMTs is approximately three times higher than the national average. Similar to Maguire's study that demonstrated that the injury rate among EMS workers is much higher than the national average,Reference Maguire, Hunting, Guidotti and Smith5 sprains and strains are the leading cause by nature of injury, the back is the body part most injured, and overexertion is the leading cause by event. Reichard and Jackson also found that the leading type of EMS occupational injury was sprains and strains.Reference Reichard and Jackson27 Injuries in this study reemphasize other findings noting that the vast majority of fatalities are secondary to transportation-related incidents and that assaults account for a large number of fatal cases.Reference Maguire, Hunting, Smith and Levick4
Although the incidence of injuries was fairly evenly distributed among males and females, it should be noted that female workers only accounted for 27% of employment in this occupation during 2007.28 These findings suggest that female EMTs may have a disproportionately high risk of work-related injuries.
Although no cost data were available for this study, other studies have found that back injuries cost an estimated US $47,938 per incident.29 Applying the findings to the EMS population, the data in this study indicate that the cost to EMS agencies is approximately US $600 per full time equivalent (FTE), per year for back injuries alone.
Among EMTs fatally injured, workers 25-34 years of age accounted for 39% of the fatalities; that age group accounted for just 18% of cases among all US workers.30
The findings from this study support a growing body of literature that indicates EMS workers face a high risk of occupational injury and fatality; the reasons for this high risk remain largely unknown. Future research must determine the causes for these risks before mitigation efforts can be designed, tested, and implemented.
Limitations
A number of factors limit the generalization and value of the findings from this study. All data related to non-fatal cases were limited to EMTs employed by the private sector. Although approximately one-third of respondents to a national EMS agency survey were private employers,Reference Williams31 data available for this study represent less than a quarter of the estimated 900,000 EMS personnel in the US. While the DOL Bureau of Labor Statistics has made great advancements by adding EMTs as a unique occupational group in 2003 and by expanding the survey to government workers in the 2008 release, there are still few data on the volunteer EMS workers who are the vast majority of EMS workers in the US.Reference Maguire and Walz1
A growing number of fire departments are becoming involved in EMS operations.Reference Maguire and Walz1 Injured EMTs working on ambulances but employed by fire departments might be classified in the DOL injury data as firefighters instead of EMTs (but still be counted as EMTs in the employment data); this would result in a lower injury incidence rate among EMTs (as well as a higher rate for firefighters).
Currently there are no methods to measure the specific number of exposures of the injured EMT. For example, there are no data specifying the number of calls a worker responded to, or the number of patient contacts. Nor is it known how many patients the worker transported, or how many of the patients had infectious diseases.
This was a retrospective analysis of data not specifically collected for this study. Survey limitations are described by the Bureau of Labor Statistics, Handbook of Methods. They include the statement that “Estimates from the Survey of Occupational Injuries and Illnesses are based on a scientifically selected probability sample, rather than a census of the entire population.”32
Future Investigation
The findings for this study suggest four major areas for future investigation: (1) transportation incidents—this study has found that transportation incidents account for 86% of all fatalities and result in a rate of non-fatal injuries that is almost five times higher than the national average; (2) assaults—every year, on average, one EMT is killed and more than 100 EMTs suffer injuries causing lost workdays as the result of a violent assault; (3) female workers—the data support prior studies Reference Maguire, Hunting, Guidotti and Smith33 that indicate that female EMTs may have a disproportionately high rate of occupational injuries; and (4) injury incidence rate—the data indicate that EMTs have a rate of occupational injury that is much higher than the national average. Research is needed to examine potential causal factors related to these high rates. Once the preliminary evaluations are done, EMS systems can begin the development, evaluation and promulgation of evidence-based best practices to mitigate these serious problems.
Conclusion
Emergency medical technicians treat 22 million patients a year in the United States. In the process, these workers are exposed to a large number of risks, many of which are unique to their profession. Thus, it is likely that mitigating interventions must be largely unique to the profession. Based on the findings in this study it is also likely that interventions must be age and gender-specific.
This study supports previous studies that have found the EMS injury rate to be well above the national average. Funding is needed for further research so that evidence-based interventions to reduce occupational risks can be developed, implemented, evaluated, and promulgated.
Making the work environment safer for EMTs is one key to attracting and retaining the EMS professionals who are responsible for caring for millions of patients each year.
Acknowledgement
The authors thank Barbara O'Neill for her helpful review of the manuscript.