Implications
The rumen environment is extremely anaerobic and is commonly characterized by fermentative parameters (volatile fatty acid, ammonia N) and pH. Nevertheless, few data are available on ruminal physicochemical parameters that accurately characterize the anaerobic and reducing status of a milieu: the redox potential (Eh) and Clark’s exponent (rH). The present work aimed at studying ruminal Eh and rH with different concentrate to forage ratios on a hay-based diet in order to better understand the biological meaning of these parameters in a milieu such as the rumen.
Introduction
The redox potential (Eh) is a basic physicochemical measurement characterizing any oxidizing or reducing milieu. Some studies showed that it plays an important role in many biological media such as milk-based products (Brasca et al., Reference Brasca, Morandi, Lodi and Tamburini2007), wine (Tomlinson and Kilmartin, Reference Tomlinson and Kilmartin1997) and the rumen (Marounek et al., Reference Marounek, Bartos and Kalachnyuk1982; Marden et al., Reference Marden, Julien, Monteils, Auclair, Moncoulon and Bayourthe2008), where Eh is a major factor determining the type of microorganisms that will grow in the milieu (Brasca et al., Reference Brasca, Morandi, Lodi and Tamburini2007). Because of the continuous fermentative processes in the rumen involving different simultaneous chemical reactions, it seems interesting to focus on Eh in such a reducing environment. Rigorously, Eh applies to systems that are reversible and have reached equilibrium, but when the solution (or milieu) contains a variety of charge carriers, Eh deals with a steady-state ‘mixed potential’ (Tomlinson and Kilmartin, Reference Tomlinson and Kilmartin1997). According to the first Eh measurements made by Broberg (Reference Broberg1958) in sheep ruminal contents, the values ranged between – 140 and – 260 mV. In normal conditions, the ruminal milieu is anaerobic with an Eh markedly negative, reflecting a strong reducing power in the absence of oxygen (Marden et al., Reference Marden, Bayourthe, Enjalbert and Moncoulon2005). Indeed, a milieu with a low negative Eh is more favorable to the development of strictly and facultative anaerobic bacteria than of aerobic bacteria (Beresford et al., Reference Beresford, Fitzsimons, Brennan and Cogan2001). More recently, Marden et al. (Reference Marden, Bayourthe, Enjalbert and Moncoulon2005 and Reference Marden, Julien, Monteils, Auclair, Moncoulon and Bayourthe2008) showed that the rumen contents of dry and lactating dairy cows have an Eh that can vary from – 217 to – 115 mV. If the level of dry matter intake (DMI) could partly explain the variation between these values, then the type of diet fed could also influence Eh. To our knowledge, there is little information available on dairy cows on Eh changes with different contrasting types of diet, apart from the investigations of Barry et al. (Reference Barry, Thompson and Armstrong1977) in sheep and Marounek et al. (Reference Marounek, Bartos and Kalachnyuk1982), Broudiscou et al. (Reference Broudiscou, Albarello, Broudiscou and Sauvant2006) and Giger-Reverdin et al. (Reference Giger-Reverdin, Duvaux-Ponter, Rigalma and Sauvant2006) in goats. These authors, with both in vivo and in vitro experimental designs, showed that ruminal Eh tended to be 45 to 100 mV lower in animals fed a hay diet (70% to 100% of forage) than in those fed a concentrate diet (40% to 80% of concentrate). As shown previously by Martin et al. (Reference Martin, Fonty and Michalet-Doreau2002), the equilibrium between endogenous anaerobic microbial populations (amylolytic, cellulolytic and methanogens) and their activities are known to be directly influenced by the diet. Anaerobic microbial metabolism can be expressed either by Eh or more precisely by Clark’s exponent (rH). It integrates both the pH and Eh measurements (Marounek et al., Reference Marounek, Roubal and Bartos1987). Therefore, it seemed important to study the relationship between the reducing characteristics of rumen environment and different feeding strategies. This study aimed at characterizing the dynamics of physicochemical and fermentative parameters together with the fingerprints of bacterial communities with a decreasing forage-to-concentrate ratio in hay-based diets in order to account for the link between diet and reducing capacity of ruminal milieu in dry dairy cows.
Material and methods
Animal, housing and feeding
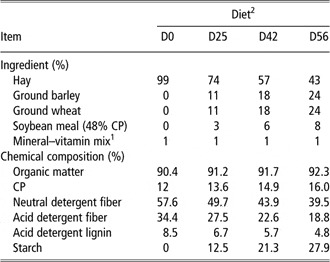
Four ruminally cannulated non-lactating Holstein cows were used in a 4 × 4 Latin square design. Cannulation techniques provided for humane treatment of cows, adhering to locally approved procedures, and were similar to those described by Streeter et al. (Reference Streeter, Wagner, Hibberd and Owens1990). Animals were housed in individual tie stalls throughout the experiment with free access to water. Each cow received a limited amount of diet (8 kg DM/day) based on hay as forage and ground barley, ground wheat, soybean meal and minerals/vitamins as concentrates. Diets were formulated to meet energy and protein requirements, with two equal distributions at 0900 and 1700 h. Four treatment diets were defined according to their forage/concentrate ratio (wt/wt): 100 : 0 (D0), 75 : 25 (D25), 58 : 42 (D42) and 44 : 56 (D56). The ingredients and chemical composition of the four experimental diets are shown in Table 1. Concentrates were top-dressed on hay and consumed within 15 min, whereas the hay was consumed almost completely 1 h after feeding. One experimental period covered 24 days with a 21-day adaptation period to the different treatment diets and a 3-day sampling and measurement period. A dietary transition of 3 days was managed at the beginning of each experimental period for a better adaptation of the animals to the new diets.
Ingredients and chemical composition of the diets characterized by different forage-to-concentrate ratio (DM basis)

DM = dry matter.
1Contained (per kg of premix, DM basis): 40 g of P, 260 g of Ca, 50 g of Mg, 20 g of Na, 5 g of Zn, 4 g of Mn, 40 mg of I, 20 mg of Co, 20 mg of Se, 1 g of Cu, 450 000 IU of vitamin A, 100 000 IU of vitamin D3, 1500 IU of vitamin E.
2Forage-to-concentrate ratio: D0 = 100 : 0; D25 = 75 : 25; D42 = 58 : 42; D56 = 44 : 56.
Sampling and measurements
A method adapted from Marden et al. (Reference Marden, Bayourthe, Enjalbert and Moncoulon2005) was used for an easier sampling of ruminal fluid. Instead of having one lead ring-shaped filter, two removable inox filters and weights were integrated into the former system. It allowed simultaneous ruminal liquid sampling together with the continuous measurement of physicochemical parameters. For each cow, ruminal pH and Eh were recorded hourly over a 9-h period from 1 h before to 8 h after the morning meal (T −1 to T +8).
Eh measures the ability of a solution to accept or donate electrons and corresponds to the potential difference (mV) between a platinum electrode and a standard hydrogen electrode. Since an Ag-AgCl reference electrode was used (Metrohm, Herisau, Switzerland), all measured values were corrected through the formula: Eh = E0 + C, where E0 is the potential of the platinum electrode and C is the potential of the Ag-AgCl reference electrode compared with the standard hydrogen electrode, that is, +199 mV at 39°C. Eh yields only a rough indicator of the reducing power in a given milieu because it is highly dependent upon the effects of pH. To give a better appreciation of absolute reducing power, rH is calculated by integrating both pH and Eh values in Nernst’s equation (Marounek et al., Reference Marounek, Roubal and Bartos1987).
For each treatment, two 10-ml ruminal fluid samples were sucked out of the rumen and sampled at T 0, T +1, T +2, T +4, T +6 and T +8. One sample was preserved by the addition of 1 ml of HgCl2 (2% wt/vol) for subsequent volatile fatty acid (VFA) determination, and the other by three drops of H2SO4 (96%) for ammonia N (NH3-N) determination. Both were frozen at −18°C. The concentrations of VFA were determined using the gas chromatographic method of Playne (Reference Playne1985), modified by Marden et al. (Reference Marden, Julien, Monteils, Auclair, Moncoulon and Bayourthe2008). The concentrations of NH3-N were determined by colorimetry with Nessler’s reagent using the method adapted by Hach et al. (Reference Hach, Brayton and Kopelove1985 and Reference Hach, Bowden and Kopelove1987) on the separated liquid phase of ruminal samples centrifuged at 4000 × g for 20 min.
On day 24 of each experimental period, a sample of 1 ml of ruminal fluid was obtained at T +4 and frozen at −80°C for subsequent analysis based on molecular biology techniques. Total DNA from about 0.2 g of template was extracted with the QIAamp® DNA Stool Mini kit (Qiagem S. A., Courtaboeuf, France). The V3 region of 16S rRNA bacterial genes was amplified by PCR using the primers w49 and 5′-6FAM-labelled w34 (Delbès et al., Reference Delbès, Godon and Moletta1998; Zumstein et al., Reference Zumstein, Moletta and Godon2000). Amplicons were subjected to capillary electrophoresis single-strand conformation polymorphism (CE-SSCP) as described by Michelland et al. (Reference Michelland, Monteils, Zened, Combes, Cauquil, Gidenne, Hamelin and Fortun-Lamothe2009a). The CE-SSCP profiles were aligned and normalized and, Shannon diversity index and richness were estimated using the StatFingerprints program version 1.3 (Michelland et al., Reference Michelland, Dejean, Combes, Lamothe and Cauquil2009b) running on R version 2.7.2 (R Development Core Team, 2009).
Statistical analysis
For all diets, the mean and minimum (Min) values of pH, Eh and rH over the 9-h measuring period and at feeding time (T 0) and average values of fermentative parameters over daily samples were analyzed by ANOVA for Latin square design by means of GLM of SPSS (SPSS version 13.0 for Windows, SPSS Inc., Chicago, IL, USA). The model used was:

where Yijk is the dependent variable, μ, the overall experimental mean, Ci, the mean of the effect of cow, Trtj, the mean effect of treatment, Pk, the mean effect of period and eijk the random residual.
For each diet, pH and Eh values at each sampling time were compared by ANOVA for Latin square design by means of GLM of SPSS. The model used was:

where Tj, is the time of sampling effect. In addition, treatment and sampling time differences were assessed by Tukey’s pairwise comparisons. Differences were considered significant at P < 0.05 and trends were discussed at P < 0.10.
All statistical analyses concerning microbiota study were carried out using the StatFingerprints Package (Michelland et al., Reference Michelland, Dejean, Combes, Lamothe and Cauquil2009b) with R (2.7.2 version). Pairwise Euclidean distances between the 16 CE-SSCP profiles were calculated to study the structure of the bacterial communities. Global ANOSIM was performed to test the effect of diet. The ANOSIM-R value indicated the extent to which the groups differed (R > 0.75: well-separated groups; 0.50 < R < 0.75: separated but overlapping groups; 0.25 < R < 0.50: separated but strongly overlapping groups; 0.25 < R: barely separated groups; Ramette Reference Ramette2007). The ANOSIM-R value must be associated with a P-value <0.05 to be interpreted. Relationships between the ruminal Shannon diversity index and richness, and environmental variables (pH, Eh, rH and total VFA) were studied using a simple Pearson correlation. Relationships between ruminal bacterial community structure and environmental variables were studied using the multivariate 50/50 F-test followed by a rotation test to assess significance.
Results and discussion
In the field of quality and environmental controls, rH has already been accepted as a means of assessing the reducing power (Antonini et al., Reference Antonini, Falciola, Mussini and Mussini2001). The rH scale ranges from 0 to 42: 0, being the lowest value indicating maximum reducing power while a value of 42 would indicate the maximum oxidizing power of a particular environment. A 1-U shift in rH indicates a 10-fold increase in reducing power. In the rumen, rH has been rarely investigated. Only a few authors (Broberg, Reference Broberg1958; Marounek et al., Reference Marounek, Bartos and Kalachnyuk1982; Marden et al., Reference Marden, Julien, Monteils, Auclair, Moncoulon and Bayourthe2008) have used the rH index to describe this fermentation milieu. The obtained rH values corresponded to data published by Marounek et al. (Reference Marounek, Bartos and Kalachnyuk1982) for goats and Marden et al. (Reference Marden, Julien, Monteils, Auclair, Moncoulon and Bayourthe2008) for lactating dairy cattle, which ranged from 6.3 to 8.6 and from 7.3 to 8.0, respectively. If the calculated rH values confirmed the reducing conditions of ruminal environment, the differences observed could be the result of differences in diet composition, which are known to influence the course of ruminal fermentation.
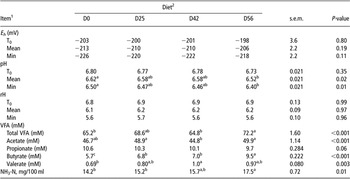
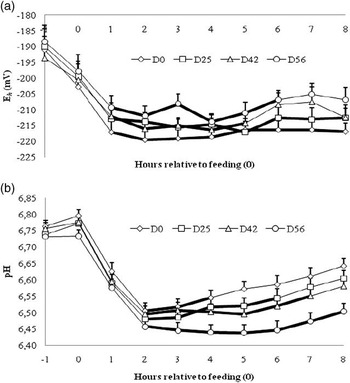
In this study, the average Eh and rH of the rumen fluid of dairy cows fed 8 kg DM/day of a hay-based diet containing 0% to 56% of concentrates ranged between −213 and −206 mV and between 6.12 and 6.17, respectively (Table 2). These values confirmed that the ruminal milieu is an extremely reducing environment, as reported by Marounek et al. (Reference Marounek, Bartos and Kalachnyuk1982) that is devoid of oxygen. Results were also in agreement with the mean Eh level of −206 mV established by Marden et al. (Reference Marden, Bayourthe, Enjalbert and Moncoulon2005) in dry dairy cows fed a similar 8 kg DM diet. When increasing the DMI level to 28 kg DM per cow per day to satisfy the maintenance and lactating requirements, Marden et al. (Reference Marden, Julien, Monteils, Auclair, Moncoulon and Bayourthe2008) observed a higher mean Eh (−115 mV) and a higher mean rH (8.05). The discrepancies of Eh and rH values between trials may be dependent on (i) the level of DMI, that is, the higher the feed intake, the less reducing the ruminal Eh is; (ii) the nature of forage used in each study – hay or corn silage; and (iii) the proportion and the nature of concentrates – slowly or rapidly fermentable carbohydrates. Post-feeding variations in Eh of rumen fluid (Figure 1a) were similar for all diets, with the less reducing conditions being recorded before feeding and the most reducing state being reached 1 h after feeding. These observations confirmed those of Barry et al. (Reference Barry, Thompson and Armstrong1977) in sheep and of Marden et al. (Reference Marden, Julien, Monteils, Auclair, Moncoulon and Bayourthe2008) in dairy cows. In this study, Eh Mean was similar among diets, whereas there was a numerically higher Eh Min value for D56 than D0. Furthermore, the time during which Eh remained at Eh Min varied. For D0 and D25, Eh remained at Min value during 7 h post-feeding, whereas for D42 and D56, it remained at an Min value during 4 or 5 h post-feeding, and then increased significantly until the subsequent meal. The present results corroborated those obtained by other studies in sheep (Barry et al., Reference Barry, Thompson and Armstrong1977; Marounek et al., Reference Marounek, Bartos and Kalachnyuk1982) and goats (Broudiscou et al., Reference Broudiscou, Albarello, Broudiscou and Sauvant2006; Giger-Reverdin et al., Reference Giger-Reverdin, Duvaux-Ponter, Rigalma and Sauvant2006); they showed that ruminal milieu tended to be less reducing in animals fed a concentrate diet (40% to 80% of concentrates) than in those fed a hay diet (70% to 100% of forage). These were also consistent with Marden et al. (Reference Marden, Julien, Monteils, Auclair, Moncoulon and Bayourthe2008) who observed a mean ruminal Eh of −115 mV in high-producing dairy cows suffering from subacute ruminal acidosis (SARA). This high value was likely linked with the concentrate level in the diet and seemed to behave as a possible physicochemical indicator of digestive problems such as SARA to complement ruminal pH.
Effect of diet characterized by different forage-to-concentrate ratio on ruminal Eh, pH, rH and fermentative parameters

a,b,cMeans in rows with unlike superscript differ (P < 0.05).
1Eh = redox potential; rH = Clark’s exponent; mean and minimum values of Eh, pH and rH over the 9-h measuring period and at feeding time (T0); VFA = volatile fatty acid; NH3-N = ammonia nitrogen.
2Forage-to-concentrate ratio: D0 = 100 : 0; D25 = 75 : 25; D42 = 58 : 42; D56 = 44 : 56.
Effect of diets, characterized by different forage-to-concentrate ratio (D0 = 100 : 0; D25 = 75 : 25; D42 = 58 : 42; D56 = 44 : 56), on the evolution of ruminal Eh (a) and pH (b); bold line means that values did not differ from minimum value, P < 0.05. Vertical bars show s.e.

In this study, values of pH recorded in dry dairy cows with the four experimental diets clearly denied any induced digestive disorder such as SARA or latent acidosis as described by Oetzel (Reference Oetzel2000) and Sauvant et al. (Reference Sauvant, Giger-Reverdin and Meschy2006), respectively. The average pH values remained high because of low DMI on hay-based diets. The pH curves (Figure 1b) among diets showed a similar pattern with the highest value around feeding followed by a drastic fall within 2-h post-feeding. Mean pH values (Table 2) were 6.62 and 6.52 for D0 and D56, respectively, and were consistent with an increasing supply of concentrates. Although measured pH values at T 0 were not different between diets, nadir values differed significantly between D0 and D56, 6.50 v. 6.40, respectively. From a physiological point of view, it is assumed that this discrepancy of 0.10 U within a pH range above 6 will not lead to ruminal disorder (Yang and Beauchemin, Reference Yang and Beauchemin2007). After 2-h post-feeding, when higher proportions of concentrates were present in the diet, pH remained at the nadir value for a longer time: 6 h for D56, 4 to 5 h for D25 and D42 and 2 h for D0.
With D0, the lowest reducing Eh value was observed when pH was highest. In contrast, with D56, the higher Eh was recorded when pH was lowest. It seemed that ruminal Eh moved toward higher Eh values when pH dropped. These results agreed with those of Broberg (Reference Broberg1958) who showed a similar shift toward higher Eh values when the percentage of concentrates increased in the diet. Furthermore, Marounek et al. (Reference Marounek, Bartos and Kalachnyuk1982) confirmed this trend showing that a shift toward less reducing values occurred after acidification of the milieu. Even if some authors had established a negative linear relationship between the pH and Eh of rumen fluid in small ruminants (Marounek et al., Reference Marounek, Bartos and Kalachnyuk1982; Giger-Reverdin et al., Reference Giger-Reverdin, Duvaux-Ponter, Rigalma and Sauvant2006), in this study, the relationship was not obvious (R 2 = 0.005, P > 0.05). Like in soil science, Bohn (Reference Bohn1969) reported a nonlinear pH/Eh relationship when high quantities of fermentative organic matter were provided.
Fermentation parameters such as ruminal NH3-N concentrations (Table 2) increased (P = 0.01) from 14.2 mg/100 ml with D0 to 17.5 mg/100 ml with D56. The total VFA content (Table 2) was greater with D56 (72.2 mM) than with D0 (65.2 mM) and led to ruminal acidification. It could be assumed that changes in VFA in the two extreme diets were associated with different rates of metabolic processes. High total VFA content, low pH and Eh with a less reducing value reflected a higher metabolic activity of the rumen fluid in cows fed hay with 56% of concentrates.
Concerning the structure of rumen bacterial community, the global analysis of the CE-SSCP profiles showed no significant difference among diets (ANOSIM P = 0.94). The Shannon diversity index and richness averaged 0.7 ± 0.11 and 18.8 ± 5.11, respectively, over treatments. When correlating CE-SSCP profiles to ruminal parameters (Table 3), neither the Shannon diversity index nor richness differed between treatments. They were not correlated with ruminal parameters as pH, Eh, rH and total VFA used as significant descriptors of ruminal conditions. Results of fingerprint structures, the Shannon diversity index and richness revealed close bacterial communities in the rumen of dairy cows fed the four experimental hay-based diets. However, like other biomolecular techniques, CE-SSCP presents some advantages and drawbacks. As a matter of fact, the migration of amplicons within the CE-SSCP capillary has been shown to be highly reproducible, but co-migration may occur (Zinger et al., Reference Zinger, Gury, Giraud, Krivobok, Gielly and Taberlet2007). Consequently, the CE-SSCP may prevent the measurement of quantitative changes of bacterial communities and may underestimate the microbial diversity, but it remains useful to determine bacterial fingerprint profiles as a first qualitative approach.
Correlations between Shannon diversity index, richness or capillary electrophoresis single-strand conformation polymorphism (CE-SSCP) profiles and ruminal parameters

Eh = redox potential; rH = Clark’s exponent; mean values of pH, Eh and rH over the 9-h measuring period; Total VFA = total volatile fatty acid.
1Michelland et al. (Reference Michelland, Dejean, Combes, Lamothe and Cauquil2009b).
Microbial cell metabolism in the rumen is thermodynamically driven by different mixed oxidation-reduction systems (Ungerfeld and Kohn, Reference Ungerfeld and Kohn2006). It follows that there is a link between Eh and bacterial metabolism as already observed in other biological milieu in which different types of microbes are involved, for example, in wine maturation (Tomlinson and Kilmartin, Reference Tomlinson and Kilmartin1997) and in milk-fermented products (Bolduc et al., Reference Bolduc, Bazinet, Lessard, Chapuzet and Vuillemard2006). Eh appears to be as influential as pH on bacterial activities and is a major factor in determining the bacterial community that will grow as recently stated by Brasca et al. (Reference Brasca, Morandi, Lodi and Tamburini2007) and Jeanson et al. (Reference Jeanson, Hilgert, Coquillard, Seukpanya, Faiveley, Neveu, Abraham, Georgescu, Fourcassié and Beuvier2009) in dairy products.
Conclusion
In this study, average rH, Eh and ruminal microbiota structure remained constant over treatments. Besides, variations in VFA ruminal contents and pH reflected fermentative activities. The clear-cut relationship observed by Baldwin and Emery (Reference Baldwin and Emery1960) between the metabolic rate of rumen microorganisms and Eh was not obvious in this study, because the Eh values were not affected in a clear way by treatments. Further studies are needed with more discriminated diets to clarify this relationship.
Acknowledgements
We thank the farm crew at the Borret Dairy Farm (Poucharramet, F-31070) for their technical assistance.