





1. Introduction
A decade-long episode of persistently below-target inflation at the effective-lower bound (ELB) followed by the steep and broad-based rise in inflation in the aftermath of the COVID-19 pandemic have called forth a rethinking of central bank (CB) policies. Major CBs have emphasized a shift from standard inflation-targeting (IT) regimes to a form of history-dependent policy – such as price-level targeting (PLT).Footnote 1 Under PLT, nominal rates are adjusted so that the price level gravitates around the path consistent with a low inflation target while standard IT is only concerned with keeping current inflation around this target.
The academic literature on the relative stabilizing benefits of PLT over IT, which we summarize hereafter, is however limited and discrepant. This paper reconciles these contradictory results by combining a lab experiment with a model-based analysis. We provide the first causal evidence that simple forward-looking CB communication makes a striking difference: it helps subjects grasp the history dependence in the policy rule which allows the stabilizing properties of PLT to materialize. We show how a parsimonious heterogeneous expectation New Keynesian (HENK) model with communication replicates our experimental data remarkably well.
Agents’ expectations are the primary channel through which monetary policy affects inflation and output because these expectations directly influence current decisions. However, gauging policy-dependent expectations in survey data is difficult, and field experiments in macroeconomic settings are impractical. The laboratory can fill this data gap by providing a controlled environment to gain insights into the expectation channel under different monetary policy regimes. The expectation channel is especially critical under history-dependent monetary policies since future inflation is supposed to offset past deviations from the target. In this respect, the theoretical merits of PLT over IT have been established under the standard FIRE (full information rational expectations) assumption, which presumes that the private sector understands the implications of history-dependence and align their expectations with the PLT policy rule (see Section 2).
To give an example, during an episode of above-target inflation, if consumers understand the history-dependent rule, they expect below-target inflation tomorrow to compensate for the current excessive inflation, which results in spending cuts today, and already contributes to limit the inflation surge at the first place. This tailwind is absent under IT since consumers expect inflation to go back on target – not below, which entails higher expectations and calls for higher interest rates to fight the inflation surge than under PLT. However, if the public fails to understand history dependence, their expectations turn into a headwind: while the central bank aims at below-target inflation, consumers’ higher inflation expectations call for tighter monetary policy and more severe output costs to bring inflation down than if they had expected lower inflation at the first place. Symmetrically, if inflation falls below the target, higher inflation expectations under PLT helps bring inflation back on target – even more so if interest rate cuts are unavailable due to the ELB – but lower expectations exacerbate the problem. Therefore, not only experts but also the public needs to understand the monetary policy framework for inflation to be more stable under PLT than under IT.
Yet there is no historical experience with PLT,Footnote 2 the FIRE assumption falls short in the empirical literature (D’Acunto et al., Reference D’Acunto, Malmendier and Weber2023) and models that relax it generally fail to reproduce the benefits of history-dependent rules (see Section 2). In this respect, forward-looking CB communication, or guidance – which is fully redundant under the FIRE assumption – may help nudge the public towards forming history-dependent expectations and help the properties of PLT materialize with non-FIRE agents. Communication may find a particular rationale once one acknowledges that expectations are also heterogeneous,Footnote 3 and the CB also needs to worry about cross-sectional dispersion and coordinating individual beliefs on the target.
We use a forecasting experiment where inflation and output gap expectations are elicited from a group of human subjects and represent the only degree of freedom in an otherwise standard macroeconomic model. Our experimental setting is the first to focus on both deflationary and inflationary environments, in an effort to reproduce the recent course of inflation. Moreover, we modify this class of experiments to come closer to real-world information settings and make past individual data of all forecasters public information. In particular, in surveys of professionals, such as the survey of professional forecasters (SPF), the entire cross-section distribution of forecasts and the (anonymized) identities of the forecasters are published in every period, making peer comparison a relevant element of the forecasting task. Professional forecasts are central to macroeconomic analysis since they are closely monitored by policy institutions and they are the ones used as observables to fit expectations in the standard framework that also underlies our experimental setting.Footnote 4 Beyond professionals, social behaviors – such as peer imitation, contagion and news diffusion – have been emphasized when modeling expectation formation of the public; see the work of (Carroll & Wang, Reference Carroll and Wang2023) on epidemiological expectations. We provide new evidence of peer imitation in the lab and replicate the experimental dynamics with a HENK model where agents can copy each other’s forecasts or learn to follow the CB guidance.
Our main findings are as follows. Both in the lab and in the HENK model, the benefits of PLT over an IT regime obtained under the FIRE assumption fail to materialize. On the contrary, inflation and output under PLT exhibit excess volatility compared to a standard IT regime, both in an inflationary and in a deflationary environment. These wild oscillations result from the commitment to correcting past price gaps in a learning environment, where expectations become unanchored and destabilize further output and inflation. However, the picture is drastically reversed if the CB communicates in each period just a single number, namely the time-varying transitory inflation target that is consistent with closing the price gap. In this case, expectations are better coordinated around the CB target, both deflationary and inflationary shocks result in smaller inflation gaps and shorter ELB episodes under PLT than under IT, in the lab as well as in the HENK model. In particular, the commitment to correct the deviations of the price level brings inflation toward the transitory target which, in turn, confirms the relevance of the CB’s guidance to forecast inflation and initiates a credibility-stability loop among the subjects and the HENK agents. We also find that long-run expectations remain closer to the target under PLT with guidance despite the short-run fluctuations in inflation generated by the exogenous shocks than under IT and PLT without additional communication. Both the experiment and the HENK model also produce persistent inflation gaps under IT consistent with the recent inflation course. Importantly, our study contributes to explaining the discrepancy in the literature about the properties of PLT because we find empirical arguments that describe both a PLT regime implying less or more volatility in inflation and output than a traditional IT regime depending on the public’s information set.
The rest of the paper proceeds as follows. Section 2 reviews the related literature, Section 3 describes the experimental design, Section 4 draws the main results from the experimental data and Section 5 discusses these data within the context of a HENK model. Section 6 concludes.
2. Related literature
The theoretical literature on history-dependent regimes is somewhat limited and rather discrepant. Woodford (Reference Woodford2000) argues that optimal monetary policy rules must involve some degree of history-dependence – which is absent from standard forward-looking IT rules – to reinforce the stabilizing role of expectations; see also Mitra (Reference Mitra2003). Under FIRE, PLT is then superior to IT from the point of view of inflation stabilization; see, e.g., Cateau et al. (Reference Cateau, Kryvtsov, Shukayev and Ueberfeldt2009). However, if agents form backward-looking expectations (e.g. under econometric learning), whether PLT remains superior to IT depends crucially on whether agents form history-dependent expectations; see Bodenstein et al. (Reference Bodenstein, Hebden and Winkler2022); Honkapohja and McClung (Reference Honkapohja and McClung2024); Honkapohja and Mitra (Reference Honkapohja and Mitra2020).
Which form of expectations would prevail under PLT is ultimately an empirical question that has been tackled in forecasting group experiments where expectations are elicited from human subjects; see Cornand and Heinemann (Reference Cornand and Heinemann2014) and Duffy (Reference Duffy, Kagel and Roth2016) for surveys.Footnote 5 Particularly related to monetary policy are, among others, the experiments of Pfajfar and Zakelj (Reference Pfajfar and Zakelj2016); Pfajfar and Zakelj (Reference Pfajfar and Zakelj2018), Hommes et al. (Reference Hommes, Massaro and Weber2019), Mauersberger (Reference Mauersberger2021), Kryvtsov and Petersen (Reference Kryvtsov and Petersen2021), Mokhtarzadeh and Petersen (Reference Mokhtarzadeh and Petersen2021), Rholes and Petersen (Reference Rholes and Petersen2021), Assenza et al. (Reference Assenza, Heemeijer, Hommes and Massaro2021), Kostyshyna et al. (Reference Kostyshyna, Petersen and Yang2024) and Hennequin and Hommes (Reference Hennequin and Hommes2024). In a nutshell, this literature concludes that forward-looking CB communication does not usually have large effects on expectations, most contributions study IT regimes, all focus on ELB dynamics, ignoring the stabilization trade-off between inflation and output arising from severe cost-push shocks, and none provides a unified model of their experimental results. Peer imitation is also left out despite its relevance in professional forecasting contexts.
The seminal contribution of Arifovic and Petersen (Reference Arifovic and Petersen2017) sets up an experiment where the CB communicates a time-varying inflation target in each period. They find that the expectations of the subjects become disconnected from such targets as soon as shocks push inflation sufficiently down; in other words, subjects first ‘need to see it to believe it.’ Closely related is the experiment of Cornand and M’baye (Reference Cornand and M’baye2018) that finds that communicating the inflation target brings only minor stabilization benefits under IT. Salle (Reference Salle2023) establishes a similar result at the ELB. Outside the lab, Del Negro et al. (Reference Del Negro, Giannoni and Patterson2023) point out that forward guidance has been less effective than the FIRE models predict (this is the so-called “forward guidance puzzle”); see also Mauersberger et al. (Reference Mauersberger, Nagel and Bühren2019) for a behavioral discussion. By contrast, our results bear less dire implications for CB communication than these papers. In our setting, CB guidance is plagued by endogenous credibility issues but the forward-guidance puzzle is clearly ameliorated.
As for PLT experiments, without communication, Hommes and Makarewicz (Reference Hommes and Makarewicz2021) find that a sufficiently strong reaction to the price gap can induce convergence back to the target from the ELB more often than under IT in a non-linear model. Salle (Reference Salle2023) finds a similar result in a frictionless model. In a horse-race experiment between different monetary policy regimes, Kostyshyna et al. (Reference Kostyshyna, Petersen and Yang2024) show that history-dependent regimes, in particular PLT, are destabilizing compared to IT. An additional treatment (run concurrently with ours) establishes that the publication of medium-run inflation and output projections similar to the ones studied in Mokhtarzadeh and Petersen (Reference Mokhtarzadeh and Petersen2021) decreases the likelihood of deflationary spirals at the ELB. We emphasize a different, more parsimonious communication strategy and, among other differences, we also consider the topical case of inflationary shocks. Beyond the lab, we further provide a model-based interpretation of our results while previous work has solely reported on experimental results.
We therefore also contribute to the growing literature on heterogeneous expectation models by providing experimental data to test these models.Footnote 6 Some models feature endogenous switches between different expectation rules in NK modelsFootnote 7 and some include endogenous credibility in IT regimes (Hommes & Lustenhouwer, Reference Hommes and Lustenhouwer2019; Ozden, Reference Ozden2025; Kostyshyna et al., Reference Kostyshyna, Ozden and Zhang2024). Other recent related models of heterogeneous expectations include Andrade et al. (Reference Andrade, Gaballo, Mengus and Mojon2019) and Evans et al. (Reference Evans, Gibbs and McGough2025).
3. The experimental design
3.1. The experimental environment
We design a group experiment with a between-subject design. Each experimental session involves a fixed group of six subjects tasked with making point forecasts of output and inflation gaps in the next period. The experimental economy unfolds for 75 periods split into two separate subsessions, one of 40 and one of 35 successive periods. In both subsessions, inflation and output gaps evolve according to a baseline three-equation NK model (see, e.g., Galí Reference Galí2015). The only difference from the standard textbook implementation is that expectations are provided by the subjects and need not align with RE or any ad-hoc learning mechanism commonly used in the theoretical literature.
In each period, we aggregateFootnote 8 the inflation and output gap expectations of the six subjects denoted by, respectively,  $\pi^{e}_{j,t+1}$ and
 $y^{e}_{j,t+1}$,
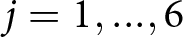 $j=1, ..., 6 $, using the arithmetic mean, that we denote by
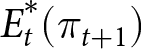 $E^{*}_{t}(\pi_{t+1}) $ and
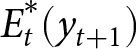 $E^{*}_{t}(y_{t+1})$. These aggregate expectations are then inserted into the standard IS and Phillips curves given by:
 \begin{equation}
\hat{y}_{t}=E^{*}_{t} \hat{y}_{t+1}-\sigma^{-1}\left(\hat{\imath}_{t}- E^{*}_{t} \hat{\pi}_{t+1}-\bar{r}\right)+ g_{t},
\end{equation}
 \begin{equation}
\hat{\pi}_{t}=\beta E^{*}_{t} \hat{\pi}_{t+1}+\kappa\hat{y}_{t}+u_{t},
\end{equation}
where  $\hat{y}_{t}$ is the output gap,
 $\hat{\pi}_{t}$ the inflation gap, that is the difference between inflation and the CB target
 $\pi^T$,
 $ g_{t}$ and
 $u_{t}$ exogenous real and cost-push shocks to be specified below,
 $\beta$ and
 $\sigma$ households’ preference parameters,
 $\kappa$ the slope of the Phillips curve and
 $\hat{\imath}_{t}$ the nominal interest rate set by the CB either with an IT or a PLT rule (depending on the experimental treatments, see Section 3.2), expressed in deviation from its steady-state level
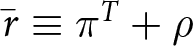 $\bar{r} \equiv \pi^{T}+\rho$. We use the standard parameter values
 $\beta=0.994$,
 $\sigma=1$,
 $\kappa=0.0625$.
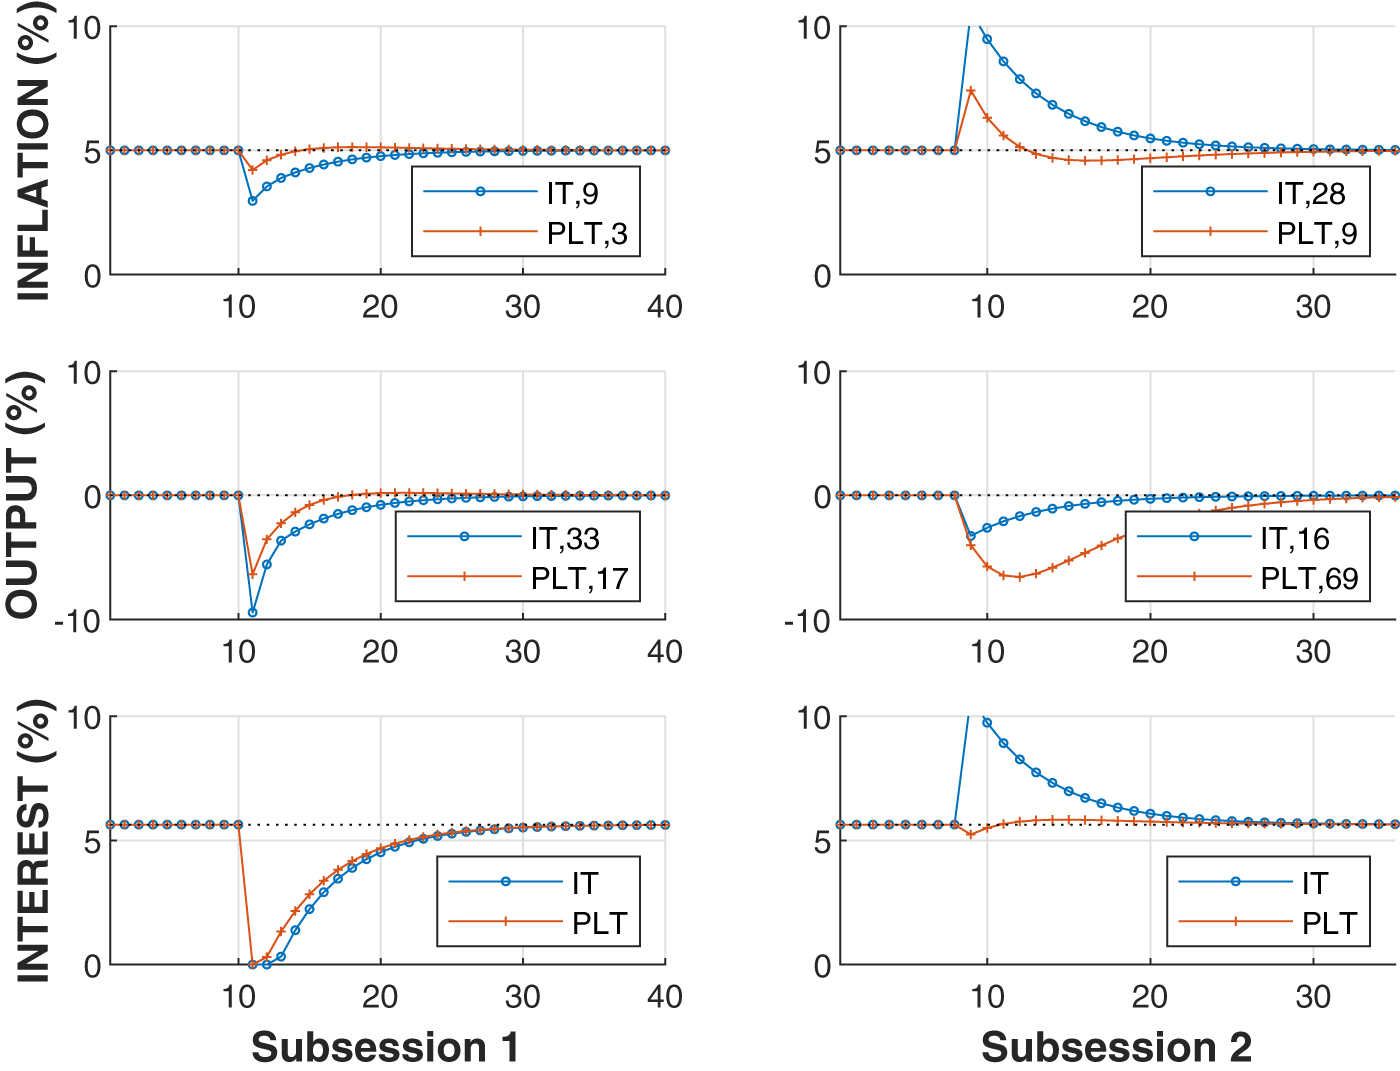
Each subsession starts with an initial learning phase for the subjects consisting of small white noise shocks around the targeted steady state. A severe, persistent and unannounced deflationary real shock then disturbs the economy in period 11 of Subsession 1 and a cost-push shock hits the economy in period 9 of Subsession 2.Footnote 9 The shock sequences are the same for all sessions and are displayed in Appendix B. In other words, we engineer two recessions in each experimental economy. In Subsession 1, the recession is coupled with low inflation and does not imply any stabilization trade-off but the severity of the initial shock induces an ELB episode in the model under RE independently of the monetary policy rule; see Section 3.2 and Fig. 1 below. By contrast, the recession in Subsession 2 is associated with inflationary pressures that imply a stabilization trade-off. Hence, we collect experimental data on the properties of IT and PLT in distinct economic environments. Additionally, to measure long-run inflation expectation anchoring in each environment, at period 26 of each subsession, we elicit a one-time inflation forecast for the end of the subsession that is, respectively, 15 and 10 periods later.
Simulations under RE

Fig 1 Long description
Inflation—Subsession 1: The graph shows inflation percentage over time, with the x-axis representing periods from 0 to 40 and the y-axis representing inflation percentage from 0 to 10. The IT series is marked with circles, showing a dip around period 10 and gradual recovery. The PLT series, marked with crosses, shows a smaller dip and steadier recovery. Inflation—Subsession 2: The graph shows a sharp spike in inflation for IT around period 10, followed by a decline. PLT shows a smaller spike and steadier decline. Output—Subsession 1: The graph shows output percentage over time, with the x-axis representing periods from 0 to 40 and the y-axis from negative 10 to 10. IT shows a sharp drop at period 10 and gradual recovery, while PLT shows a smaller drop and steadier recovery. Output—Subsession 2: IT shows a sharp drop followed by recovery, while PLT shows a smaller drop and slower recovery. Interest—Subsession 1: The graph shows interest percentage over time, with the x-axis representing periods from 0 to 40 and the y-axis from 0 to 10. IT shows a dip at period 10 and recovery, while PLT shows a smaller dip and steadier recovery. Interest—Subsession 2: IT shows a sharp spike at period 10, followed by a decline, while PLT shows a smaller spike and steadier decline. The graphs illustrate the differences in economic responses between IT and PLT across subsessions, highlighting the impact of shocks and recovery patterns.
The role of the subjects is framed as professional forecasters for a statistical bureau. The instructions – reproduced in Appendix F – explain the positive and negative relationships between the main variables in the economy and provide the value of the inflation target. All but a few pieces of information are identical across all treatments: the description of the monetary policy rule differs under IT and PLT, and subjects additionally receive an inflation guidance under the treatment that tests PLT with communication (see Section 3.2 below).Footnote 10 At the beginning of every period in all treatments, subjects observe the current and past shocks and all past endogenous variables, including the price level and its path consistent with the inflation target, which is labeled as ‘price level if inflation is always 5%’ under IT and ‘intended price level’ in the PLT treatments where the concept of price gap is also introduced in the instructions. All these pieces of information are displayed in a table and in charts on the graphical user interface (GUI), reproduced in Appendix F.2.
Importantly, and in contrast to the existing literature, subjects also observe the most recent forecasts of all other forecasters in their economy along with their payoff. An explicit ranking from the best to the worst forecasters in which each given subject is included (tagged by ‘YOU’) is updated in each period on a table on the GUI.Footnote 11 In other words, subjects observe their peers’ forecasting performances and can assess their relative performances. This design aligns the information set of the subjects with that of the HENK agents in Section 5.2 and of real-world professional forecasters, and does not affect cross-treatment comparisons. Moreover, the slow convergence under IT and volatile oscillations under PLT at the ELB in Section 4 match prior findings discussed in Section 2, which speaks against peer imitation affecting forecasting incentives.
Finally, subjects accumulate points that reward their forecast accuracy throughout the experiment. In each period, a forecast brings  $ \frac{100}{1+\text{absolute forecast errors in p.p.}}$ points, so that a perfect forecast brings 100 points. To rule out strategical hedging across the inflation and output forecasts, subjects accumulate a separate amount of forecasting points for each variable and only one of the two is randomly drawn at the end of the experiment to be converted into money at a rate of CA\$0.2 per 100 points. To reinforce the salience of the occasional long-run inflation forecasting task, the points corresponding to these two forecasts are converted at a rate of CA\$3 per 100 points.Footnote 12
3.2. Treatments and FIRE predictions
We implement three experimental treatments, denoted by IT, PLT, and PLT-G. Tr. IT differs from Trs. PLT and PLT-G only by the monetary rule that sets the nominal interest rate in Eq. (1). Under IT, the CB implements a standard contemporaneous Taylor rule subject to the ELB:
 \begin{equation}
\mathbf{IT:} \; \hat{\imath}_{t}=\max \left\{0,\bar{r}+\phi^{\pi}\hat{\pi}_t+\phi_{IT}^{y}\hat{y}_t\right\},
\end{equation}
where the ELB is set to 0% and we use 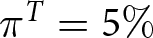 $\pi^{T} = 5\%$ and
 $\phi^{\pi}_{IT} = 1.5, \phi^y=1$, which ensures determinacy under RE and stability under backward-looking expectations, see App. A.
In Trs. PLT and PLT-G, the CB uses a PLT monetary policy rule. It is convenient to define the price gap 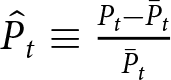 $\hat{P}_t \equiv \frac{P_t-\bar{P}_t}{\bar{P}_t}$, which measures the gap between the current price level
 $P_t$ and its predetermined targeted level
 $\bar{P}_t$ that grows at a rate
 $\pi^T$ consistent with the CB inflation target. In the log-linearized model, the price gap evolves as
 $\hat{p}_{t}=\hat{p}_{t-1}+\hat{\pi}_{t}$. In Trs. PLT and PLT-G, the CB sets the interest rate using the following rule:
 \begin{equation}
\mathbf{PLT:} \; \hat{\imath}_{t}=\max \left\{0,\bar{r}+\phi^{P} \hat{p}_{t}+\phi^{y}\hat{y}_t\right\},
\end{equation}
where we use 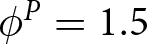 $\phi^P=1.5$ so that the initial policy responses to the shocks are the same in all treatments (holding everything else equal) and determinacy under RE and stability under learning of the targeted steady state hold; see App. A.
Tr. PLT-G differs from Tr. PLT only by the provision to the subjects of an inflation guidance. In Tr. PLT-G, in each period, subjects receive an inflation guidance that corresponds to the implicit time-varying inflation level that would close the price gap in any period  $t$. (see App. A for detail). Hence, the guidance, that we denote by
 $\pi_t^{CB}$, is model-consistent. Under the FIRE assumption, it is redundant because expectations are already model-consistent, and there is no difference between Trs PLT and PLT-G. Under real-world expectations however, the guidance may help subjects coordinate their expectations on the history-dependent path. In each period, subjects receive the guidance in a bold and highlighted manner on the GUI, and all previous guidance announcements are displayed on the inflation graph; see App. F.2.
The guidance carries the underlying structure of the PLT regime while keeping the frame of the CB communication in terms of inflation rather than price level, which we conjecture to be an easier-to-grasp and more practical communication regime for the public than a communication in terms of price levels.
More generally, we phrase monetary policy in terms of inflation rate under both IT and PLT, even though the price level may be the salient variable under PLT, and eliciting inflation expectations need not be equivalent to eliciting price-level expectations in terms of expectation formation and macroeconomic dynamics. Our choice is motivated by external validity concerns: in practice, policy institutions communicate in terms of inflation rates, not price levels. Significant resources are devoted to measuring and analyzing inflation expectations under the prevailing IT frameworks. Moreover, inflation, not the price level, underpins key economic measures such as real returns or wages, and international comparisons. In most macroeconomic models, nominal variables like the price level are also indeterminate, and the focus is thus placed on inflation dynamics. For these reasons, both academic and policy discussions of PLT are typically framed in terms of inflation rates, and so is our experiment.
Figure 1 provides the dynamics of the IT and PLT experimental economies under the FIRE benchmark given our calibration; see Appendix A for the derivations. In line with the discussion in introduction, it is clear that PLT is superior to IT for a CB primarily concerned with inflation stabilization. PLT better stabilizes inflation and output gaps than IT in the absence of policy trade-off (namely in face of deflationary pressures, see left panel), even though the ELB binds under both regimes (bottom left panel). When facing inflationary pressures (right panel), PLT better limits the rise in inflation but at the price of a deeper recession than under IT (middle right panel). Comparing inflation and output gap dynamics in the three treatments allow us to assess whether this ranking is robust to laboratory expectations.
3.3. Implementation
The experimental software was programmed using oTree (Chen et al., Reference Chen, Schonger and Wickens2016). A first batch of six experimental sessions for each of the three treatments was conducted in person at the CRABE lab at Simon Fraser University (SFU) between August and October 2022. Six additional sessions per treatment were added, two at SFU in January and February 2025 and four at the CREED lab of the University of Amsterdam in April of the same year, involving a total of 216 subjects. The robustness treatment PLT-G-R in Appendix D was also run with the same subject pool composition in 2025. The average duration of each session was just over two hours. In 2022, SFU participants earned an average of CA\$24.8 including a CA\$7 participation fee (from a minimum of 15 to a maximum of 38 with a standard deviation of 6.75), and CA\$31.16 with a standard deviation of 5.03 in 2025 following the post-COVID-19 SFU lab guidelines. Following the 2025 CREED guidelines, participants earned an average of € 36.9 (with a standard deviation of 7.3), which reflects higher payment expectations given a higher net minimum wage and higher recent inflation in the Netherlands than in Canada.
Upon entering the lab, subjects were provided with the instruction booklet which gives a qualitative overview of the relationships among the variables and clearly explain the tasks.Footnote 13 Subjects were then asked to carefully read the instructions and complete a comprehension quiz in order for the experiment to start. The forecasting game started with Subsession 1. All predictions were submitted on the GUI. At the end of the first subsession and before starting Subsession 2, subjects were provided with the updated instruction booklet that highlights the change in the shock, from real to cost-push shocks. We introduced information about the shocks in such a sequential manner to prime subjects towards the particular economic environment implemented while avoiding the cognitive overload that could result from simultaneous information about various types of shocks. Finally, at the end of the second subsession and before leaving the lab, the subjects were asked to complete an exit survey consisting of demographic questions, central banking literacy, and the strategy(ies) used in the experiment, if any.
4. Experimental results
We describe the macroeconomic dynamics and then dig into the individual forecast times series to study cross-sectional dispersion and show evidence of peer imitation.
4.1. Macroeconomic dynamics in the experimental economies
Figs 2-4 report the dynamics of inflation, output gap and interest rate in all experimental economies (dashed blue lines) in, respectively, Trs. IT, PLT, and PLT-G, along with the median realization over the 12 sessions in each treatment (red thick lines). In Tr. PLT-G, since we may not directly observe whether subjects use the CB guidance to form their inflation forecasts, we compute a “credibility index,” i.e. the distance between individual inflation forecasts and the guidance, averaged across all subjects for each period:
 \begin{equation}
Cred_{t}^{CB}= \frac{1}{6}\sum_{j=1}^6 exp(-(\pi^{e}_{j,t+1}-\pi_t^{CB})^2),
\end{equation}
where a higher value indicates a higher CB credibility. The bottom panel of Fig. 4 displays the dynamics of this credibility index in Tr. PLT-G.
Inflation, output gap and interest rate dynamics in Tr. IT

Fig 2 Long description
The figure consists of six line plots illustrating the dynamics of inflation, output and interest rates over time in two subsessions. Each plot has a y-axis labeled in percent and an x-axis representing time in periods. The top row shows inflation, the middle row shows output and the bottom row shows interest rates. The left column represents Subsession 1 and the right column represents Subsession 2. In each plot, dashed blue lines represent individual experimental sessions, while a solid red line indicates the median realization. A vertical dashed line marks the time of a large shock, occurring around period 10. In Subsession 1, inflation initially decreases sharply after the shock, reaching a trough around period 20, then gradually returns toward zero. Output shows a similar pattern, with a significant drop post-shock and recovery by period 40. Interest rates rise sharply after the shock, peaking around period 20, before stabilizing. In Subsession 2, inflation rises after the shock, peaking around period 15, then declines toward zero. Output decreases post-shock, with a gradual return to baseline. Interest rates increase sharply, peaking around period 15, then stabilize. The plots highlight the response dynamics to the shock across different economic variables.
Inflation, output gap and interest rate dynamics in Tr. PLT

Fig 3 Long description
The multi-line graphs illustrate inflation, output and interest rate dynamics across two subsessions. The x-axis represents time periods, while the y-axis measures percentage deviations from baseline, ranging from negative 10 to positive 10 percent. Each graph includes lines for experimental sessions and median values, with vertical dashed lines marking the time of large shocks. In Subsession 1, inflation shows fluctuations with peaks around time 15 and 30, output peaks near time 20 and interest rates peak around time 25. Subsession 2 displays similar patterns, with inflation peaking near time 10 and 25, output peaking around time 15 and interest rates peaking near time 20. The experimental session lines are dashed, while median values are solid. The graphs demonstrate how inflation, output and interest rates respond to large shocks, with median values smoothing volatility. Subsession 2 shows slightly different dynamics compared to Subsession 1, indicating varied responses to shocks. The purpose is to analyze the impact of large shocks on economic variables and the stabilizing effect of median values.
Inflation, output gap and interest rate dynamics in Tr. PLT-G

Fig 4 Long description
The figure consists of eight line plots displaying inflation, output, interest and credibility index over time across two subsessions. Each plot has the x-axis labeled as ′Subsession′ with periods ranging from 0 to 40 for Subsession 1 and 0 to 35 for Subsession 2. The y-axes are labeled as follows: inflation in percent, output in percent, interest in percent and credibility index ranging from 0 to 1. Dashed blue lines represent individual experimental sessions, while red thick lines indicate the median realization. A vertical dashed line marks the ′Time of Large Shock.′ In Subsession 1, inflation, output and interest show a sharp dip around the shock, followed by a gradual return to baseline. The credibility index fluctuates significantly. In Subsession 2, similar patterns are observed with variations in timing and magnitude. The plots illustrate the dynamic responses to economic shocks, with notable peaks and troughs in each variable.
Table 1 reports cross-treatment comparisons regarding inflation and output gap stabilization. To do so, we compute the per-period average of the absolute deviation (AAD) of inflation and output gap from their targets. For each session  $s=1, .., 12$ and subsession
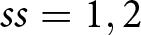 $ss=1, 2$ with a given duration of
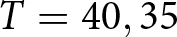 $T=40,35$ periods, the AAD for each variable reads as:
 \begin{equation}
AAD_{s,ss}^\pi=\frac{1}{T}\sum_{t \in T}|\pi_{s,ss,t}-\pi^T| \text{ and } AAD_{s,ss}^y=\frac{1}{T}\sum_{t \in T}|y_{s,ss,t}|,
\end{equation}
where lower values indicate a better stabilization of inflation and output gap. In Table 1, we disentangle pre-shock (top panel) from post-shock periods, which include the shock periods themselves (bottom panel).
Cross-treatment comparisons of inflation and output gap in the experiment

Table 1 Long description
Cross-treatment results report average absolute deviations from target for inflation and the output gap, split into pre-shock and post-shock panels and two subgroups, with standard deviations in parentheses and pairwise p-values. Pre-shock inflation deviations are similar for IT and PLT in subgroup 1 (about 0.68 and 0.67) but lower under PLT-G (0.32), with significant differences versus PLT-G (p 0.03 for both comparisons). Pre-shock inflation in subgroup 2 is much higher under PLT (2.07) than IT (0.67) or PLT-G (0.28), and PLT differs from PLT-G at less than 0.01. Pre-shock output-gap deviations are far larger under PLT (2.65 and 4.55) than IT (0.47 and 0.32) and PLT-G (1.51 and 0.87), with IT versus PLT significant at less than 0.01 in both subgroups. Post-shock, PLT deviations rise sharply for both inflation (5.14 and 10.33) and the output gap (11.10 and 19.99), while IT and PLT-G remain much lower (inflation roughly 0.36 to 1.56; output gap roughly 0.76 to 3.5). Many post-shock comparisons involving PLT are significant at less than 0.01, and IT versus PLT-G is sometimes not significant (for example, subgroup 2 inflation p 0.38 and subgroup 1 output gap p 0.38). P-values come from nonparametric rank-sum tests at the matching-group level and are adjusted for multiple comparisons, so significance reflects those corrections.
Note: The average of the absolute deviation (AAD) of inflation π and output y from their target displayed in the first three columns are computed as per Eq. (6) and are averaged across all 12 sessions of each treatment. Standard deviations are reported between brackets. The p-values displayed in the last three columns correspond to the non-parametric Wilcoxon rank-sum tests for comparison between each pair of treatments performed at the matching group level with N = 12 observations per treatment. The p-values are adjusted for multiple comparisons with the Holm (Reference Holm1979) sequentially-rejective procedure.
Overall, the merits of PLT under FIRE do not extend to the lab environment: experimental economies under PLT are more unstable than under IT. However, once augmented with CB guidance in Tr. PLT-G, the stabilization benefits of PLT materialize in the lab and this treatment delivers the smallest inflation gap.
In detail, in the first periods of each subsession – i.e. before the shocks, inflation and output appear similarly stabilized around their target under IT and PLT with guidance while displaying wilder oscillations under PLT. This visual impression is confirmed by the cross-treatment comparisons of the AADs (top panel of Table 1). The ADDs of inflation and output are significantly higher in Tr. PLT than in Trs. IT and PLT-G. In the aftermath of the large shocks, in both subsessions, the cross-treatment differences become even more salient: while economies in IT and PLT-G eventually converge back to the targeted steady-state, economies in Tr. PLT exhibit wilder and non-dampening oscillations. The bottom panel of Table 1 reports that the AADs of both inflation and output gap are considerably and significantly higher in Tr. PLT than in Trs. IT and PLT-G. The standard deviations of the AADs under PLT are also strikingly larger than in the two other treatments, which indicates more variation across independent economies.
Even if inflation returns towards the target in both Trs. IT and PLT-G, the inflation gap under IT exhibits more persistence in the aftermath of the recessions. Inflation remains persistently below target in the deflationary shock subsession (left panel) and persistently above target in the cost-push shock subsession (right panel). These observations are consistent with the persistently low inflation experience post-Great Financial Crisis and the persistently high inflation in the post-COVID-19 pandemic. These circumstances result in an unanchoring of inflation expectations, see Section 4.2, consistent with the hoovering of the one-year-ahead inflation forecasts from professionals (SPF) below 2% in the US and the Euro area over the 2010 decade, and the recent landing of both household and professional one-year-ahead inflation forecasts toward 3% in the US (see the SPF and Michigan household survey as of 2024Q4).
By contrast, in Tr. PLT-G, inflation returns to the target in a quicker time frame than under IT with negligible fluctuations, as shown in Fig. 4. This inflation stabilization in Tr. PLT-G is observed under both types of shocks but is most salient after the deflationary shock. In particular, in the wake of the deflationary recession, the ELB binds for a median time of only two periods under Tr. PLT-G, in line with the FIRE benchmark and considerably less than the four periods of ELB in Tr. IT. Looking at the credibility index in Tr. PLT-G (bottom panel of Fig. 4), while credibility substantially drops at the onset of the recessions, it increases back toward one (full credibility) along the recoveries. Finally, in line with the FIRE prediction, a better inflation stabilization in Tr. PLT-G than in Tr. IT comes at the cost of a wider output gap, in particular after a cost-push shock. This is confirmed in the bottom panel of Table 1: the output gap in Subsession 2 is significantly wider in Tr. PLT-G than under Tr. IT.
We now turn to the analysis of individual forecasts.
4.2. Heterogeneity in individual forecasts
Fig. 5 reports the median short-run forecast dispersion across all 12 sessions of each treatment, measured by the standard deviation of the distribution of forecasts of the six subjects in each period. Table 2 complements the graphical analysis with the corresponding cross-treatment comparative statistics.
Between-subject disagreement in short-run forecasts

Fig 5 Long description
The figure consists of four line graphs arranged in a two-by-two grid. The top row shows inflation trends and the bottom row shows output trends. Each column represents a different subsession, labeled as Subsession 1 and Subsession 2. The x-axis for all graphs is labeled ′Subsession′ with a range from 0 to 40. The y-axis for the top graphs is labeled ′Inflation′ with a range from 0 to 6 and for the bottom graphs, it is labeled ′Output′ with a range from 0 to 8. Each graph includes three lines representing different treatments: IT (solid blue line), PLT (dotted orange line) and PLT-G (dashed red line). A vertical dashed black line indicates the ′Time of Large Shock′ at approximately the 10 mark on the x-axis. In Subsession 1, the PLT line shows a sharp peak in inflation and output shortly after the shock, while IT and PLT-G remain relatively stable. In Subsession 2, similar patterns are observed, with PLT showing more volatility compared to IT and PLT-G.
Cross-treatment comparisons of subjects’ forecasts in the experiment

Table 2 Long description
Cross-treatment results report average disagreement in short-run forecasts (inflation and output) before and after a shock, plus long-run inflation forecasts, shown separately for Subsession 1 and Subsession 2. In the pre-shock short-run panel, PLT generally has higher disagreement than IT and PLT-G: for example, output disagreement in Subsession 1 is 1.91 under PLT versus 0.80 under IT, with a p-value of 0.04 for IT versus PLT. In Subsession 2 pre-shock, PLT is much higher than both IT and PLT-G for inflation (1.19 versus 0.35 and 0.32) and for output (1.87 versus 0.20 and 0.44), with p-values below 0.01 for PLT compared with each alternative. In the post-shock short-run panel, PLT remains the highest across all rows, such as output disagreement in Subsession 2 at 3.15 under PLT versus 0.43 under IT and 1.31 under PLT-G, with all pairwise p-values below 0.01. Differences between IT and PLT-G are often smaller and sometimes not statistically significant, such as post-shock inflation disagreement in Subsession 1 (0.43 versus 0.33; p-value 0.48). Long-run inflation forecasts are similar across treatments in Subsession 2 (around 5.40 for IT and PLT-G, 1.39 for PLT) with p-values reported as greater than 0.99 for all pairwise comparisons, indicating no detected differences there. In Subsession 1 long-run inflation, PLT-G is higher (5.39) than IT (4.37) with a p-value of 0.03, while IT versus PLT is not statistically significant (p-value 0.12). Values in parentheses are dispersion measures, and p-values reflect pairwise comparisons rather than effect sizes.
Note: See Table 1. Forecast disagreement (top and middle panel) is computed as the standard deviation across the six forecasts in each period and is averaged over the 12 sessions of each treatment. The bottom panel reports the average of the long-run inflation forecasts, elicited once per subsession for the final period of the subsession. The associated p-values report pairwise cross-treatment comparisons.
Forecast dispersion varies both within treatments, i.e. over time, and between treatments. From Fig. 5, we see that pre-shock forecast dispersion declines in all treatments and subsessions, especially in Trs. IT and PLT-G, which suggests that subjects learn to coordinate on the target in the absence of large shocks in these two treatments. Table 2 (top panel) indicates that pre-shock disagreement is similar across treatments in Subsession 1 but significantly higher in Subsession 2 under Tr. PLT than in the two other treatments.
In the wake of the shocks, forecast dispersion rises in all treatments. In Trs. IT and PLT-G, in line with the better stabilization of the endogenous variables compared to Tr. PLT, forecast dispersion tends to revert back towards its pre-shock level, while it remains persistently elevated in Tr. PLT.Footnote 14 The statistical tests reported in the middle panel of Table 2 confirm this pattern: after the shocks, short-run forecasts are significantly more dispersed under Tr. PLT than under Trs. IT and PLT-G. By contrast, forecast dispersion is not significantly different between Trs. IT and PLT-G, except for output forecasts after the cost-push shock in Subsession 2 which are more dispersed under PLT-G than under IT. This difference is consistent with the sharper stabilization trade-off and resulting steeper output drop in the wake of the shock under PLT than under IT discussed above. However, Fig. 5 shows that, by the end of Subsession 2, output forecast dispersion converges to a negligible level in Tr. PLT-G, comparable to the level observed in Tr. IT, while it remains elevated in Tr. PLT.
The bottom panel of Table 2 reports the average long-run inflation forecasts (namely for the final period of each subsession) across all subjects, which speaks to cross-treatment differences in the level of long-run expectations in each subsession. Fig. A.2 plots their distributions, which illustrates their dispersion. While we cannot find any statistically significant difference across the three treatments in their level, their distribution differs sharply: under Tr. PLT, long-run forecasts are strikingly more dispersed, especially in Subsession 2, whereas they remain more tightly concentrated around the target under Trs. IT and PLT-G.
To gain further insights into long-run anchoring of expectations, Table 3 reports the estimated asymptotic values of the short-run forecasts, in deviation from the target, using the method of Duffy (Reference Duffy, Kagel and Roth2016). Short-run forecasts converge to the target in a strong sense only in Tr. PLT-G, with the asymptote being the largest in Tr. PLT.Footnote 15
Asymptote estimates of the deviation of the average short-run inflation forecasts from the target

Table 3 Long description
Asymptote estimates summarize the long-run deviation of average short-run inflation forecasts from the target under three regimes: IT, PLT, and PLT-G. IT has an estimate of minus 0.15 with a standard deviation of 1.39, and p-values 0.40 and 0.32, indicating weak evidence that forecasts converge within the stated tolerance band. PLT shows a much larger negative estimate, minus 5.79, with a very large standard deviation of 11.36 and p-values 0.68 and 0.29, also suggesting little evidence of convergence. PLT-G is essentially zero, minus 0.003, with a standard deviation of 0.33 and p-values 0.06 and 0.06, marked with a single star to indicate rejection of non-convergence at the 10 percent level. Overall, PLT-G appears most consistent with long-run forecasts aligning with the target, while IT and especially PLT are more negative and less precise. Results rely on an autoregressive model and an equivalence-style test, so p-values reflect evidence for being within a tolerance band rather than a standard difference-from-zero test.
Note: Estimated mean of an AR(1) process on short-run inflation forecasts, averaged per period at the treatment level; see Duffy (Reference Duffy, Kagel and Roth2016). The p-values refer to the equivalence test using the two one-sided test (TOST) procedure where the null hypothesis is a deviation of the asymptotic forecast value from a 10%-radius of the 5% target, and the alternative hypothesis is the convergence of the long-run forecasts within 10% of the target. ***, ** and * indicate that non-convergence is rejected at 1, 5, and 10%.
To conclude, we highlight the two main experimental results:
(IT $ \gt $PLT)

Contrary to the FIRE predictions, inflation and output gaps are better stabilized around their target under IT than under PLT, no matter the type of shocks. Short-run expectations are also more homogeneous under IT than under PLT, especially after shocks, and inflation forecasts are better anchored at the target.
(PLT-G
$ \gt $IT)

Once the CB communicates in each period the inflation rate that is consistent with closing the price gap, the superior stabilization properties of PLT under FIRE materialize: shocks have less persistent effects, the ELB binds for fewer periods, and expectations are better anchored around the target under PLT with guidance than under IT, while remaining equally coordinated under both regimes.
We now dig further into individual forecast data.
4.3. Expectation formation and evidence of peer imitation
We first use panel models at the subject-period level to identify which pieces of the available information significantly relate to the inflation and output forecasts in each treatment. The details of the models are deferred to Table A.1 in App. C. The main takeaway is that the subjects react to the most recent inflation and output gap values, their own latest forecasts, the best forecasts in their group and, to a lesser extent, the shocks. They never react to the past price gap, which indicates that expectations are not model-consistent in Tr. PLT. Moreover, consistent with prior experimental findings (e.g., Assenza et al., Reference Assenza, Heemeijer, Hommes and Massaro2021), inflation and output gap forecasts appear decoupled: inflation forecasts respond primarily to past inflation and past inflation forecasts, while output gap forecasts are linked to their own respective histories, with minimal cross-influence.
To refine our description of the forecasts and uncover evidence of peer imitation, we estimate heuristics on the forecast time series for each subject. We modify the set of heuristics that usually approximate well the forecasting behaviors of the subjects in this class of experimentsFootnote 16 to include the forecasts of the most accurate forecaster of the group in any given period. We denote this additional piece of information by  $\pi^e_{BF,t}$. For each subject, we estimate the following inflation forecasting models:
 \begin{equation}
\pi^e_{t+1} = f(\pi^e_{BF,t}) + \epsilon_t,
\end{equation}
 \begin{equation}
\pi^e_{t+1} = f(\pi^e_{BF,t},\pi^e_{t}) + \epsilon_t,
\end{equation}
 \begin{equation}
\pi^e_{t+1} = f(\pi_{t-1},\pi_{t-2}) + \epsilon_t,
\end{equation}
 \begin{equation}
\pi^e_{t+1} = f(\pi_{t-1},\pi_{t-2},\pi^e_{BF,t}) + \epsilon_t,
\end{equation}
 \begin{equation}
\pi^e_{t+1} = f(\pi_{t-1},\pi_{t-2},\pi^e_{BF,t},\pi^e_{t},F_t) + \epsilon_t,
\end{equation}
 \begin{equation}
\pi^e_{t+1} = f(\pi^e_{t},\pi_{t-1}) + \epsilon_t,
\end{equation}
 \begin{equation}
\pi^e_{t+1} = f(F_t) + \epsilon_t,
\end{equation}
 \begin{equation}
\pi^e_{t+1} = f(\pi_{t-1},\pi_{t-2},F_t) + \epsilon_t,
\end{equation}
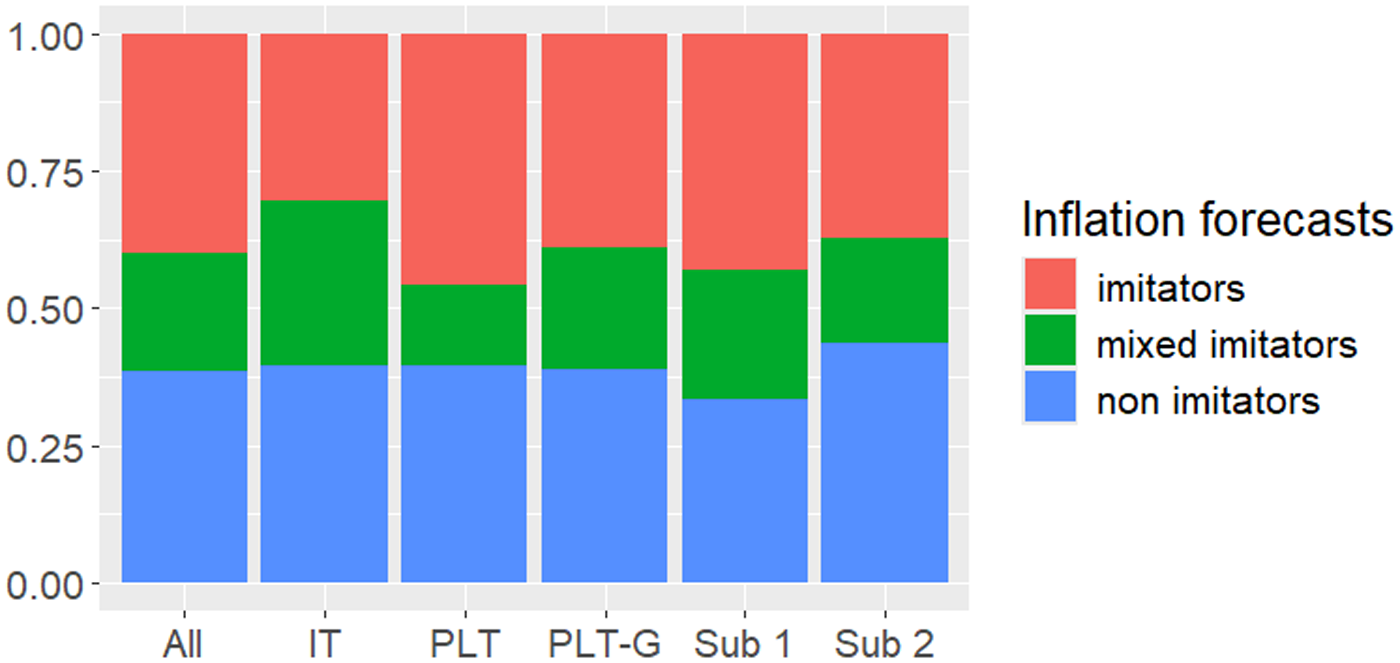
where  $f(\cdot)$ is a linear function in its arguments. Models (7), (8), (10) and (11) make use of the best forecasts and correspond to “imitation models.” Model (7) is a “copy-cat” strategy that consists in adopting the best forecast. Model (8) also relies on the individual previous forecasts and may therefore be defined as an “adaptive imitator.” Model (10) corresponds to an “anchoring-and-adjustment” rule where the anchor is the best forecast and the adjustments take place in the direction of the most recent inflation trend. Model (11) is a mixed model where all these pieces of information are used to make predictions. Models (9), (12) (13) and (14) are the four benchmarks discussed in Footnote 16. We include these standard ‘non-imitation’ models to allow for the possibility that subjects do not significantly imitate. We use the Akaike Information Criterion (AIC) to classify each subject across one of these forecasting heuristics. The results are presented in Fig. 6 for inflation forecasts and in Fig. A.4 for output gap forecasts, where we show the fraction of ‘imitators’ (defined as subjects assigned to Models (7), (8) or (10)), ‘mixed imitators’ (assigned to Model (11)) and non-imitators (assigned to any other models) over all sessions, per treatment and subsession.
Proportions of imitation, mixed and non-imitation heuristics among all subjects

Overall, we find evidence of peer imitation, and to a similar extent in both inflation and output gap forecasts and across treatments.Footnote 17 Imitation may arise due to the complexity of the environment or strategic complementarities in the NK models, where aligning with others’ expectations is payoff-enhancing. Salient reference points – like the best forecaster’s predictions or the CB guidance – can serve as coordination devices since they are self-fulfilling.
Finally, Fig. A.3 plots the distributions of the estimated coefficients of the imitation models. The coefficient values are consistent with the interpretation of each rule. In the “copycat” model (7), the estimated coefficients associated with the best forecasts are distributed around 1 (see the top-left panel of Fig. A.3). In the “anchoring-and-adjustment” rule (10), the coefficients associated with the past two inflation lags are of the same magnitude on the unit interval but of opposite signs, which is consistent with an adjustment in line with the latest inflation trend (see top-right panel). The “adaptive imitator” model (8) reflects a weighted average between the best forecast and the latest inflation (see bottom-left panel). The estimated coefficients associated with these pieces of information remain of the same order of magnitude in the mixed model (see bottom-right panel).
We now use a behavioral model with peer imitation to rationalize the lab data.
5. A parsimonious model of the experimental data
5.1. Overview of the HENK model
We describe here expectations in the HENK model, based on a simplified version of Arifovic et al. (Reference Arifovic, Grimaud, Salle and Vermandel2025), and refer to Appendix E for detail. Each agent  $j$ enters each period with their own inflation and output gap forecasts
 $\xi^{x}_{j,t-1} $,
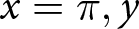 $x=\pi, y$. They then receive private news
 $\iota^{x}_{j,t}$ which modifies their forecasts into:
 $m^x_{j,t} \equiv \xi^x_{j,t-1} + \iota^{x}_{j,t}$,
 $x=\{y, \pi\}$. Each updated belief
 $m$ is evaluated using its ‘Foregone’ error, denoted by
 $F_{j,t}^{x} \equiv (\hat{x}_{t-1}-m_{j,t}^{x})^{2}$, which represents the forecast error that the agent would have made in
 $t-1$ had they used
 $m^x$ as a forecast for
 $x$. Finally, agents are paired for peer imitation, and the one with the higher foregone error adopts the other’s beliefs, which sets
 $\xi^{x}_{j,t}$. This process repeats itself in the next period.
With CB guidance, agents have a third element, a “credibility” level, denoted by  $c_{j,t} \in [0,1]$, that is their probability of aligning their inflation forecast with the guidance, instead of using their own belief. This component is also modified by news. The foregone inflation forecast error is adjusted to reflect the weighted average of the two errors under the two forecasting strategies, i.e.
 $F_{j, t}^{\pi}=c_{j, t}\left(\hat{\pi}_{t-1}-\pi_{t}^{C B}\right)^{2} +\left(1-c_{j, t}\right)\left(\hat{\pi}_{t-1}-m_{j, t}^{\pi}\right)^{2}$. The CB guidance does not affect output gap expectations.
Expectations are initialized around the steady state so that the news are the only processes to be specified, which ensures parsimony. We use independent Gaussian draws  $\iota^x_{j,t}\sim \mathcal{N}(\theta^x(g_{t}, u_{t}), \sigma_x)$,
 $x=y, \pi, c$, where the ‘average news’
 $\theta^x$ about variable
 $x$ linearly depends on the latest observable shocks so that the news convey some fundamental information while keeping an unconditional zero mean. Since the instructions qualitatively describe the effects of the shocks, we impose
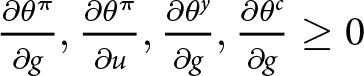 $\frac{\partial \theta^{\pi}}{\partial g}, \frac{\partial \theta^{\pi}}{\partial u}, \frac{\partial \theta^{y}}{\partial g}, \frac{\partial \theta^{c}}{\partial g}\geq 0$ and
 $\frac{\partial \theta^{y}}{\partial u}, \frac{\partial \theta^{c}}{\partial u} \leq 0$, which means that in the model, the negative real shock
 $g$ in Subsession 1 tends to decrease inflation expectations, credibility and output gap outlooks, and a positive cost-push shock in Subsession 2 tends to bring inflationary and recessionary prospects with a lower CB credibility.
The model is simulated without any input from the experiment besides the time series of the shocks and the parameter values of the New Keynesian model. The information set of the HENK agents is consistent with that of the experimental subjects and the model nests the RE benchmark, which avoids taking an ex-ante stand on the nature of expectations that generates the experimental dynamics.
5.2. Cross-treatment comparisons
Figs 7-9 plot the simulated counterparts of Figs 2-4 under, respectively, IT, PLT and PLT-G, along with the median realizations in the experiment. A first glance at the figures reveals that the model can account for the main five stylized facts of the experiment.
First, inflation and output exhibit wilder and non-dampening oscillations under PLT compared to the stabilization observed towards the end of the subsessions under IT and PLT-G. Second, inflation returns to the target more quickly under PLT-G, along mild, symmetric oscillations, than under IT, where the inflation gap is more persistent – negative in the first subsession and positive in the second. Third, this persistence translates into a fairly long episode of low nominal interest rates in Subsession 1 under IT, which echoes the ‘low-for-long’ narrative up until 2021. It is different under PLT-G, where the nominal rate converges back to steady state after a few periods only. Fourth, even under PLT-G, the macroeconomic oscillations contrast with the RE dynamics. Fifth, the recession after the cost-push shock in Subsession 2 under PLT-G is larger than under IT.
Inflation, output gap and interest rate dynamics under IT in the HENK model

Fig 7 Long description
Three multi-line graphs with a legend reading 90 percent Interval, Median, Median experimental counterpart. The horizontal axis on all three graphs shows values from 0 to 40. The vertical axis labels are INFLATION (percent), OUTPUT (percent) and INTEREST (percent). Each graph contains a 90 percent Interval band and two median lines labeled Median and Median experimental counterpart. INFLATION (percent) graph, x-axis range 0 to 40, y-axis label INFLATION (percent). Tick labels visible include 0 on the y-axis. The Median line drops below 0 after the start, reaches a low point around the middle of the horizontal range, then rises toward 0 by the end. The Median experimental counterpart follows a similar shape with smaller deviations. OUTPUT (percent) graph, x-axis range 0 to 40, y-axis label OUTPUT (percent). Tick labels visible include 0 on the y-axis. The Median line dips below 0 early, reaches a trough around the first third of the horizontal range, then returns toward 0 and stays near 0 through the end. The Median experimental counterpart follows a similar dip and recovery. INTEREST (percent) graph, x-axis range 0 to 40, y-axis label INTEREST (percent). Tick labels visible include 0 on the y-axis. The Median line falls sharply below 0 early, reaches the lowest point shortly after the start, then rises steadily toward 0 and remains slightly below 0 near the end. The Median experimental counterpart follows the same sharp drop and recovery pattern. Text below these three graphs reads Subsession 1. Three multi-line graphs with the same legend items: 90 percent Interval, Median, Median experimental counterpart. The horizontal axis on all three graphs shows values from 0 to 35. The vertical axis tick labels visible include 0 and 10 on the first graph, negative 10, 0 and 10 on the second graph and 0 and 10 on the third graph. Each graph contains a 90 percent Interval band and two median lines labeled Median and Median experimental counterpart. First graph, x-axis range 0 to 35, y-axis tick labels 0 and 10. The Median line rises from near 0 to a higher level around the first third of the horizontal range, then gradually declines and levels off above 0. The Median experimental counterpart follows a similar rise and leveling pattern. Second graph, x-axis range 0 to 35, y-axis tick labels negative 10, 0, 10. The Median line drops below 0 early, then returns toward 0 and stays close to 0 for the remainder. The Median experimental counterpart follows a similar drop and return. Third graph, x-axis range 0 to 35, y-axis tick labels 0 and 10. The Median line increases from near 0 to a higher level around the first third of the horizontal range, then slowly declines and levels off above 0. The Median experimental counterpart follows a similar increase and leveling pattern. Text below these three graphs reads Subsession 2.
Inflation, output gap and interest rate dynamics under PLT in the HENK model

Fig 8 Long description
Six time-series plots arranged in three rows and two columns, with row labels INFLATION (percent), OUTPUT (percent) and INTEREST (percent). The bottom labels read Subsession 1 for the left column and Subsession 2 for the right column. A legend at the top lists 90 percent Interval, Median and Median experimental counterpart. Top-left plot (Inflation). The x-axis has tick labels 0, 10, 20, 30, 40. The y-axis label is INFLATION (percent). Three lines and a dashed interval band are shown. The median line stays near 0 from 0 to about 15, rises to about 2 to 3 around 20, then declines toward about 1 by 40. The experimental counterpart line rises above the median around 15 to 25, reaching about 4 to 5 near 25 to 30, then falls toward about 2 by 40. The 90 percent interval widens after about 15, with the upper dashed line reaching around 6 to 7 near 30 to 35 and the lower dashed line near about minus 1 to 0. Top-right plot (Inflation). The x-axis has tick labels 0, 5, 10, 15, 20, 25, 30, 35. The y-axis label is INFLATION (percent). The median line is near 0 to 1 up to about 10, rises to around 3 near 15, then declines toward about 0 by 35. The experimental counterpart line drops below 0 around 10 to 20, reaching about minus 3 to minus 4 near 15 to 20, then rises back toward about 0 to 1 by 35. The 90 percent interval expands after about 10, with the upper dashed line around 5 to 6 near 15 to 20 and the lower dashed line around minus 5 to minus 6 near 15 to 20. Middle-left plot (Output). The x-axis has tick labels 0, 10, 20, 30, 40. The y-axis label is OUTPUT (percent). The median line starts near 0, declines to about minus 2 to minus 3 by about 10, rises to around 2 to 3 near 20, then declines to around minus 2 to minus 3 by 40. The experimental counterpart line falls to around minus 4 to minus 5 near 10 to 15, rises to around 3 to 4 near 20 to 25, then falls again toward about minus 4 by 40. The 90 percent interval is narrow early and wider after about 10, with upper values around 5 to 6 near 20 to 30 and lower values around minus 6 to minus 7 near 30 to 40. Middle-right plot (Output). The x-axis has tick labels 0, 5, 10, 15, 20, 25, 30, 35. The y-axis label is OUTPUT (percent), with visible tick labels including 10, 0 and minus 10. The median line declines from near 0 to about minus 6 to minus 8 by about 15, then rises toward about minus 2 to 0 by about 30 to 35. The experimental counterpart line drops more sharply to around minus 10 near 15 to 20, then rises toward about minus 2 to 0 by about 30 to 35. The experimental counterpart also shows a rise above 0 around 25 to 30, reaching about 2 to 3, then returning toward 0 by 35. The 90 percent interval widens after about 10, with the upper dashed line reaching around 6 to 8 near 25 to 35 and the lower dashed line reaching around minus 12 to minus 14 near 15 to 20. Bottom-left plot (Interest). The x-axis has tick labels 0, 10, 20, 30, 40. The y-axis label is INTEREST (percent). The median line starts near 0, drops to around minus 8 to minus 10 near 10, then rises to around 4 to 6 near 25 to 30 and ends near about 2 to 3 by 40. The experimental counterpart line drops below the median around 5 to 15, then rises to around 6 to 8 near 25 to 30 and declines toward about 3 to 4 by 40. The 90 percent interval is widest around 10 to 25, with the lower dashed line near about minus 12 to minus 14 and the upper dashed line near about 10 to 12. Bottom-right plot (Interest). The x-axis has tick labels 0, 5, 10, 15, 20, 25, 30, 35. The y-axis label is INTEREST (percent), with visible tick labels including 5, 0 and minus 5. The median line declines from near 0 to around minus 6 to minus 8 by about 15 to 20, then rises toward about minus 2 to 0 by about 30 to 35. The experimental counterpart line rises above 0 around 20 to 25, reaching about 4 to 6, then drops toward about 0 to minus 2 by 35. The 90 percent interval widens after about 10, with the upper dashed line reaching around 6 to 8 near 25 to 35 and the lower dashed line reaching around minus 10 to minus 12 near 15 to 20.
Inflation, output gap and interest rate under PLT-G in the HENK model

Fig 9 Long description
Eight multi-line graphs are arranged in two columns and four rows. The left column is labeled Subsession 1 and the right column is labeled Subsession 2. Each graph contains three series: a dashed line representing the 90 percent interval, a solid line representing the median and a solid line representing the median experimental counterpart. The four row labels on the vertical axis are Inflation (percent), Output (percent), Interest (percent) and Credibility (percent). Subsession 1 x-axis runs from 0 to 40 in increments of 10. Subsession 2 x-axis runs from 0 to 35 in increments of 5. Inflation (percent), Subsession 1: The y-axis ranges from approximately negative 5 to positive 5. The median and median experimental counterpart lines begin near 0, rise to a peak of approximately 5 near session 15, then decline back toward 0 by session 20 and remain near 0 through session 40. The 90 percent interval dashed lines widen around sessions 10 to 20 and narrow thereafter. Inflation (percent), Subsession 2: The y-axis ranges from approximately negative 5 to positive 5. A prominent spike occurs near session 5 reaching approximately 5, followed by a dip to approximately negative 2 near session 10. The median experimental counterpart line overshoots the median near the peak around session 5. Output (percent), Subsession 1: The y-axis ranges from approximately negative 5 to positive 5. The lines dip to a trough near negative 5 around session 10, recover toward 0 by session 20 and remain near 0 through session 40. The median experimental counterpart follows the median closely but shows a slightly deeper trough. Output (percent), Subsession 2: The y-axis ranges from approximately negative 5 to positive 5. A trough of approximately negative 5 occurs near session 10, with recovery toward 0 by session 20. The median experimental counterpart dips more sharply than the median near session 10. Interest (percent), Subsession 1: The y-axis ranges from approximately negative 5 to positive 10. The lines peak near 10 around session 10, decline toward 0 by session 20 and stabilize near 0 through session 40. The dashed 90 percent interval is widest near session 10. Interest (percent), Subsession 2: The y-axis ranges from approximately negative 5 to positive 10. A peak near 10 occurs around session 5, followed by a decline to near 0 by session 15. The median experimental counterpart rises more steeply and recovers faster than the median. Credibility (percent), Subsession 1: The y-axis ranges from 0 to 100. The lines begin near 100, drop sharply to approximately 50 near session 10, then gradually recover toward 100 by session 40. The median experimental counterpart drops slightly further than the median near session 10. Credibility (percent), Subsession 2: The y-axis ranges from 0 to 100. A sharp decline to approximately 50 occurs near session 10, followed by a recovery toward 100 by session 30. The median experimental counterpart shows a deeper initial drop compared to the median.
These cross-treatment differences are confirmed by statistical tests in Table 4. At least qualitatively, Table 4 replicates its counterpart Table 1. Before the shocks (top panel), IT and PLT-G regimes exhibit similar AAD-levels but the picture changes after the shocks (middle panel). PLT-G has the lowest inflation AAD and IT has the lowest output AAD, implying a quicker closure of the inflation gap under PLT-G, but at a higher stabilization cost in terms of output than under IT. Without guidance, PLT exhibits the largest AADs. Inflation differences are less pronounced than for output because the large oscillations under PLT emerge later in the simulations than in the experiment. Extrapolating the model for a few more periods reveals increasing volatility, consistent with the experiment (see Fig. A.5).
Cross-treatment comparisons in the simulations

Table 4 Long description
Cross-treatment simulation results report average absolute disagreement in percentage points for inflation and output, split into two subsamples, with pairwise p-values for IT versus PLT, IT versus PLT-G, and PLT versus PLT-G. In pre-shock inflation disagreement, PLT-G is lowest (0.13 and 0.10) versus IT (0.36 and 0.37) and PLT (0.27 and 0.31), with p-values below 0.01 for comparisons involving PLT-G and a smaller IT versus PLT difference (p-value 0.01 and 0.13). In pre-shock output disagreement, PLT is highest (1.55 and 1.12) while IT and PLT-G are lower (IT 0.70 and 0.58; PLT-G 0.79 and 0.57); IT versus PLT and PLT versus PLT-G are significant, while IT versus PLT-G is not significant in subsample 2 (p-value 0.74). Post-shock disagreement rises sharply for output under PLT (8.74 and 8.63) compared with IT (1.57 and 1.10) and PLT-G (1.88 and 3.60), and all pairwise differences are significant (p-values below 0.01). Post-shock inflation disagreement is similar for IT and PLT (around 1.45 to 1.74) but much lower for PLT-G (0.31 and 0.58), with non-significant IT versus PLT differences (p-values 0.55 and 0.95) and significant gaps versus PLT-G (below 0.01). For short-run forecast disagreement, inflation is again lowest under PLT-G (0.90 and 0.89) versus IT and PLT (about 1.62 to 1.64), while output is similar across treatments (about 8.00 to 8.21) with IT versus PLT-G not significant (p-values 0.45 and 0.40) but IT versus PLT and PLT versus PLT-G significant (below 0.01). Values in parentheses are dispersion measures, and p-values summarize differences across repeated simulations, so statistical significance does not by itself indicate practical importance.
Additionally, the model captures the cross-treatment dispersion in individual forecasts; see the bottom panel of Table 4 and its experimental counterpart in Table 2. The best coordination among inflation forecasts (i.e. the lowest dispersion) is obtained in Tr. PLT-G, which reflects subjects’ coordination on the CB’s guidance. Inflation and output forecasts are most heterogeneous under Tr. PLT, in the experiment and in the model.
We find that the HENK model replicates six experimental stylized facts and the cross-treatment differences without using the experimental data. The model is parsimonious because only the news process has to be specified, and the simulations are robust to variations in this specification since news are screened out via performance-based peer imitation before affecting the economy.
5.3. Discussion
Unraveling the expectation dynamics in the HENK model helps describe the mechanisms at play in the experiment. Persistent expectations are a known feature of these models (Bullard, Reference Bullard2025). Under IT, persistent inflation gaps arise from pessimistic deflationary (in Subsession 1) and inflationary (in Subsession 2) outlooks at the onset of the recessions. These outlooks quickly become contagious because inflation expectations are almost self-fulfilling per the Phillips curve (2). This mechanism generates long-lasting coordination on stable but off-target expectations, both in the experiment and in the model. In this respect, persistence is stronger in the model where agents imitate in each period, than in the experiment where non-imitation is also prominent; see, again, Fig. 6.
When expectations are unanchored, pressures from aggregate demand can alternatively return inflation on target. Due to the nominal rigidities in the NK economy (i.e. a small slope  $\kappa$ in Eq. (2)), a sufficiently large change in output is required to turn around inflation, which unfolds slowly since the IT-CB also responds to the output gap. Post-recession, the economy enters a “new normal,” where both inflation and interest rates settle on an off-target path. Consequently, neither HENK agents nor the subjects will coordinate on a different inflation expectation path unless actual inflation leads the way.
By contrast, the PLT-CB is more accommodating (in Subsession 1) or more restrictive (in Subsession 2) than under IT to close the price gap in face of shocks. This stronger reaction pressurizes prices and output up (or down) to escape the off-target region, which explains the deeper recession in Subsession 2 in Tr. PLT-G than in Tr. IT. This reaction also prompts agents to quickly discard off-target inflation forecasts and edge close to the inflation guidance. If initial credibility is sufficiently high, it persists because of self-fulfilling expectations and peer imitation, which limits the movements in inflation expectations caused by the shocks, and ensures a reinforcing loop between credibility and inflation stability. This loop is illustrated in the bottom panel of Fig. 9: while the average credibility briefly dips at the onset of the recessions, it largely recovers by the end of the subsessions.
Without guidance under PLT, expectations track recent inflation rather than reacting to the past price gap, which is key to forming history-dependent expectations. As a result, inflation plunges deeper following the deflationary shock in Subsession 1 and rises more following the cost-push shock in Subsession 2 than under PLT-G. These larger deviations accumulate in the price gap which delays policy normalization compared to IT. Hence, in Subsession 1, the ELB episode is longer than in the other treatments, in an attempt to boost inflation to close the price gap but at the price of a large overheating of the economy. The resulting rising inflation and output expectations further feed the boom. The PLT-CB eventually raises rates to offset the positive output gap but with a long delay due to the persistent negative price gap inherited from the deflationary shock. By the time the PLT-CB reverses its policy (namely abandons its ELB policy in Subsession 1 or its high-rate policy in Subsession 2), the output gap is particularly large (positive in Subsession 1 and negative in Subsession 2), which prompts abrupt rate adjustments. These brutal adjustments, amplified by unanchored and contagious expectations, generate the large unsettling oscillations observed in both the experiment and the model.
6. Conclusion
The contribution of this paper is twofold. First, we empirically find supporting evidence for the merits of the history-dependent PLT policy – a monetary framework without historical experience so far – in stabilizing inflation and output gaps in face of both real and cost-push shocks. Second, we show how a parsimonious and micro-founded model of heterogeneous expectations replicates remarkably well the cross-regime differences observed in the lab and offers a behavioral description of these differences.
Admittedly, positive results in the lab may not warrant a successful empirical implementation. We rather take a ‘wind tunnel’ approach: the lab provides a first test of a policy within a highly controlled environment where internal validity allows the researchers to draw causal inference. Theories that have no explanatory power in the simple lab environment are unlikely to perform well in the (much) more complex real economies. In this respect, our results are encouraging for history-dependent policies and CB communication. We show how just one additional piece in the information set of the public may matter a great deal for expectation coordination. Importantly, our findings suggest that this benefit is robust to the type of shocks, i.e. the CB guidance coordinate expectations under both deflationary or inflationary pressures. Of course, ultimately, the decisions that agents make conditional on their expectations determine macroeconomic outcomes, not the expectations themselves. However, if agents fail to align their expectations with the monetary policy regime, one may question that their economic behaviors would.
More broadly, this paper shows the added value of combining lab evidence with a HENK model to analyze monetary policy. This framework is an interesting complement to the CB’s toolkit because it may easily be deployed to provide a first test of alternative communication contents and policy rules.
Supplementary material
The supplementary material for this article can be found at https://doi.org/10.1017/eec.2026.10058.
Replication package
The full replication package, including the experimental software and the raw data, is freely accessible on Mendeley data at https://data.mendeley.com/datasets/2xpjr3bycr/2 (DOI: 10.17632/2xpjr3bycr.2)
Acknowledgements
This project has been initiated within the context of the Fellowship Award of the Bank of Canada that Jasmina Arifovic received in 2020. Jasmina sadly passed away early 2022, before the completion of the present work. However, given this history, the two remaining co-authors opted for keeping her as a co-author but the views ultimately expressed in this paper may only be attributed to them. The study has received ethical approval from the SFU Office of Research Ethics numbered 30000994 and the FEB ethical committee at the University of Amsterdam under reference number EB-13597, and is registered under No. AEARCTR-0011128 on the AEA RCT Registry. Isabelle Salle acknowledges support from the Canada Research Chair program and the Research Priorities Area (RPA) ‘Complex Human Systems Lab’ from the Faculty of Economics and Business of the University of Amsterdam. The present work has benefited from fruitful discussions with Luba Petersen. We also thank the participants of the 56th Canadian Economics Association Conference in Ottawa on June 2022, the 1st PhD Conference on Expectations in Macroeconomics, held virtually by the Barcelona School of Economics on October 2022, the 8th Atlantic Canada Economics Association in Halifax on October 2022, the 15th Vietnam Economist Annual Meeting in Hanoi on November 2022, 1st CIREQ’s Interdisciplinary Conference on Big Data and Artificial Intelligence in Montreal on June 2023. None of the above are responsible for potential errors in the paper.
Funding statement
Open access funding provided by University of Amsterdam.






 Open access

