In the 2006 US mid-term congressional elections, Democrats picked up 31 seats in the House of Representatives en route to regaining control of Congress for the first time in 12 years. As The New York Times reported, “In their push to win back control of the House, Democrats have turned to conservative and moderate candidates who fit the profiles of their districts more closely than the profile of the national party” (Shaila and Kornblut Reference Dewan and Kornblut2006). This strategy is consistent with the logic of spatial competition formalized by Black (Reference Black1948) and Downs (Reference Downs1957) and further elaborated by other models that account for a wide range of influences on electoral competition.Footnote 1 While these models make predictions about the behavior of both candidates and voters, the most foundational prediction that emerges from spatial models of elections is that a candidate’s (or party’s) vote share increases in the degree of congruence between her platform and the median voter’s ideal point, holding fixed the location of the other candidate (or party).
This key prediction dominates discussions of elections in both scholarly and media accounts, as the opening example highlights, and existing research finds remarkably consistent support for this prediction across a range of political contexts and electoral systems. Parties regularly moderate their electoral platforms in attempts to appeal to the electoral middle (e.g., Erikson, MacKuen, Stimson Reference Erikson, MacKuen and Stimson2002; Adams et al. Reference Adams, Clark, Ezrow and Glasgow2004; Adams et al. Reference Adams, Clark, Ezrow and Glasgow2006; Somer-Topcu Reference Somer-Topcu2009), and this electorally induced moderation is often found to pay electoral dividends (e.g., Samuels Reference Samuels2004; Ezrow Reference Ezrow2005; Adams et al. Reference Adams, Clark, Ezrow and Glasgow2006).Footnote 2 In the US context, a sizable literature demonstrates that moderate candidates perform better in elections than more extreme candidates (e.g., Erikson Reference Erikson1971; Ansolabehere, Snyder and Stewart Reference Ansolabehere, Snyder and Stewart2001; Burden Reference Burden2004; but see also Stone and Simas Reference Stone and Simas2010; Hall and Snyder Reference Hall and Snyder2014), and voters punish incumbents whose legislative behavior is overly partisan or ideologically out-of-step with district preferences (e.g., Canes-Wrone, Brady and Cogan Reference Canes-Wrone, Brady and Cogan2002; Carson et al. Reference Carson, Koger, Lebo and Young2010; but see also Tausanovitch and Warshaw Reference Tausanovitch and Warshaw2014).
However, these findings are subject to unknown degrees of bias because they are based on cross-sectional research designs, which have difficulty confronting two key challenges. First, incumbents often cultivate personal constituencies (or similarly, accumulate high levels of valence) that are not accounted for in the standard spatial model, and these characteristics are difficult to observe and measure. Second, the characteristics of electoral districts vary along any number of dimensions that also affect election outcomes. The inability to account for these candidate- and district-specific factors in cross-sectional models likely results in overestimating the effects of candidate positioning on vote shares.
Failing to account for unobserved qualities of the incumbent will overestimate the effects of vote shares on election outcomes because of the strategic considerations used by (potential) challengers when deciding whether to enter the race and, upon entry, what platform to select. Incumbents with large personal constituencies and/or high valence are likely to deter potential challengers who could seriously challenge the incumbent’s re-election chances. In such cases, challengers are likely to be of lower quality and may choose platforms for considerations other than maximizing their potential vote shares. Incumbents with lower valence are likely to face higher quality challengers, who will also adopt more competitive platform positions and thus win larger vote shares compared with challengers in districts with high valence incumbents. The net impact will be to overestimate the effect of positioning on vote shares. Similarly, failing to adequately control for district characteristics that also affect election outcomes will inflate the effects of candidate positioning if the excluded district characteristics are also correlated with candidate platform choice and election outcomes.
In this paper, we make substantial progress in addressing these challenges and identifying the effect of spatial positioning on congressional election outcomes. Primarily, we rely upon a repeated-measures approach, in which we focus on challenger positioning in subsequent House elections waged against a common incumbent. Using candidate survey data from Project Vote Smart, we generate estimates of the platforms selected by challengers in a large number of US House elections between 1996 and 2006, and model the change in challenger vote share in successive elections as a function of the change in challenger platform location between the two elections. The estimates we obtain for the effects of candidate positioning on vote share, then, are net of any time-invariant characteristics of both incumbents and districts that may also influence congressional election outcomes.
Our findings are largely null. In contrast with existing literature, we find no evidence of electoral returns to moderation for challengers. This result is robust to a range of model specifications, the inclusion of district- and election-specific covariates, and subsets of candidates, and holds even for those races in which the spatial framework is likely to be most applicable. We also contrast the results from our repeated-measures approach with the estimates obtained in cross-sectional regressions that use the same data. The results shown in this paper are inconsistent with a core theoretical expectation in the modern literature on campaigns and elections. While we do not directly address why moderation is not associated with increased vote share, we conclude by discussing some plausible explanations for the findings and their implications for studies of electoral competition and representation.
Spatial Models of Elections
In Federalist No. 57 Madison argued that members’ electoral ambitions would lead them to behave in ways that reflected the views of their constituency. Spatial models of elections formalize the logic that Madison may have had in mind. In the basic two-candidate model of spatial competition, election-seeking candidates compete in a single round of elections; the candidates have observable positions on a one-dimensional ideological spectrum; and voters have single-peaked policy preferences with heterogenous ideal points, each of whom votes for the candidate whose platform is located closest to her ideal point.
These models generate three sets of expectations. First, voters are predicted to support the candidate whose policy views are most similar to their own.Footnote 3 Second, candidates should adopt platforms that converge upon the location of the median voter. However, empirical research finds little support for this expectation (e.g., Ansolabehere, Snyder and Stewart Reference Ansolabehere, Snyder and Stewart2001; Burden Reference Burden2004; Stone and Simas Reference Stone and Simas2010). The starkness of the convergence prediction and its contrast with the empirical evidence has long inspired formal models that generate divergence in equilibrium.Footnote 4 These models are more difficult to test, however, because the primitives are difficult to observe empirically and their comparative statics are more ambiguous (Peress Reference Peress2008).
The models noted above, however, generate a third, and much more general, class of empirical predictions related to expected vote share of candidates and their relative positions. For models of electoral competition between two candidates, the vote share of a particular candidate increases as she adopts a platform closer to the location of the median voter, holding fixed the position of the competing candidate. We investigate this foundational prediction from spatial models of electoral competition, which we term the moderation hypothesis.
Departing from the one-dimensional setting of the basic spatial models, Bernhardt and Ingberman (Reference Bernhard and Ingberman1985) and Groseclose (Reference Groseclose2001) introduce a valance advantage for one candidate and analyze the equilibrium effect of candidate positions. In such models, if the incumbent has a valance advantage (which seems likely both owing to selection and the benefits of office), then the vote share of challengers need not be increasing in their moderation. Faced with a choice between two equally moderate candidates, voters prefer to vote for the valanced advantaged incumbent. Thus, challengers who take more extreme positions will further differentiate themselves and increase their vote share. In such models, moderation is no longer strategically valuable for valance-disadvantaged candidates. In fact, moderation would lead to lower vote shares among valance-disadvantaged challengers.
However, the equilibrium predictions of these models are consistent with the moderation hypothesis. An incumbent with a large valance advantage will have a larger vote share and face a less moderate challenger than will an incumbent with a moderate valance advantage. Thus, the predicted relationship between challenger moderation and vote share in a model with valence is consistent with the moderation hypothesis.
There may, however, be circumstances in which candidate (or party) moderation does not yield electoral rewards. Departing from the static assumption, Van Weelden (Reference Van Weelden2013) considers a citizen candidate model with moral hazard in a repeated games setting. Voters may prefer more ideologically extreme candidates as they are better able to discipline them on the moral hazard dimension. Ideological candidates can be threatened with both a loss of office and a less-appealing policy implemented by their rival. To our knowledge, this is the only spatial model of electoral competition where all else equal voters prefer a more ideological candidate to a more moderate one. Consistent with this prediction, empirical research has found that voters penalize niche parties for moderating their platforms (e.g., Adams et al. Reference Adams, Clark, Ezrow and Glasgow2006), and tend to prefer extreme parties to moderate parties in new democracies (Ezrow, Tavits and Homola 2014b) and in democracies where partisan attachments are weak (Ezrow, Homola and Tavits Reference Ezrow, Homola and Tavits2014a).
Empirical Studies of Candidate Positioning and Election Outcomes
Candidate positioning has been attributed with a great deal of credit for the outcomes of congressional elections. Wright (Reference Wright1978) finds that one standard deviation in proximity advantage relative to their opponent increases a candidate’s vote share by about 5 percentage points, and Ansolabehere, Snyder and Stewart (Reference Ansolabehere, Snyder and Stewart2001) demonstrate that moderating their platforms by two standard deviations increased Democratic candidates’ vote shares in 1996 by about 3 percentage points. Burden presents similar results, and concludes that “[t]he locations of candidates have a direct bearing on election outcomes” (2004, 226). Across all of these studies, candidate moderation is found to exert a positive and statistically significant influence on candidates’ vote shares.
Other research that examines the relationship between legislators’ voting records and their subsequent electoral performance also suggest that candidate ideologies directly affect their electoral prospects. For instance, Canes-Wrone, Brady and Cogan (Reference Canes-Wrone, Brady and Cogan2002), Erikson (Reference Erikson1971), and Erikson and Wright (Reference Erikson and Wright1980) show that moderate legislators receive larger vote shares than more ideologically extreme legislators. While these papers demonstrate clear associations between legislative behavior and electoral accountability, the degree to which members of Congress could have increased their vote shares by accumulating more moderate voting records remains unclear. Spatial voting models, moreover, are based upon the candidates’ electoral platforms, and because it is unclear how well incumbents’ campaign platforms reflect the votes they have (or will) cast in Congress, the implications of these results for spatial models of elections are difficult to determine. Moreover, this approach also does not permit challengers to be included in the analysis. It is difficult, then, to use the results from these analyses as evidence in favor of the moderation hypothesis.
The results from both groups of studies, however, are based upon a common regression of the election outcome on some characterization of the candidates’ locations or the incumbents’ voting records. In many cases these studies use data culled from a single election year. This cross-sectional research design introduces serious challenges for causal identification. The estimates obtained in these studies are subject to unknown degrees of bias if systematic differences between candidates or districts are correlated both with candidate positioning and election outcomes. For instance, if high-quality challengers are more likely to target vulnerable incumbents (Jacobson Reference Jacobson1989; Cox and Katz Reference Cox and Katz1996), adopt more moderate platforms (Ansolabehere, Snyder and Stewart Reference Ansolabehere, Snyder and Stewart2001; Moon Reference Moon2004), and receive larger vote shares (Jacobson Reference Jacobson1989; Lublin Reference Lublin1994) compared with low-quality challengers, estimates from cross-sectional regressions are likely to overestimate the electoral rewards from moderation.
Empirical Strategy
Our empirical approach offers a substantial improvement over the existing studies noted above. First, we use surveys completed by candidates during their campaigns to characterize their electoral platforms. The surveys were administered by Project Vote Smart and contain large numbers of policy questions across nearly every salient policy domain, and thus reflect the campaign platforms that were presented to voters.Footnote 5 These survey data provide the best available estimates of candidate positions, and thus permit empirical tests that closely align with the theoretical models discussed above.
Most crucially, though, we use panel data and a repeated-measures design to overcome the challenges to causal identification that have not been adequately addressed by previous research. Our empirical approach examines challengers in successive House elections who run against a common incumbent. We model the change in the election outcome from election 1 to election 2 as a function of the change in the challengers’ platform locations. By evaluating whether challengers in successive elections are able to increase their vote shares against a common incumbent based upon the platforms they select, we are able to better identify the causal effect of candidate positioning net of most other election-, district-, and year-specific factors.
To facilitate this analysis, we make two non-trivial but, we think, relatively uncontroversial assumptions. First, we assume that Republican incumbents adopt campaign platforms that are more conservative than the preferences of the median voter in their districts, and that Democratic incumbents adopt campaign platforms that are more liberal than the preferences of the median voter in their districts. The empirical research cited above shows that candidates do not adopt convergent platforms (e.g., Ansolabehere, Snyder and Stewart Reference Ansolabehere, Snyder and Stewart2001; Burden Reference Burden2004), and increasing levels of ideological polarization among political elites suggests that Democratic candidates choose more liberal campaign platforms than their Republican opponents.Footnote 6
Second, we assume that the incumbent adopted the same platform in both races. Incumbents are rather well-known commodities, especially when compared with challengers, and are unlikely to deviate substantially from positions they have announced in previous electoral contests. Just as members of Congress are ideologically consistent across their careers (Poole Reference Poole2007), so too do incumbents have strong incentives to maintain consistent platforms across successive elections.Footnote 7 Challengers often exploit changes in the incumbents’ positions for electoral gains (Ansolabehere Reference Ansolabehere2006, 38), and Tomz and Van Houweling (Reference Tomz and Van Houweling2010) provide evidence that elected officials incur costs from “flip-flopping,” or modifying their previously stated positions. Comparing elections that occurred only two years apart further mitigates concerns about significant changes in incumbent platform positions.Footnote 8 Imposing this assumption eliminates the need to examine the platforms chosen by incumbents (who complete the Vote Smart surveys at lower rates than challengers) and allows us to evaluate whether challengers in election 2 are closer to or farther from the median voter than challengers in election 1 based solely upon the change in challenger platform positions. The primary independent variable of interest, then, is the level of challenger moderation, which is measured by the degree to which Democratic (Republican) challengers adopt more conservative (liberal) platforms in election 2 compared with election 1.
We further limit our sample to only those elections that fall on the same side of the redistricting cycle; thus, this eliminates comparisons between 2000 and 2002 races, as well as elections involving Georgia and North Carolina in the late 1990s, and Texas in the early 2000s. Elections in Louisiana are also excluded, as the majority runoff system used by that state is not easily explained by the standard two-candidate framework.
Data
Our analysis focusses on US House races from 1996 to 2006. We use candidate surveys administered by Project Vote Smart to characterize the electoral platforms candidates adopted in these races. Project Vote Smart is a not-for-profit, non-partisan organization that collects information about state and federal candidates during each election cycle, and distributes this information to voters and the media. The organization develops questionnaires with approximately 150 questions across a comprehensive range of policy areas, which must be completed before each state’s filing deadline. The surveys ask candidates whether or not they would support specific policy proposals if elected to office, and this format bears a close resemblance to roll call votes.Footnote 9 The breadth of the questions across policy areas and the consistency of the surveys across time further enhance the reliability of these data for characterizing and comparing candidate platforms during this time period.Footnote 10
Armed with the Vote Smart survey data, we estimated candidate locations using a Bayesian item–response model (Clinton, Jackman and Rivers Reference Clinton, Jackman and Rivers2004). Before we present the results of our repeated-measures analysis, we conducted several other analyses that we discuss in greater detail below, and thus we estimated platform locations for all major-party nominees for the House over this time period who completed the Vote Smart survey.Footnote 11 The ideal point estimation model assumes that candidates have some underlying level of ideology that they wish to convey to voters, and the answers to the survey questions contribute information about the candidates’ latent ideologies.Footnote 12 This specification assumes that candidates have quadratic utility functions and normally distributed errors. As is standard in the literature (e.g., Poole and Rosenthal Reference Poole and Rosenthal1997; Ansolabehere, Snyder and Stewart Reference Ansolabehere, Snyder and Stewart2001), we estimated a one-dimensional model in an unidentified state, using 100,000 iterations after discarding the first 50,000. We then post-processed the estimates such that negative scores (in spatial parlance, the “left”) indicate liberal platforms and positive estimates (the “right”) reflect conservative platforms and normalized them such that the estimates have mean 0 and unit variance.
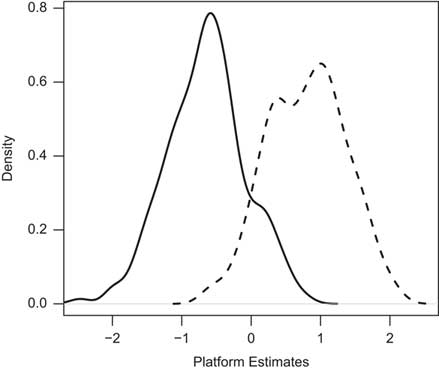
The results of the estimation are quite sensible. Figure 1 shows the distribution of campaign platforms for the 766 challengers included in the analyses below. Across the entire time period, Democratic challengers adopted more liberal platform locations (mean=−0.65, SD=0.57) than Republican challengers (mean=0.79, SD=0.57). Furthermore, though we focus primarily on challengers, the Democratic candidate adopted a more liberal platform than the Republican candidate in all but three of the 539 elections for which both major-party candidates completed the survey.Footnote 13
Distribution of challenger platform positions Note: The solid line shows the distribution of platform estimates for Democratic candidates, and the dashed line shows the distribution of estimates for Republican candidates.

Moreover, the Vote Smart survey data appear to meaningfully describe the ideological content of the campaign platforms candidates offer to voters. The challenger platform estimates are correlated reasonably highly with district preferences, as proxied by Republican presidential vote share (r=0.46). The Vote Smart estimates are also correlated strongly with estimates of ideology that are based on patterns of campaign donations (Bonica Reference Bonica2014).Footnote 14 Estimates of state legislative roll call behavior (Shor and McCarty Reference Shor and McCarty2011) also correlate well (r=0.78) with the Vote Smart campaign estimates for the 32 challengers who served in state legislatures subsequent to 1995.
Though our analyses below focus on the challengers shown in Figure 1 above, we also find that the Vote Smart data are strongly related to the congressional roll call records accumulated by the incumbents in these districts. The overall correlation between the Vote Smart platform estimates and DW-NOMINATE scores is 0.92; 0.84 among Democrats and 0.65 among Republicans.
Other recent research indicates that voters appear to be sensitive to estimates of campaign platforms obtained using Project Vote Smart data. Studying voter perceptions of challengers and incumbents using the 2006 Cooperative Congressional Election Study, Rogowski (2014) reports that the correlation between Vote Smart-based estimates and voter perception of candidate locations is 0.46 for Democratic candidates and 0.28 for Republican candidates. Shor and Rogowski (Reference Shor and Rogowski2013) use similar estimates from Project Vote Smart data to further show that voters appear to choose candidates on the basis of their platform locations. Finally, the platforms are estimated with a high degree of precision. Owing to the large number of candidates that completed the surveys, the candidates’ relative positions vis-à-vis one another can be accurately characterized, and the large number of survey questions enables us to further discriminate between candidates’ platform positions.Footnote 15
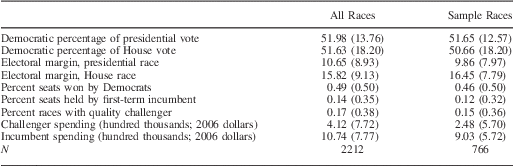
Challenger platform locations were estimated for 766 unique House elections, which represent about 35 percent of all contested House races that occurred over this time period. Table 1 compares the districts included in this sample to all contested House races over this time period. The districts included in the sample are generally representative of the population of contested districts. The districts included in the sample supported Democratic presidents at slightly lower rates, and Democratic House candidates at slightly higher rates, but these figures differ by <1 percentage point. These districts also are not disproportionately electorally uncompetitive; the margins of victory in presidential and House elections also differ by <1 percentage point. The districts included in the sample elected slightly fewer Democrats to the House, featured slightly fewer one-term incumbents, and slightly fewer quality challengers.Footnote 16 The principle differences concern campaign spending; both challengers and incumbents in the districts in our sample spent quite a bit less compared with the population of challengers and incumbents.Footnote 17 Note, however, that the discrepancies are rather equivalent for both challengers and incumbents, which suggests that it is not the case that the districts included in the sample are the subset of districts that pitted low-quality and underfunded challengers against well-established and firmly entrenched incumbents. Rather, the comparisons made elsewhere in the table suggest that the sample of districts included in this study are representative of the average level of competition in US House races, and the differences in spending levels may instead reflect a lower-profile sample of races in which campaigns are simply less expensive to run.
Sample Comparison

Note: Entries are sample means with standard deviations in parentheses.
Cross-Sectional Estimates
Our earlier discussion highlighted the limitations of cross-sectional research designs to estimate the effect of candidate positioning on election outcomes. Drawing from previous studies of the importance of candidate ideology (see, e.g., Canes-Wrone, Brady and Cogan Reference Canes-Wrone, Brady and Cogan2002, 130), the relationship between challenger positioning and vote share for candidate i in year t is typically modeled as the following:
 $$\eqalignno{ {\rm challenger}\,{\rm vote}\,{\rm share}_{{it}} & {\rm =} \,\beta _{{\rm 0}} {\rm {\plus}}\alpha _{t} {\rm {\plus}}\beta _{1} \,{\rm incumbent}\,{\rm extremity}_{{it}} \cr & \plus\beta _{2} \,{\rm district}\,{\rm presidential}\,{\rm vote}_{{it}} \cr & {\plus}\beta _{3} \,{\rm quality}\,{\rm challenger}_{{it}} \cr & {\plus}\beta _{4} \,{\rm (ln(challenger}\,{\rm spending}_{{it}} {\rm {\plus}1)} \cr & {\minus}{\rm ln(incumbent}\,{\rm spending}_{{it}} {\rm {\plus}1))} \cr & {\rm {\plus}}\beta _{5} \,{\rm first{\hbox -}term}\,{\rm incumbent}_{{it}} {\plus}\beta _{6} \,{\rm in{\hbox -}party}_{{it}} {\rm {\plus}}{\epsilon}_{{it}} {\rm ,} $$
where incumbent extremity measures the absolute value of the incumbent’s DW-NOMINATE score, district presidential vote is coded such that larger values indicate districts in which the challenger’s party won more votes in the most recent presidential election, quality challenger indicates whether the challenger had previously held elective office, first-term incumbent indicates whether the incumbent is serving her first term in office, and in-party indicates whether the challenger is a member of the party that currently held control of the House. Year fixed effects are described by values of α t . As our focus is on explaining how challengers fare against incumbents, we exclude the 39 open-seat elections from the analysis. Finally, we cluster the standard errors by congressional district to account for correlations in the error term within, but not across, districts.
The results from this model are informative for two reasons. First, we can compare the results from our sample of districts to the results from other studies that use larger samples and over longer time periods. If our results are consistent with those from other studies, we have further reason to believe that our sample of districts is broadly representative of the population of contested House elections. Second, and perhaps more importantly, the results from this model provide a baseline against which we can compare the results from our model of repeated elections, which we describe below. We are especially interested in comparing the inferences that one would make based on the results from the cross-sectional and repeated elections models.
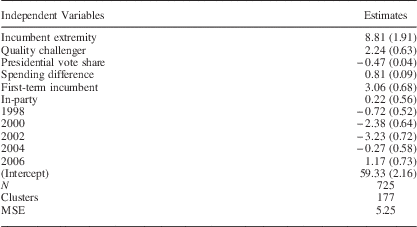
The results are shown in Table 2. The estimates from these regressions are highly consistent with the results found in previous studies. Challengers win larger vote shares when they run against more ideologically extreme incumbents. The results indicate that a one standard deviation increase in ideological extremity (approximately 0.16 units) is associated with an increase of between 1 and 2 percentage points of the vote for the challenger. In comparison, the Canes-Wrone, Brady and Cogan study examined all House incumbents from 1996 to 2006, and finds that a one standard deviation increase in roll call extremity was associated with a decrease of 1–3 percentage points for the incumbent (2002, 133).Footnote 18 Thus, we have good reason to believe that our sample of district elections is quite generalizable of the time period we investigate, and the results of the analyses that follow may in fact be broadly applicable to congressional elections that occurred across an even wider range of time. We now present a statistical model of election outcomes in repeated elections and discuss the results of our repeated-measures regression analysis.
The Effect of Incumbent Extremity on Challenger Vote Shares

Note: MSE, mean squared error. Entries are linear regression coefficients and standard errors (clustered by congressional district). The dependent variable is the challenger’s vote share (in percentage points).
Repeated Elections and the Impact of Candidate Positioning
As discussed above, unobserved candidate-, district-, and year-specific factors may bias the estimates obtained for the effects of candidate positioning on election outcomes using a cross-sectional framework. Here we assume that these factors remain constant in districts across the time periods being compared. By holding fixed these characteristics and the characteristics of the incumbent, we obtain consistent estimates of the impact of candidate positioning on election outcomes.
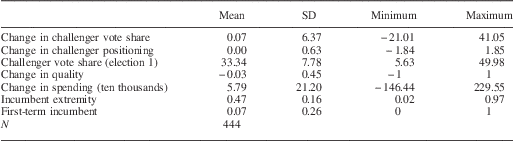
In some instances, challenger data were available for three consecutive races (e.g., 1996, 1998, and 2000, or 2002, 2004, and 2006), in which case comparisons can be made between the first and second elections, and the second and third elections. Using this strategy, we examine the impact of candidate positioning over 444 pairs of elections. The main dependent variable in our analysis is the change in percentage points in the challenger’s vote share between election 1 and election 2. This is calculated based upon the challenger’s share of the two-party vote and is expressed in percentage points. Positive values indicate that the challenger in election 2 increased her vote share relative to the challenger in election 1, and negative values indicate that the challenger in election 2 fared worse than the challenger in election 1. On average, there is a great electoral inertia between successive elections; challengers in the districts included in the sample increased their vote share by about one quarter of a percentage point, but there is a great deal of variation.
Two of the largest “vote gainers” in our data set were challengers who unseated well-entrenched incumbents. In 2006, Democrat Jason Altmire (PA-4) defeated Republican Melissa Hart, who had served since 2000, had never lost an election for any office, and was not considered to be electorally vulnerable. Altmire’s platform position (0.249) was considerably more conservative than Hart’s competitor in the 2004 election, Steven Drobac (−0.515), and Altmire’s conservatism was cited as the principal reason for his victory by the New York Times article referenced in the introductory paragraph. But the data tell a different story in the 2004 race in Illinois District 8, in which Democrat Melissa Bean defeated 17-term incumbent Phil Crane. In this election, which was a rematch of the 2002 race, Bean chose a platform that was a good deal more liberal (−0.831) than the one she chose in 2002 (−0.531), and increased her vote share by more than 9 percentage points, enough to send her to Washington.
Our key independent variable is challenger moderation between election 1 and election 2. To ensure that this variable has a consistent interpretation across both Democratic and Republican challengers, we calculated the values of this variable as the absolute value of the difference between the candidate’s platform estimate in election 2 and the estimate in election 1.Footnote 19 This quantity is then signed based on whether the challenger in election 2 adopted a more moderate or more extreme positive relative to the challenger in election 1. Positive values indicate that challengers in election 2 adopted platforms that more closely corresponded with the position of the incumbent than challengers in election 1, and negative values indicate that challengers in election 2 adopted platforms that were from the incumbent’s location. There is substantial variability in the extent to which challengers reposition themselves vis-à-vis the incumbent. Challengers in 230 (of the 444) districts adopted more moderate campaign positions in election 2 compared with election 1. In the remaining districts, challengers in election 2 adopted more ideologically extreme platforms relative to the challenger location in election 1.
The statistical model takes the form:
 $$\Delta {\rm challenger}\,{\rm share}_{{ijt}} =\beta _{0} {\plus}\alpha _{{jt}} {\plus}\beta _{1} \,{\rm challenger}\,{\rm moderation}_{{ijt}} {\plus} {\bf X}\psi _{{ijt}} {\plus}{\epsilon}_{{ijt}} ,$$
where i indexes districts; j indexes the party identification of the incumbent; t indexes election years; X is a matrix of covariates for changes in challenger quality (which takes value 1 if the candidate in election 2 was a quality challenger but the candidate in election 1 was not; −1 if the candidate in election 1 was a quality challenger but the candidate in election 2 was not; and 0 if there was no change in challenger quality), changes in challenger spending (measured in 2006 dollars), an indicator for whether election 1 was an open-seat contest, the challenger’s vote share in election 1 (to index district competitiveness), a measure of the incumbent’s ideological extremity (using DW-NOMINATE scores), and an indicator for whether the incumbent in election 2 was running for re-election for the first time; ψ ijt is the corresponding vector of coefficient estimates. Summary statistics for all of these variables are shown in Table 3. The parameter α jt accounts for party-year fixed effects and corrects for partisan tides and other year-specific attributes that may advantage candidates from a particular party. This specification ensures that the estimate of β 1 is identified by examining the relationship between challenger moderation and changes in vote share within other same-party challengers that are competing in the same set of successive elections. Finally, because some congressional districts are included for more than two elections, all standard errors are clustered by congressional district to account for within-district correlations in the error term.
Summary Statistics

If there are electoral benefits to moderation, we expect the coefficient estimate of β 1 to be positive. We also expect that, all else equal, changes in challenger quality increases challenger vote shares (e.g., Jacobson Reference Jacobson1989), and that challengers’ vote shares are highly correlated across time, producing a positive coefficient. Our expectations for the sign and magnitude of the coefficient estimate for changes in challenger spending are more ambiguous owing to conflicting evidence in the literature (e.g., Jacobson Reference Jacobson1989; Levitt Reference Levitt1994). The large literature on the incumbency advantage indicates that we should expect challengers to have a more difficult time increasing their vote shares when competing against a one-term incumbent such that the coefficient estimate should be negative. Finally, other literature summarized above suggests that challengers will receive larger increases in vote shares when they compete against more ideologically extreme incumbents.
Results
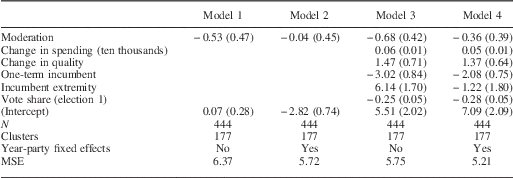
We begin by estimating a simple bivariate regression of challenger moderation on change in challenger vote share, the results of which are shown in the first column of Table 4. We estimated two versions of this model, one without year-party fixed effects and another that includes them. Contrary to our expectations, the coefficients for challenger moderation in both models are negative and statistically insignificant.
The Effect of Challenger Positioning on Vote Share

Note: MSE, mean squared error. Entries are linear regression coefficients and standard errors (clustered by congressional district). The dependent variable is the change in challenger vote share (in percentage points) between elections t and t+1, where positive values indicate that the challenger in election t+1 received a larger share of the vote than the challenger in election t.
Even after including the other covariates, we fail to find any support for the claim that challengers received increased vote shares as they adopt platforms that more closely resemble the incumbent’s position. The coefficient for challenger moderation is negative across all four models, and does not approach conventional levels of statistical significance in any of them. These results provide little evidence in favor of the moderation hypothesis.
We observe that the coefficient estimates for some of the other covariates, however, appear to be quite reasonable. Positive changes in spending and quality are associated with modest increases in vote shares. Challengers running against first-term incumbents receive smaller vote shares that the unsuccessful candidate in the previous election, which supports the incumbency effect. Moreover, it is increasingly difficult for challengers to increase their vote shares when the previous challenger fared well. Challengers following an extremely lopsided election outcome may indeed increase their vote share over the challenger’s share from the previous election, but it is more difficult for challengers to do so following an election in which the challenger received a larger portion of the vote share. In addition, the party-year fixed effects appear to accurately capture national trends and party tides; the fixed effects estimates are positive and statistically significant for districts in which Republicans in the first election in the data set were elected in 1998, 2002, and 2004. These positive estimates indicate that challengers fared much better against Republicans in the 2000, 2004, and 2006 elections. Nationally, in each of these cases Republican congressional candidates’ vote shares fell relative to their vote shares in the previous congressional election.
Our results are not sensitive to this particular repeated-measures specification. We replicated the cross-sectional analysis shown in Table 2 for incumbent positioning, and included measures of challenger ideological extremity. Consistent with the results shown in Table 4, the coefficients for challenger extremity are negative, but extremely small in magnitude and indistinguishable from 0.Footnote 20 Moreover, we do not find any evidence of partisan asymmetries, which also suggests that the results above are not induced by our construction of the challenger moderation measure.
We do not rule out the possibility, however, that there may be interactions between the key independent variable, challenger moderation, and the other covariates. For instance, adopting a more moderate platform position may only provide electoral rewards when challengers substantially increase the level of campaign spending because, perhaps, only then will constituents be aware of the more favorable set of policy positions advocated by the challenger. Changes in quality could also interact with moderation, such that moderation is electorally beneficial when accompanied by a positive change in challenger quality. Because other work has found that Republican members of Congress became more ideologically extreme than Democrats over this time period (e.g., McCarty, Poole and Rosenthal Reference McCarty, Poole and Rosenthal2006), the benefits to moderation may differ by the challenger’s partisanship. Other possibilities are that moderation is most successful when challengers compete against ideologically extreme incumbents, or in more competitive districts. None of these possibilities yielded fruitful results, with one exception. We found evidence of a modest interaction between challenger moderation and change in challenger quality. However, the results go against our primary expectation: increased challenger moderation appears to decrease challenger vote shares when combined with a positive change in quality. While our data do not allow us to examine this relationship in greater detail, we note that this finding is generally consistent with work by Stone and Simas (Reference Stone and Simas2010), which finds that quality challengers perform better in House elections when they select more extreme platforms, rather than more moderate platforms. In any case, however, this result casts further doubt on the empirical veracity of the moderation hypothesis.
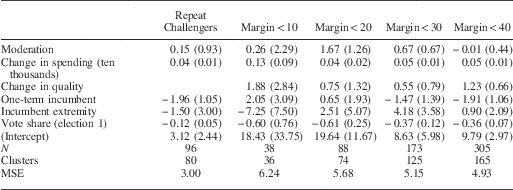
We conducted a second set of analyses to examine the impact of positioning in the districts in which we most expect to find evidence in favor of the moderation hypothesis. First, we estimated the full model shown in column 4 above only for those districts in which the same challenger faced off against the same incumbent in both elections, which characterizes 96 of the 444 observations. Should our measure of challenger quality be too coarse, or should we have failed to control for other unobservable characteristics of the challenger that bias the estimate for the effect of moderation, this subset of cases should provide the clearest test of the moderation hypothesis. Next, we examined the effects of challenger moderation for subsets of districts based upon the level of competitiveness in the first election. If the predictions of spatial models are most applicable to more competitive races, then we should expect to find evidence of increased vote shares owing to challenger moderation in those districts in which the outcome in election 1 was closest.Footnote 21 We examined the impact of moderation in districts at varying thresholds of competitiveness, and examined races that were previously decided by 10, 20, 30, and 40 percentage points, respectively.
The results of both sets of analyses are shown in Table 5. The results are broadly consistent with those shown above, and provides little evidence in favor of the moderation hypothesis. Among repeat challengers, the impact of changes in spending remain positive and significant, and the effects of running against a one-term incumbent and receiving a larger vote share in election 1 remain negative and significant. The impact of challenger moderation is now positive, but remains statistically insignificant. We note that these results provide the strongest check against the possible exclusion of unmeasured attributes of the candidates; here, even when the same challenger ran against the same incumbent in two successive elections, the results provide no evidence of electoral returns to moderation.Footnote 22
The Effect of Challenger Positioning on Vote Share

Note: MSE, mean squared error. Entries are linear regression coefficients and standard errors (clustered by congressional district). The dependent variable is the change in challenger vote share (in percentage points) between elections t and t+1, where positive values indicate that the challenger in election t+1 received a larger share of the vote than the challenger in election t. Year-party fixed effects were also estimated but are not shown.
This remains the case when we examine those districts in which the first election was decided by smaller margins of victory (and were thus more competitive). Though the signs and magnitudes of the control variables are generally consistent with what we showed in Table 4, the results still fail to provide any positive evidence in favor of the moderation hypothesis, even though these are precisely the types of races and districts in which we might expect spatial logics to be most important.
Does Challenger Moderation Negatively Effect Vote Shares?
Tables 4 and 5 above provide no evidence in support of the claim that challengers can fare better by selecting more moderate platforms. However, note that most of the coefficient estimates for challenger moderation shown in these tables are negative. If we were able to increase our sample size, and thus our statistical power, perhaps the standard errors would shrink, and these coefficients could be judged to be statistically significant against a null hypothesis of no effect. Should this be the case, our results would indicate that challenger moderation in fact reduces the challenger’s vote share.
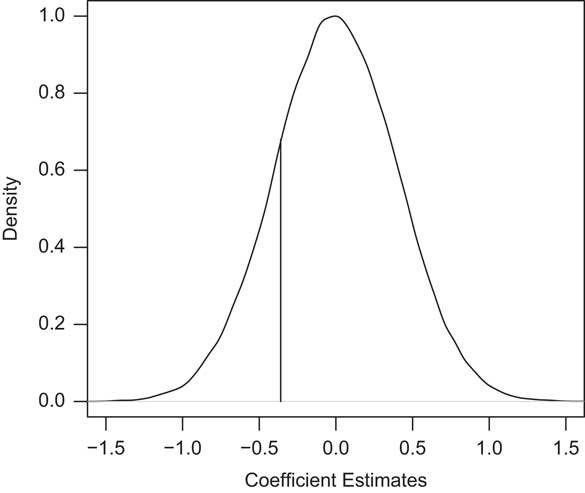
We use permutation inference to address these issues of statistical power by comparing our estimated coefficients to a distribution of coefficients that would result if the null were true (Fisher 1935; Hansen and Bowers 2009). In particular, we randomly shuffle the values of challenger moderation to each observation 100,000 times, each time re-estimating the regression model shown in the fourth column of Table 3, which we judge to be the most fully specified model we estimated. This procedure generated a distribution of estimated coefficients for challenger moderation when the values of this variable are assigned at random to each value of the dependent variable. We then compared the coefficient from column 4 of Table 3 with these simulated coefficients to determine where the coefficients fall in the distribution. If the coefficient shown in Table 3 is sufficiently infrequent with respect to the distribution of coefficients under uninformative values of moderation, then we can conclude that our test simply lacks sufficient statistical power to allow us to reject the null hypothesis of no effect. However, if the coefficient’s occurrence is not sufficiently rare, then we conclude that we can reject the alternative hypothesis that challenger moderation has a negative effect on challenger vote shares.
The permutation distribution from this procedure is shown in Figure 2. The mean of the distribution is −0.0001 (SD=0.40), in line with our expectation that the average coefficient should be 0 given that the values of moderation were randomly paired with the other variables. Importantly, of the 100,000 coefficients we estimated, 18,183 of them were ≤−0.36. The exact p-value associated with this estimated coefficient, then is 0.18138, which indicates that the coefficient we estimated using this model in Table 3 is not terribly surprising given the distribution of possible coefficients under the null hypothesis.Footnote 23
Testing statistical significance using a permutation distribution Note: The density curve plots the recovered coefficients of the effect of challenger moderation on vote shares when the independent variable is randomly shuffled 100,000 times. The vertical line shows the coefficient from the last model of Table 4.

The simulated coefficients support our earlier conclusion that challenger positioning has no effect on House election outcomes. We found virtually no evidence that challenger moderation has a positive effect on the challenger’s vote share, and the evidence that we found to suggest that there may in fact be a negative relationship is not distinguishable from the evidence that would result if the null hypothesis of no effect were true.
Accounting for Null Results
In this paper, we have demonstrated that the cross-sectional observation that moderate candidate positions are on average associated with increased vote share does not carry over to a panel setting where we use repeat challengers. Here we briefly discuss several possible explanations to reconciling these results.
A first potential explanation is the one that motivated the approach taken in the paper. Namely, unobserved qualities of incumbent candidates could be inducing scare-off and leading to challengers of both lower quality and more ideologically extreme leanings. The lack of observability of incumbent quality does directly raise the possibility that unobserved differences in challenger quality may be driving our null result. While we cannot formally reject this possibility with our date, we believe that a variety of indirect evidence presented suggests that this is not driving our findings. First, we find very little difference in the relationship between moderation and vote share based on whether we control for observed quality. Second, we find virtually no correlation between changes in quality and moderation in our data.Footnote 24 Thus, for unobserved quality of challengers to be driving our result, it would need to be negatively correlated with moderation and uncorrelated with our observed measure of quality. Moreover, we point out that we find null results even when focusing on those subsets of races in which observed and unobserved attributes of challenger quality are implicitly held constant, as column 1 of Table 5 shows results when examining those races in which the same challenger ran against the same incumbent in two successive elections.
As remains the case in many observational studies that rely upon estimates of latent quantities (here candidates’ platforms), measurement error has the potential to obscure the results. Most commonly, measurement error would attenuate the coefficient for the effect of challenger moderation toward 0, though Benoit, Laver and Mikhaylov (Reference Benoit, Laver and Mikhaylov2009) demonstrate how measurement error in estimates of party platforms can also lead to a number of other kinds of biased inferences. Our estimates of candidates’ platforms are based upon their responses to approximately 150 policy-based questions; as such challengers’ ideological locations can be estimated at least as precisely as they have been for candidates, legislators, and parties in many other settings. Moreover, attenuation bias would not seem to be a serious concern; most of the coefficients for the effect of candidate moderation are in fact negative, and even if these coefficient estimates were attenuated, correcting for this bias would not generate evidence in support of the moderation hypothesis. Finally, we estimated several errors-in-variables models (based on model 4 in Table 4) to correct for error in our measurement of challenger moderation, and the coefficient for challenger moderation remained negative and statistically insignificant. Thus, while we cannot definitively rule out the possibility that measurement error is responsible for our null findings, any error would have to be correlated with a particular distribution of the other independent variables for it to reverse the inferences provided by the results above.
Another possibility is that voters are not able to observe challenger positions, but are able to observe the position of incumbents. In addition, while we cannot directly test for this assumption, the fact that we still fail to find a relationship between moderation and vote share in close elections when the incentives for voters to learn about challengers are presumably highest is suggestive that voter ignorance is not the sole explanation. Adams et al. (Reference Adams, Engstrom, Joesten and Stone2014) raise another intriguing possibility; namely, that ideologically moderate voters are simply not as responsive as more ideologically extreme voters to changes in candidate positioning. To the extent that election outcomes turn on the vote choices of moderates, precisely those voters to whom challengers may moderate in an attempt to win over, then, ideological moderation by challengers may simply bear no fruit. Alternatively, while challengers may be able to more effectively communicate their platform positions to voters in mid-term election years than in presidential election years, when estimating models separately based on whether the repeated contests occurred in mid-term versus presidential years, we again find no evidence that more moderate electoral platforms increased challenger vote shares.Footnote 25 Nonetheless, modeling such one-side ignorance more formally is a fruitful area for additional research (see Câmara and Bernhardt Reference Câmara and Bernhardt2013 for one such approach).
Our results could also be explained by challengers’ reliance on party activists for electoral support. For instance, Schofield and Sened (Reference Schofild and Sened2005) consider the incentives of candidates to appeal to party activists with non-centrist positions. If the resources and activities of party activists play a large role in generating vote share, than moderation may alienate party activists who control crucial campaign resources, and thus lead to lower support for challengers.
Insights from cross-national studies of party positioning suggest some other possible reasons for the results found here. Adams et al. (Reference Adams, Clark, Ezrow and Glasgow2006, 524) conclude that while “mainstream parties reap modest electoral rewards from moderation,” the same does not apply to niche parties, which tend to be motivated by policy considerations, the cultivation of long-run (rather than short-run) support, and party activists. Thus, to the extent that some congressional candidates have other goals in mind than winning election, or otherwise depend upon support from their activist base, moderation may not be an ideal strategy. Alternatively, the payoffs to moderation may not be immediate. Adams and Somer-Topcu (Reference Adams and Somer-Topcu2009) show that changes in parties’ policies have a lagged effect (but no immediate effect) on election outcomes. While elections in the United States are frequently characterized as candidate centered, voters may not view a challenger’s shift as credible unless her party moderates as well, which may require a longer time horizon than a single election cycle.
Conclusion
The goal of this paper is to fill an important empirical gap in the seminal literature of campaigns, elections, and representation: to what extent can congressional candidates increase their vote shares by adopting platform positions that are more congruent with district interests? Based on the results show here, House elections do not appear to be won and lost on the basis of the campaign platforms that are adopted and articulated by the candidates. Using a unique set of data for challengers’ electoral positions and the strongest empirical strategy to date, we find no evidence of electoral rewards from candidate moderation. These results stand in stark contrast with existing work that finds that candidates win larger vote shares when they adopt more moderate campaign platforms. Our findings suggest that the results of previous work were owing to their reliance upon cross-sectional research designs and possible omitted variables.
The results reported in this paper highlight the enormous level of electoral inertia in congressional races. House incumbents have significant advantages in winning re-election, so much so that challengers are unlikely to wage more competitive campaigns simply by adopting a set of policy positions that more closely conform to district preferences. The results here support the notion of “leapfrog representation” (Bafumi and Herron Reference Bafumi and Herron2010), in which ideologically extreme members of Congress are replaced by other ideologically extreme challengers, rather than by more centrist legislators.
The results of the tests contained in this paper, however, should not be interpreted as a refutation of the relevance of spatial models for House elections. Instead, the empirical tests focused on a general feature of these models related to the effect of candidates’ tendencies toward convergence and election results. Other classes of spatial models, such as discounting and directional models, generate different predictions about the relationship between candidates’ platforms and expected vote shares because they are premised upon a different model of voter behavior. Depending on their specification, such models may more explicitly allow for the possibility that candidates can increase their vote shares by adopting more extreme platforms. In addition, multi-dimensional models of candidate competition—such as those that allow for candidate valence—may also generate a different set of predictions from the one examined in this paper.
The results shown here also raise the possibility that congressional elections are decided on the basis of considerations that are wholly separate from ideology. Examining local elections, Oliver (2012) argues that small-scale democracies are primarily managerial in character, and elections in such places are primarily referenda on the incumbents. Should this argument apply to congressional elections, we would expect citizens to evaluate incumbents based upon their ability to serve the needs of their districts. This is precisely what Miller and Stokes (Reference Miller and Stokes1963, 47) had in mind when they wrote that “many Congressmen keep their tenure of office secure by skillful provision of district benefits.” Berry, Burden and Howell (Reference Berry, Burden and Howell2010) provide some evidence on this score, in which they find that electorally vulnerable members secure more funds for their districts than members from safe districts. This suggests that members of Congress acknowledge the importance of such targeted benefits for their electoral fortunes, and devote as much effort to parochial projects as is necessary to secure re-election.
Additional theoretical and empirical work is needed to clarify the conditions under which elections maintain the links between citizen policy preferences and political institutions, and how they succeed in doing so. One potentially fruitful area for further study is to examine contextual variation in the importance of spatial factors for predicting election outcomes. For instance, it is unclear whether the findings presented here generalize to other contexts. US House elections are generally understood to be low-information environments, and it would not be unsurprising to find that candidate positioning plays a more significant role in higher information environments, such as state-wide, presidential, or parliamentary elections. A variety of models of elections explicitly incorporate information asymmetries or deficiencies, yet the basic spatial framework remains the principal technology of such models.
Moreover, party strength may play an important role in conditioning the impact of challenger positioning. In systems with relatively weak parties, such as the United States, challengers may simply be unable to effectively communicate their (newly moderate) position as clearly as parties can in stronger party systems. Consequently, parties in stronger party systems may be better able to affect their electoral success by adapting their electoral platform, while weaker party systems may feature a stronger pro-incumbent bias. It would also be interesting to know whether there are important differences in the ways ideological considerations affect elections for executives rather than for legislators, as executives (such as governors and mayors) are commonly thought to be custodians who administer laws rather than make them. Nevertheless, the findings presented here represent an important advancement in the study of elections and representation, and lay the groundwork for further inquiry into examining when elections induce legislators and parties to have “dependence on” and “sympathies with” the citizens who elected them.