INTRODUCTION
Limpets are one of the primary grazing gastropod molluscs inhabiting the UK intertidal region (Little & Kitching, Reference Little and Kitching1996). Their role in the ecology and dynamics of intertidal systems is still being addressed (Mrowicki et al., Reference Mrowicki, Maggs and O'Connor2014) but they are generally obvious and easy to study due to their size and largely sessile lifestyle. Most limpet species can be identified by an experienced shore ecologist, based on surface morphology and shore position. However, the limpet species Patella vulgata L., 1758 (PV) and Patella ulyssiponensis, Gmelin, 1791 (PU) are more difficult to distinguish based on superficial morphological examination.
Identification of PU and PV is commonly based on the colour of the foot and the tentacles fringing the mantle (Hayward & Ryland, Reference Hayward and Ryland1995; Fish & Fish, Reference Fish and Fish2011), although this can be awkward to examine in the field and there is an overlap in the range of colours found for each species. The internal colour of the shell can also be used to support identification but this is difficult to examine without killing the animal. Shell morphology is usually used as a key distinguishing feature but it is known to be highly variable depending on environmental conditions (Moore, Reference Moore1934). Shore location has also been used to provide an indication of species identity. PV inhabits a wide range of rocky shore environments, from exposed rock to sheltered pools, whereas PU reportedly dominates rock pool habitats, where populations are mixed (Delany et al., Reference Delany, Myers and McGrath1998). These assumptions of distribution patterns are highly unsatisfactory as a true indicator of species, and reliance on them can lead to instances of misidentification of Patella spp. (Moore & Howson, Reference Moore and Howson2012). Accurate separation of these species requires morphological examination of the pluricuspid teeth within the radula, under a microscope (Cabral, Reference Cabral2003), which is lethal to the animals as it requires dissection.
DNA barcoding is a powerful tool that enables the accurate identification of biological samples to species level by analysis of short genetic sequences (Hebert et al., Reference Hebert, Cywinska, Ball and DeWaard2003a). Regions of mitochondrial DNA such as COI are valuable as taxonomic markers because they have a relatively high inter-species mutation rate, but are well conserved within species. The most common DNA barcode used in eukaryotes is the cytochrome oxidase subunit 1 gene, COI (Hebert et al., Reference Hebert, Ratnasingham and DeWaard2003b; Hajibabaei et al., Reference Hajibabaei, Shokralla, Zhou, Singer and Baird2011), but other loci prove superior for certain taxonomic groups such as cnidaria (Moura et al., Reference Moura, Harris, Cunha and Rogers2007) or land plants (Hollingsworth et al., Reference Hollingsworth, Forrest, Spouge, Hajibabaei, Ratnasingham and Little2009).
Good quality DNA suitable for a variety of downstream applications such as genetic relatedness analysis and genotyping can be extracted by non-destructive means from fish mucus (Livia et al., Reference Livia, Antonella, Hovirag, Mauro and Panara2006; Le Vin et al., Reference Le Vin, Adam, Tedder, Arnold and Mable2011). This would appear to be a viable approach to sampling limpets and other molluscs, as gastropod mucus has been shown to contain abundant DNA derived from epithelial cells (Kawai et al., Reference Kawai, Shimizu, Hughes and Takenaka2004). The ability to generate accurate species identifications from a simple and non-destructive sampling procedure will potentially reduce the ecological harm of survey work, while greatly improving data quality.
METHODS
Assay design
Sequences of the cytochrome oxidase subunit 1 gene (COI) for each species were retrieved from the GenBank public database (accession numbers: PU, GQ469885; PV, EF462957). A 569 bp gapless alignment with 87.7% sequence homology was produced using Bioedit software. PCR primers and Taqman fluorescent labelled probes were designed using Primer3 software, with the aim of achieving maximum fidelity to the correct species by targeting the most divergent areas of the gene. Putative primer and probe sets were then tested for suitability for use in multiplex by screening for hybridization potential using NetPrimer software. All oligos were designed to have an annealing temperature of 60°C. The two hybridization oligos used were designed with different fluorescent label molecules at the 5′ end so they could be used in multiplex (Table 1) and an MGB non-fluorescent quencher molecule at the 3′ end. Primers and probes were synthesized as Taqman assays by Life Technologies.
Details of species-specific primers and fluorescent labelled probes.

Dye, fluorescent label molecule; Mismatch, number bases difference between intended species and the alternative.
Sample collection
In total, 200 unidentified field samples were collected from nine rocky shore locations in the vicinity of Sullom Voe oil terminal, Shetland, UK. Field sampling involved removing a live limpet from the rock, and using a cosmetic swab to remove a small amount of mucus from around the foot. The live animal was subsequently returned to the rock. The swab was placed inside a 1.5 ml microcentrifuge tube and the stick was cut so the tube could close. Tubes were labelled with location, date and a unique number and were stored at −20°C until analysis. The samples were collected across nine sites in Shetland during August 2013. Twenty-two samples that had been previously examined using microscopy and dissection were also obtained for use as positive controls. Species were determined according to the morphological features of the radula teeth described by Cabral (Reference Cabral2003). They consisted of 15 animals positively identified as P. ulyssiponensis and seven positively identified as P. vulgata.
PCR
A DNA template for PCR was prepared using a lysis and dilution method. A lysis solution was prepared, which consisted of 15% v/v of Chelex 100 resin, 200 µg ml−1 Proteinase K in deionized water. 1 ml of this solution was added directly to each of the tubes containing swabs. Samples were incubated at 55°C for 1 h and 95°C for 10 min. After being allowed to cool to RT, a 1 in 100 dilution was made of each sample in a well of a 96-well microplate.
Working stocks of each species-specific PCR assay were made (10×, 10 µM). Multiplex qPCR was performed in 10 µl reaction volumes consisting of 1 µl of each 10× assay, 5 µl Fast Advanced 2× PCR mastermix (Life Technologies), 1 µl H2O and 2 µl of diluted DNA template. Thermocycling conditions consisted of 10 min at 95°C followed by 40 cycles of 7 s at 95°C and 30 s at 60°C. Optical measurements of VIC and FAM fluorescence were made at the end of each 60°C step. ROX internal standard was used to control for any variation in optical measurement efficiency between wells.
Analysis
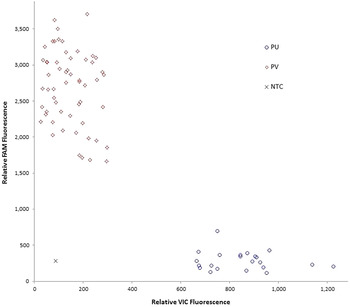
QPCR data were analysed using MxPro software. Baseline-correction of real-time fluorescence plots was performed using the adaptive baseline algorithm within MxPro. Scatter plots of the relative fluorescence associated with the two dyes, VIC (X axis) and FAM (Y axis), at cycle 40 were produced and cluster formation was used to discriminate the species.
RESULTS
The controls were assigned to the same species as the morphological examination in all cases. Fluorescence scatter-plots showed two clear clusters (Figure 1). Samples that did not fall within one of the visible clusters were deemed to be contaminated. Of the 200 experimental samples, two gave inconclusive results, i.e. the data points appeared between the two main clusters. This indicates amplification of both assays, which suggests DNA from both species was present in the sample. One sample failed to amplify. This could be due to degraded DNA due to storage, absence of DNA due to sampling error, or the presence of PCR inhibitors in the sample. Of the positively identified experimental samples, 61 were P. ulyssiponensis and 136 were P. vulgata.
Example of a two-colour scatter plot used to determine limpet species. The relative fluorescence of the dyes associated with each species is plotted, revealing two clear clusters. Diamonds, P. vulgata; circles, P. ulyssiponensis; cross, No Template Control.

DISCUSSION
The identification of taxa by analysing conserved regions of the mitochondrial genome, known as DNA barcoding, presents ecologists with a powerful set of taxonomic tools. It allows the collection of large and accurate data sets in otherwise challenging circumstances, such as when samples are incomplete, damaged or lacking key identifying features (Valentini et al., Reference Valentini, Pompanon and Taberlet2009). The analysis of DNA barcode sequence variation also offers the potential to distinguish species with high morphological similarity or at cryptic life stages such as many insect and marine larvae, and even allows the discovery of new cryptic species (Kress et al., Reference Kress, García-Robledo, Uriarte and Erickson2015).
The results from this relatively small study are encouraging as they suggest that the present assays are highly effective at distinguishing between two very closely related species of limpet. The high success rate of PCR amplification also suggests that a mucus swab is a practical method of obtaining DNA from living limpets in a field environment. The use of ethanol or DNA storage buffers was not necessary and neither was DNA extraction and purification, simplifying field collection and reducing costs respectively.
A small number of apparently contaminated samples are unsurprising given that sampling took place outdoors in a wet environment. Nonetheless, a 98.5% success rate in the first utilization of the method suggests that the protocol is sound and provides a practical method of accurately identifying these species. Furthermore this methodology is likely to become a valuable tool for ecological monitoring in a range of other taxa, providing a step-change in accuracy of difficult species identification tasks without resorting to destructive sampling.
The use of duplexed, short sequence, barcoding assays such as those presented here raises the exciting prospect of developing an environmental DNA (eDNA) assay with the capability of measuring relative abundance between the two species from a water sample. Currently, quantitative eDNA is challenging and remains the preserve of metabarcoding using next-generation sequencing (Thomas et al., Reference Thomas, Deagle, Eveson, Harsch and Trites2016). A simple duplex eDNA assay may provide a reliable, cost-effective means of monitoring relative abundance of ecologically important species over time.
ACKNOWLEDGEMENTS
Fieldwork was undertaken by Christine Howson, Aquatic Survey & Monitoring Ltd.
FINANCIAL SUPPORT
This study was funded by the The Sullom Voe Association/Shetland Oil Terminal Environmental Advisory Group (SOTEAG) and David M. Paterson received funding from the MASTS pooling initiative (The Marine Alliance for Science and Technology for Scotland) and their support is gratefully acknowledged. MASTS is funded by the Scottish Funding Council (grant reference HR09011) and contributing institutions. This report and the data herein are the property of the Sullom Voe Association (SVA) Ltd and its agent the Shetland Oil Terminal Environmental Advisory Group (SOTEAG) and are not to be cited without the written agreement of SOTEAG. SOTEAG/SVA Ltd will not be held liable for any losses incurred by any third party arising from their use of these data.