1. Introduction
Several unique features make monazite ((LREE)PO4) ideally suited for dating multiple events in rocks that evolve over a wide range of metamorphic and magmatic conditions. Foremost among these features is the high closure temperature (≥750–800 °C) for Pb diffusion (Zhu et al. Reference Zhu, O'Nions, Belshaw and Gibb1997; Zhu & O'Nions, Reference Zhu and O'Nions1999 a,b; Cherniak et al. Reference Cherniak, Watson, Grove and Harrison2004; Gardés et al. Reference Gardés, Jaoul, Montel, Seydoux-Guillame and Wirth2006) in monazite that helps preserve magmatic and high-T metamorphic events in rocks. Second, monazite readily grows by fluid-aided dissolution and reprecipitation over a large range of temperatures, including temperatures prevailing at diagenetic conditions (Schärer et al. Reference Schärer, de Parseval, Polve and de Saint Blanquat1999; Rasmussen, Fletcher & Sheppard, Reference Rasmussen, Fletcher and Sheppard2005; Rasmussen & Muhling, Reference Rasmussen and Muhling2007; Rekha, Bhattacharya & Viswanath, Reference Rekha, Bhattacharya and Viswanath2013), and therefore, monazite dating is a vital tool for constraining the age of low-T processes that may remain undetected by other dating techniques.
Radiometric dating of anorthosite is difficult because anorthosites lack minerals commonly used for age determinations, such as zircon, rutile and titanite. Zircon (ZrSiO4) is unlikely to crystallize in anorthosite owing to the limited solubility of Zr in calc-alkaline magma (Watson & Harrison, Reference Watson and Harrison1983), although zircon is known to occur as xenocrysts entrained following crustal assimilation by anorthosite parent magma (Bhattacharya et al. Reference Bhattacharya, Raith, Hoernes and Banerjee1998; Lackey, Hinke & Valley, Reference Lackey, Hinke and Valley2002; Nasipuri, Bhattacharya & Satyanarayanan, Reference Nasipuri, Bhattacharya and Satyanarayanan2011). On the other hand, rutile and titanite are lacking in anorthosite because with TiO2 being a plagioclase-incompatible element, titanium saturation is rarely reached in anorthosite, although anorthosite residual melts are known to be enriched in TiO2 (Bhattacharya et al. Reference Bhattacharya, Raith, Hoernes and Banerjee1998 and references therein). Monazites are also rare in anorthosite (Parrish, Reference Parrish1990). Chatterjee et al. (Reference Chatterjee, Crowley, Mukherjee and Das2008) reported Neoproterozoic/Pan African monazites in a noritic anorthosite in Patharkata in the Balugaon anorthosite massif (Chilka Lake area; Fig. 1). In this study, we present the results of in situ chemical age determinations (Suzuki & Adachi, Reference Suzuki and Adachi1991a ,b; Montel et al. Reference Montel, Foret, Veschambre, Nicollet and Provost1996; Williams et al. Reference Williams, Jercinovic, Goncalves and Mahan2006; Spear, Pyle & Cherniak, Reference Spear, Pyle and Cherniak2009) in polychronous monazites hosted within a noritic anorthosite in the Koraput massif close to the western margin of the Grenvillian-age granulites of the Eastern Ghats Province (Dobmeier & Raith, Reference Dobmeier, Raith, Yoshida, Windley and Dasgupta2003) in the Eastern Ghats Granulite Belt (Fig. 1).
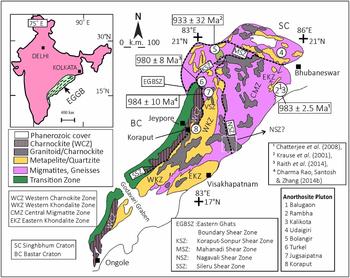
Lithodemic subdivisions of the Eastern Ghats Granulite Belt (EGGB; Ramakrishnan, Nanda & Augustine, Reference Ramakrishnan, Nanda and Augustine1998). The locations of anorthosite plutons are shown with filled circles, and the inferred emplacement ages are indicated in boxes (Leelanandam & Reddy, Reference Leelanandam and Reddy1988; Nanda & Panda, Reference Nanda and Panda1999). The references to the emplacement age are keyed as superscripts against the age data. Kalikot, Balugaon and Rambha are parts of the Chilka Lake anorthosite massif. Shear zones demarcating boundaries of ‘provinces’ are after Chetty & Murthy (Reference Chetty and Murthy1994).

2. Geological background
Ramakrishnan, Nanda & Augustine (Reference Ramakrishnan, Nanda and Augustine1998) sub-divided the Eastern Ghats Granulite Belt (EGGB) into four lithodemic units, e.g. the Western Charnockite Zone (WCZ), the Western Khondalite (garnet–sillimanite–K-feldspar–quartz) Zone (WKZ), the Central Migmatite Zone (CMZ) and the Eastern Khondalite Zone (EKZ) (Fig. 1). Rickers, Mezger & Raith (Reference Rickers, Mezger and Raith2001) sub-divided the EGGB into different isotopic domains. Integrating the Nd isotopic character with the deformation history and metamorphism, Dobmeier & Raith (Reference Dobmeier, Raith, Yoshida, Windley and Dasgupta2003) suggested the EGGB was a mosaic of accreted ‘domains’ and ‘provinces’ each having distinct tectonothermal histories. The youngest of the provinces, the Eastern Ghats Province (EGP), comprising isotopic Domains 2 and 3 of Rickers, Mezger & Raith (Reference Rickers, Mezger and Raith2001), is exposed in the north-central and south-central parts of the EGGB (Fig. 1).
The boundaries separating the provinces and the interface between the provinces at the EGGB margin and the Archaean cratons of Bastar in the west and Singhbhum in the north are delineated by regional-scale ductile shear zones (Chetty & Murthy, Reference Chetty and Murthy1994, Fig. 1). The NNE-trending Sileru Shear Zone (SSZ) (Dobmeier & Raith, Reference Dobmeier, Raith, Yoshida, Windley and Dasgupta2003) demarcates the boundary between the WKZ and the WCZ of Ramakrishnan, Nanda & Augustine (Reference Ramakrishnan, Nanda and Augustine1998). A series of alkaline plutons and anorthosite massifs (Fig. 1) occur in the neighbourhood of the SSZ (Dobmeier & Raith, Reference Dobmeier, Raith, Yoshida, Windley and Dasgupta2003).
The high-grade gneisses, barring those in the WCZ, experienced Grenvillian-age (Rickers, Mezger & Raith, Reference Rickers, Mezger and Raith2001) high-T counter-clockwise P–T paths (Bose et al. Reference Bose, Dunkley, Dasgupta, Das and Arima2011 and references therein; Korhonen et al. Reference Korhonen, Saw, Clark, Brown and Bhattacharya2011, Reference Korhonen, Clark, Brown, Bhattacharya and Taylor2013). The similarity in metamorphic conditions in the EGP granulites (Bose et al. Reference Bose, Dunkley, Dasgupta, Das and Arima2011) and the Rayner Complex, Eastern Antarctica (Harley, Fitzsimons & Zhao, Reference Harley, Fitzsimons, Zhao, Harley, Fitzsimons and Zhao2013) led several researchers to suggest the terrain boundary shear zone to be the zone of accretion between the Bastar craton vis-à-vis the cratonic nucleus of India and the EGP–Rayner Complex composite (Chetty & Murthy, Reference Chetty and Murthy1994; Gupta et al. Reference Gupta, Bhattacharya, Raith and Nanda2000; Dobmeier & Raith, Reference Dobmeier, Raith, Yoshida, Windley and Dasgupta2003; Bhattacharya et al. Reference Bhattacharya, Das, Bell, Bhattacharya, Chatterjee, Saha and Dutt2016). However, the time of accretion of the EGP with the craton is debated (Black et al. Reference Black, Harley, Sun and McCulloch1987; Shaw et al. Reference Shaw, Arima, Kagami, Fanning, Shiraishi and Motoyoshi1997; Mezger & Cosca, Reference Mezger and Cosca1999; Halpin et al. Reference Halpin, Gerakiteys, Clarke, Belusova and Griffin2005; Das et al. Reference Das, Nasipuri, Bhattacharya and Swaminathan2008; Harley, Fitzsimons & Zhao, Reference Harley, Fitzsimons, Zhao, Harley, Fitzsimons and Zhao2013). Based on the palaeogeographic reconstruction for India, Eastern Antarctica and Australia, Torsvik (2013) argued that the Bastar craton–EGP–Eastern Antarctica accretion to be Pan African in age. A Pan African accretion of the EGP with the Bastar craton during the final assembly of Gondwanaland has been suggested by Biswal, De Waele & Ahuja (Reference Biswal, De Waele and Ahuja2007) and Das et al. (Reference Das, Nasipuri, Bhattacharya and Swaminathan2008), more recently by Bhattacharya et al. (Reference Bhattacharya, Das, Bell, Bhattacharya, Chatterjee, Saha and Dutt2016) and subsequently by Chatterjee et al. (Reference Chatterjee, Das, Bose and Hidaka2017). Another phase of mid-Neoproterozoic (800–750 Ma) high-grade metamorphism is being increasingly recognized in the EGP granulites, albeit in localized zones in and neighbouring the Mahanadi Shear Zone (Veevers, Reference Veevers2007; Veevers & Saeed, Reference Veevers and Saeed2009; Bhattacharya et al. Reference Bhattacharya, Das, Bell, Bhattacharya, Chatterjee, Saha and Dutt2016) and near the Chilka Lake Complex (Bose et al. Reference Bose, Das, Torimoto, Arima and Dunkley2016) along the northern margin of the EGGB. This mid-Neoproterozoic (800–750 Ma) event is correlated with a phase of extensional tectonics related to the eventual break-up of Rodinia (Torsvik, Reference Torsvik2003).
In the Grenvillian-age EGP comprising the WKZ, CMZ and EKZ, massif anorthosites occur at Chilka Lake (Sarkar, Bhanumathi & Balasubrahmanyan, Reference Sarkar, Bhanumathi and Balasubrahmanyan1981; Bhattacharya, Sen & Acharyya, Reference Bhattacharya, Sen and Acharyya1994; Mukherjee, Jana & Das, Reference Mukherjee, Jana and Das1999; Krause et al. Reference Krause, Dobmier, Raith and Mezger2001; Dobmeier & Simmat, Reference Dobmeier and Simmat2002; Chatterjee et al. Reference Chatterjee, Crowley, Mukherjee and Das2008), Bolangir (Tak, Mitra & Chatterjee, Reference Tak, Mitra and Chatterjee1966; Tak, Reference Tak1971; Mukherjee, Bhattacharya & Chakravorty, Reference Mukherjee, Bhattacharya and Chakravorty1986; Raith, Bhattacharya & Hoernes, Reference Raith, Bhattacharya and Hoernes1997; Bhattacharya et al. Reference Bhattacharya, Raith, Hoernes and Banerjee1998; Mukherjee, Jana & Das, Reference Mukherjee, Jana and Das1999; Krause et al. Reference Krause, Dobmier, Raith and Mezger2001; Prasad et al. Reference Prasad, Bhattacharya, Raith and Bhadra2005; Nasipuri & Bhattacharya, Reference Nasipuri and Bhattacharya2007; Nasipuri, Bhattacharya & Satyanarayanan, Reference Nasipuri, Bhattacharya and Satyanarayanan2011; Nasipuri & Bhadra, Reference Nasipuri and Bhadra2013), Turkel (Maji, Bhattacharya & Raith, Reference Maji, Bhattacharya and Raith1997; Maji & Sarkar, Reference Maji and Sarkar2004; Raith et al. Reference Raith, Mahapatro, Upadhyay, Berndt, Mezger and Nanda2014; Dharma Rao, Santosh & Zhang, Reference Dharma Rao, Santosh and Zhang2014 a), Jugsaipatna (Mahapatro, Nanda & Tripathy, Reference Mahapatro, Nanda and Tripathy2010; Dharma Rao, Santosh & Zhang, Reference Dharma Rao, Santosh and Zhang2014 b), Koraput (Bose, Reference Bose1960, Reference Bose1979) and Udaigiri (Mahapatro et al. Reference Mahapatro, Tripathy, Nanda and Rath2013). The central parts of the plutons are dominated by anorthosite, whereas leuconorite and noritic anorthosite dominate the pluton margins. Pods of ultramafic cumulate and veins of high-alumina-gabbro are reported in the Bolangir pluton (Bhattacharya et al. Reference Bhattacharya, Raith, Hoernes and Banerjee1998) and the Koraput anorthosite complex (Bose, Reference Bose1960). The plutons are bordered by blastoporphyritic granitoids that are mangerite, charnockite and granite in composition. Fe-rich, Si-poor ferrodiorite (also referred to as ferrojotunite) enriched in plagioclase-incompatible high-field strength elements such as Zr, Ti, Th, P and rare earth elements (REEs) occurs as sheets and veins neighbouring or at the pluton–granitoid interface (Bose, Reference Bose1960; Maji, Bhattacharya & Raith, Reference Maji, Bhattacharya and Raith1997; Bhattacharya et al. Reference Bhattacharya, Raith, Hoernes and Banerjee1998; Chatterjee et al. Reference Chatterjee, Crowley, Mukherjee and Das2008; Nasipuri, Bhattacharya & Satyanarayanan, Reference Nasipuri, Bhattacharya and Satyanarayanan2011). Along the margin of the pluton, the low-K anorthosite–ferrodiorite and high-K mangerite–charnockite–granite suites are characterized by a prominent margin-parallel foliation defined by biotite and dynamically recrystallized orthopyroxene that weakens radially from the pluton margin (Nasipuri & Bhattacharya, Reference Nasipuri and Bhattacharya2007).
Barring the 1387 Ma age for the Chilka Lake pluton obtained using whole-rock 87Rb–87Sr in anorthosite and bordering granitoids (Sarkar, Bhanumathi & Balasubrahmanyan, Reference Sarkar, Bhanumathi and Balasubrahmanyan1981), more recent age determinations in the EGP anorthosites are based on U–Pb and Pb–Pb radiogenic isotope systematic and chemical U–Th–Pbtotal dating in zircons and monazites in high-K granitoids (bordering anorthosite plutons) that are assumed contemporaneous with the low-K anorthosite–leuconorite suite, and also in ferrodiorites deemed to be co-magmatic with the anorthosite suite (Bhattacharya et al. Reference Bhattacharya, Raith, Hoernes and Banerjee1998). Krause et al. (Reference Krause, Dobmier, Raith and Mezger2001) determined an age of 792 ± 2 Ma from U–Pb (zircon) in ferrodiorite in the Balugaon massif. Chatterjee et al. (Reference Chatterjee, Crowley, Mukherjee and Das2008) estimated the crystallization age (U–Pb zircon) in noritic anorthosite from the Balugaon pluton in the Chilka Lake Complex to be 983 ± 3 Ma; the U–Th–Pb chemical ages in monazites yielded two age populations at 714 ± 11 Ma and 655 ± 12 Ma. In the Bolangir pluton, U–Pb zircon isotope ratios in ferrodiorite are discordant, with a U–Pb upper intercept age at 933 ± 32 Ma, and a lower intercept age of 515 ± 20 Ma (Krause et al. Reference Krause, Dobmier, Raith and Mezger2001) coinciding with near-concordant U–Pb titanite in calc-silicate rocks at the pluton margin (Mezger & Cosca, Reference Mezger and Cosca1999). Based on U–Pb analysis of zircon from different magmatic units in the Turkel anorthosite complex, Raith et al. (Reference Raith, Mahapatro, Upadhyay, Berndt, Mezger and Nanda2014) suggested the leuconorite–anorthosite unit at Turkel was emplaced at 980 ± 8 Ma followed by the crystallization of quartz monzonite and ferrodiorite at 956 ± 6 Ma and 945 ± 5 Ma. Pb–Pb zircon ages in the Jugsaipatna anorthosite complex yielded crystallization ages between 918 ± 33 Ma and 928 ± 35 Ma for two leuconorite samples, 984 ± 10 Ma and 969 ± 12 Ma for gabbros bordering the pluton, and 996 ± 11 Ma, 964 ± 29 Ma and 957 ± 17 Ma for porphyritic granites (Dharma Rao, Santosh & Zhang, Reference Dharma Rao, Santosh and Zhang2014 b). The data suggest anorthosite magmatism and high-T metamorphism in the EGP was broadly contemporaneous.
3. The Koraput anorthosite pluton
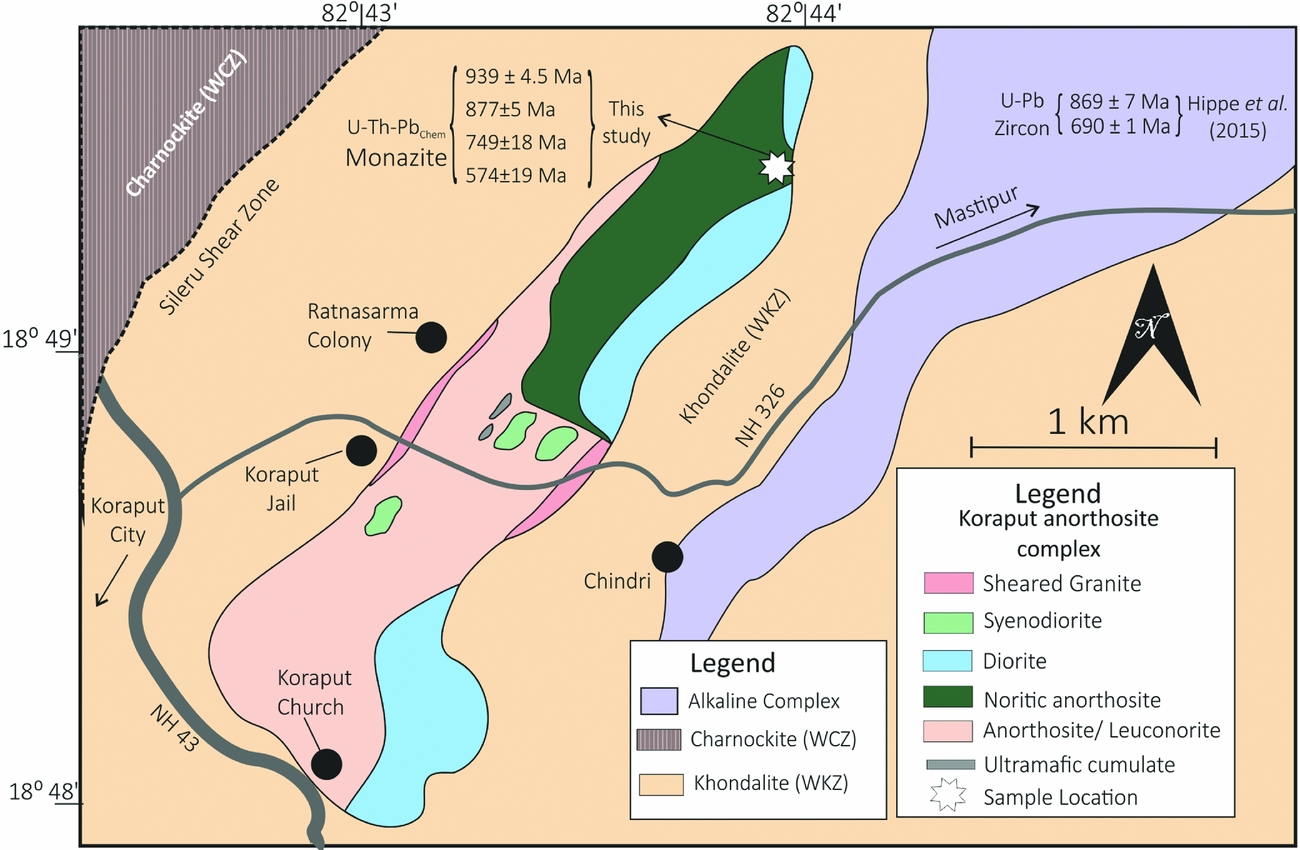
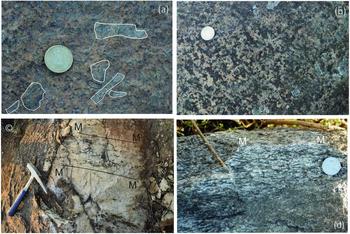
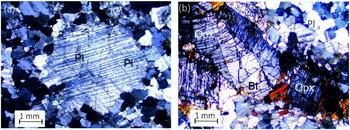
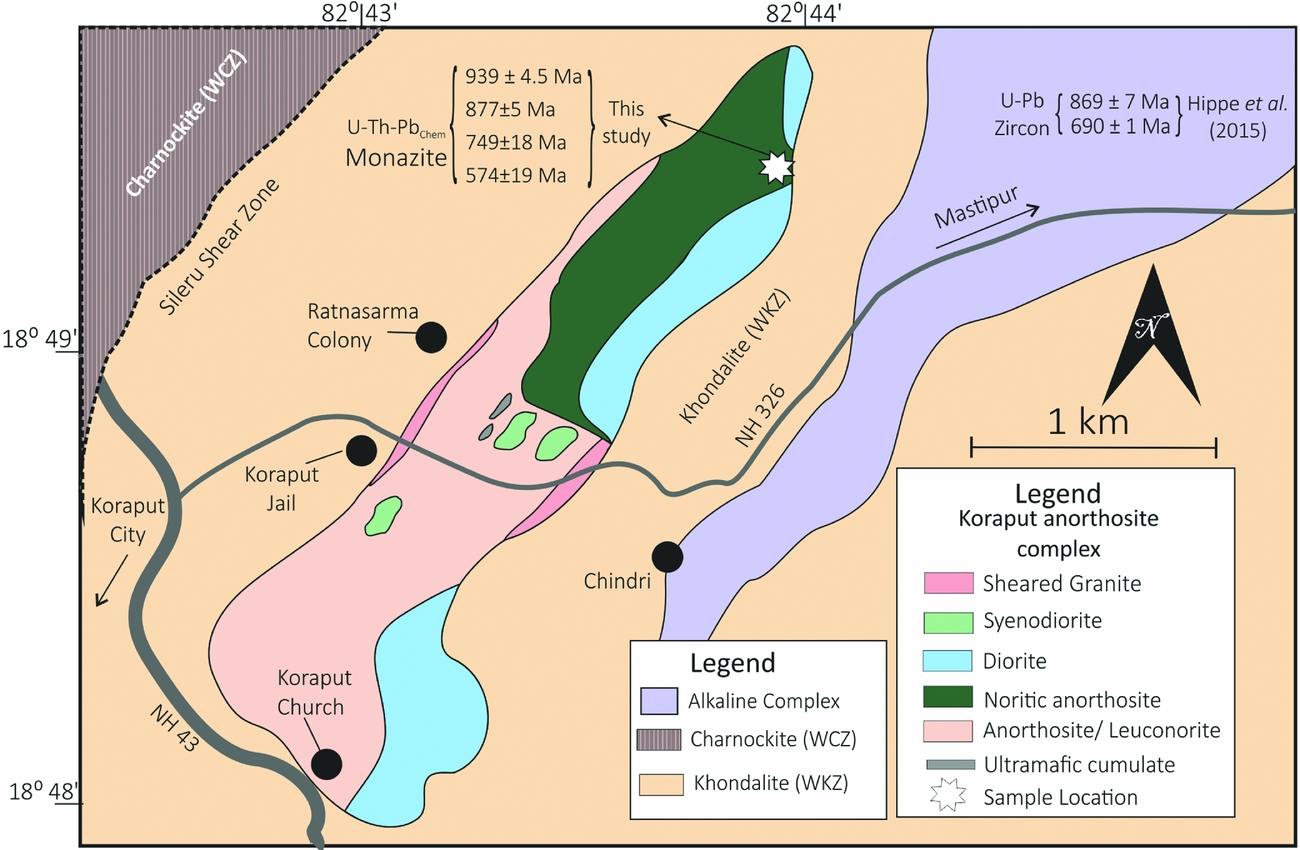
The NNE-trending anorthosite pluton at Koraput, Orissa (Bose, Reference Bose1960; Fig. 2) hosted within the WKZ (garnet-sillimanite gneisses) is the smallest (long axis is 3 km) among the anorthosite plutons in the EGP. Owing to extensive soil cover and human settlements, the pluton is now poorly exposed. An examination of scattered outcrops E/NE of Koraput suggests the complex is dominated by anorthosite sensu stricto, with noritic anorthosite, and diorite/ferrodiorite common along the eastern margin. The anorthosite/noritic anorthosite exhibits bimodal grain-size populations with anhedral grey-coloured magmatic plagioclase grains (up to 2 cm long) embedded in a sugary-white mosaic of finer-grained polygonized plagioclase (Fig. 3a). Both the magmatic and the polygonized plagioclases are andesine in composition (38–42 mol. % anorthite), and exhibit strain wavy extinction and cuspate-lobate grain boundaries (Fig. 4a). Dynamically recrystallized orthopyroxene grains typically 2–3 mm long display undulatory extinction and kink bands (Fig. 4b). Relics of magmatic plagioclase grains are fewer and smaller in the east, and intergranular textures, common in the west (Fig. 3b), are strongly deformed towards the east. The eastward increase in deformation strain is consistent with the development of an outward-dipping penetrative tectonic fabric mostly defined by biotite (Fig. 3c, d). The biotite aggregates partially replace dynamically recrystallized orthopyroxene (Fig. 4b), and also occur as discrete grains in the polygonized mosaic of plagioclase.
Geological map showing the Koraput anorthosite complex (modified after Bose, Reference Bose1960), the southern part of the Koraput alkaline complex (Hippe et al. Reference Hippe, Möller, Quadt, Peytcheva and Hammerschmidt2015) and the trace of the Sileru Shear Zone (Chetty & Murthy, Reference Chetty and Murthy1994). The location of the monazite-bearing sample within the Koraput anorthosite complex is marked by a filled star. Chronological information for the Koraput alkaline complex (Hippe et al. Reference Hippe, Möller, Quadt, Peytcheva and Hammerschmidt2015) and Koraput anorthosite complex (this study) are provided for comparison.
Field photographs of the Koraput anorthosite complex. (a) Bimodal grain size population among plagioclase in the Koraput anorthosite, e.g. relics of grey-coloured magmatic plagioclase (outlined by a white line) embedded in a finer-grained sugary mosaic of recrystallized plagioclase. (b) Lack of penetrative planar fabric in leuconorite in the pluton interior. (c, d) Biotite aggregates defining margin-parallel foliation (M–M′) in noritic anorthosite. Coin diameter is 2.3 cm. Length of hammer is 40 cm.

Microphotographs of (a) relics of igneous feldspar in a matrix of finer-grained aggregates of polygonized plagioclase showing undulatory extinction, and (b) undulose extinction and sub-grain formation in magmatic orthopyroxene grains (XMg = 0.50). Biotite is replacing orthopyroxene along the periphery in (b).

4. Mineral chemistry of monazite
Monazite grains were analysed using a CAMECA SX-100 Electron Probe Micro Analyser (EPMA) at the Department of Geology and Geophysics, Indian Institute of Technology Kharagpur, India. The analytical protocols and data reduction techniques are adopted from Prabhakar (Reference Prabhakar2013), and only a brief outline is provided here. During analysis, the accelerating voltage was 20 kV, beam current 150 nA, and beam size was 1.0 μm diameter. The following standards were used: galena for Pb, UO2 for U, ThO2 for Th, synthetic silica-aluminium glass containing 4 % REEs for La, Ce, Nd, Pr, Sm, Ho, Dy and Gd, and apatite for P and Ca; yttrium-aluminium garnet (YAG) was used for Y, corundum for Al, haematite for Fe and Th-glass for Si (silica). Counting time for Th (Mα), U (Mβ) and Pb (Mα) was set between 200 and 300 seconds, and 40–60 seconds for REEs. The spectral interferences of Th on U and Y on Pb were corrected using the inbuilt analytical software of the Cameca SX-100. The chemical composition of the spot analysis was translated to spot age by the expression following Montel et al. (Reference Montel, Foret, Veschambre, Nicollet and Provost1996):
 $$\begin{eqnarray}
Pb &=& \frac{{Th}}{{232}}[{e^{\lambda 232t}} - 1]208 + \frac{U}{{238}}0.9928[{e^{\lambda 238t}} - 1]206\nonumber\\
&&+ \frac{U}{{235}}0.0072[{e^{\lambda 235t}} - 1]207
\end{eqnarray}$$
The U, Th and Pb concentrations are in parts per million (ppm), t represents age in years and λ238 and λ235 are decay constants for Th 232 (4.95 × 10⁻¹¹ year −1), U 238 (1.55 × 10⁻¹⁰ year −1) and U 235 (9.85 × 10⁻¹⁰ year −1) (Steiger & Jäger, Reference Steiger and Jäger1977). The equation is solved iteratively to obtain the spot ages. The Moacyr monazite standard was analysed simultaneously to control the consistency of the spot analysis (Prabhakar, Reference Prabhakar2013).
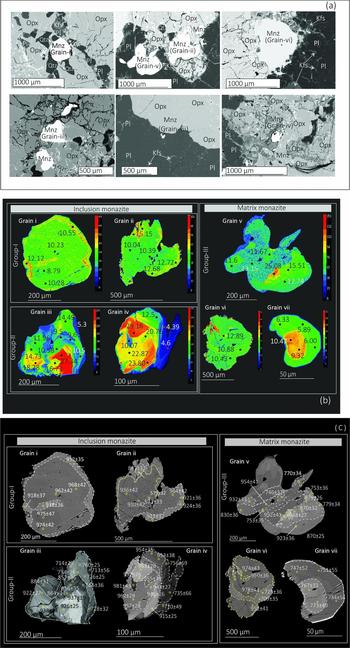
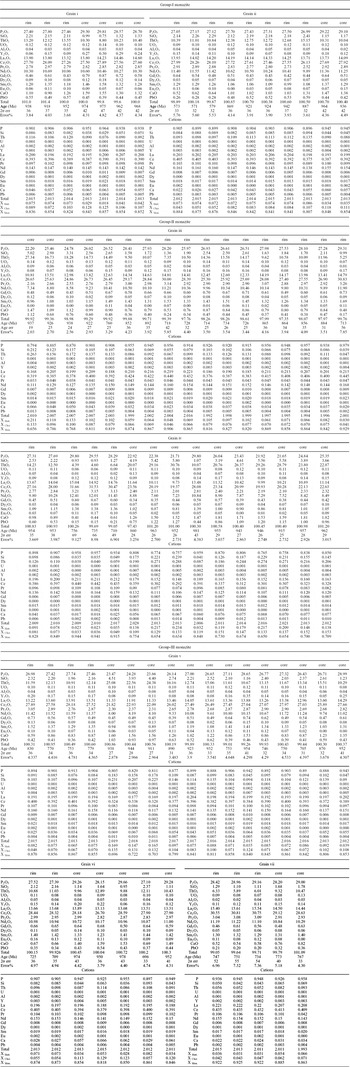
Monazite occurs as inclusions within dynamically recrystallized orthopyroxene and as discrete grains within the polygonized plagioclase matrix (Fig. 5a). ThO2 contents in the Koraput monazites vary between 4.4 and 30.8 wt % for all grains taken together (Fig. 5; Table 1). Based on the shades in the BSE (back-scattered electron) images, orthopyroxene-hosted monazite grains are divided into two broad groups (Fig. 5b, c). In group-I grains (diameter up to 500 μm), the ThO2-poor (8.79–10.28 wt %) dark core is mantled by a 10–20 μm wide ThO2-rich (9.71–14.28 wt %) bright rim (grains i, ii in Fig. 5b, c) resembling normal zones in concentrically zoned monazites (c.f. Zhu & O'Nions, Reference Zhu and O'Nions1999 b; Majka et al. Reference Majka, Be'eri-Shlevin, Gee, Ladenberger, Claesson, Konečný and Klonowska2012). The group-II grains (100–200 μm in diameter) are circular to elliptical in shape; these grains are chemically zoned, with ThO2-rich cores (16.73–29.16 wt %) laced by mantles having lower ThO2 contents (9.60–14.73 wt %), and outermost irregular rims having even lower ThO2 contents of 4.39–9.5 wt % (grains iii, iv in Fig. 5b, c). These variations taken together constitute reverse zonation in group-II monazites (Zhu & O'Nions, Reference Zhu and O'Nions1999 b). Although rare, some of the group-II grains exhibit small and embayed dark-shaded low-ThO2 domains (~10.07 wt %) within the high-ThO2 core (grain iv in Fig. 5b, c).
(a) BSE images showing textural settings of monazite-dated grains and (b) ThO2 X-ray element maps. The analysed ThO2 contents in weight per cent are shown for reference. (c) BSE images of monazite grains. Monazite spot ages are shown. In the monazite grains i and ii, the cores have low ThO2 contents, while the brighter margins have higher ThO2 contents. Monazite grains iii and iv with bright ThO2-rich cores are mantled by progressively ThO2-poorer mantles. Concentric zoning is preserved in the high-ThO2 core and in the intermediate-ThO2 mantle (grain iii). Monazite grains in the matrix exhibit patchy (v, vi) and concentric zoning (vii).

Electron probe microanalytical data, structural formulae (based on 4 oxygens per formula unit), spot ages and 2σ errors (in Ma), error % (= 100 (error)/(absolute age)) and mole fractions of La–Ce–Nd monazite, cheralite and huttonite end-members in monazites in the Koraput noritic anorthosite

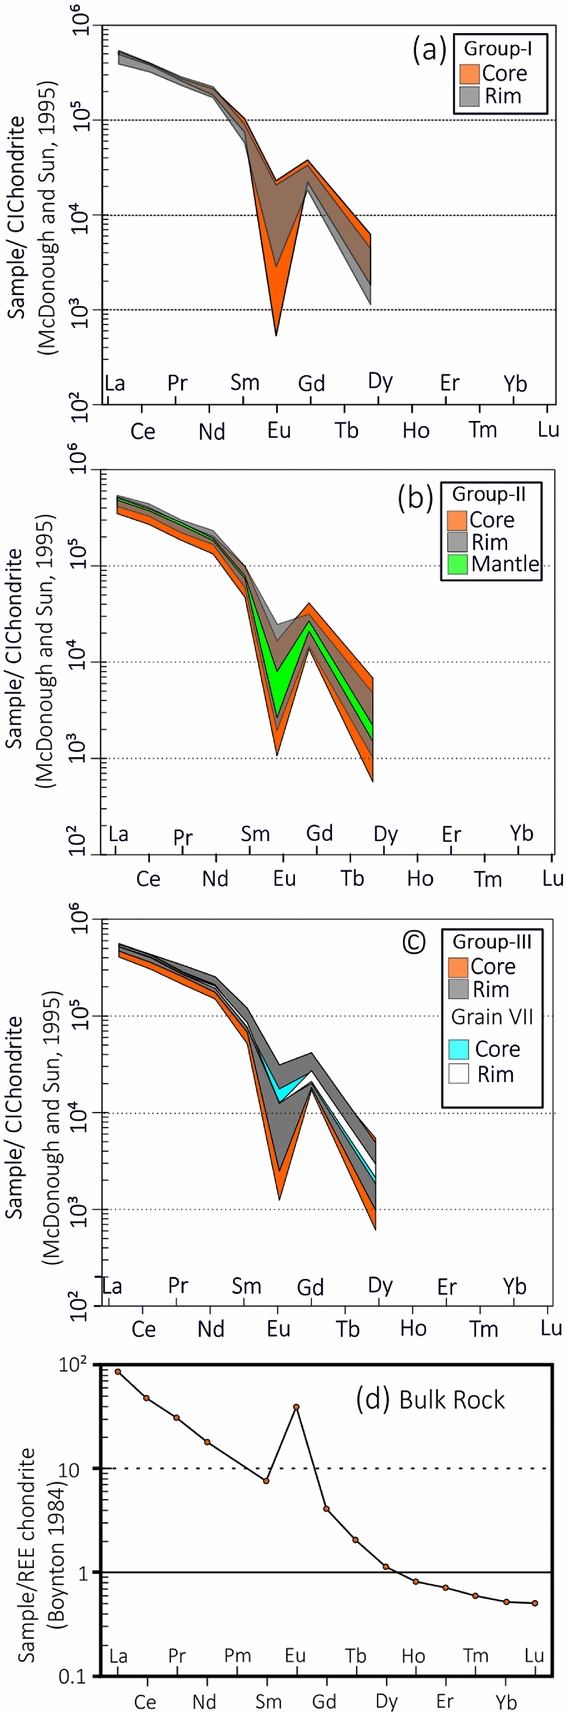
Monazites in the polygonized plagioclase matrix (group-III) are variable in size (50–500 μm diameter) and are characterized by patchy (grains v, vi in Fig. 5c) and reverse zoning (grain vii in Fig. 5c). In the monazites with patchy zoning, ThO2 content varies from 12–25 wt % in the brighter domains to 5–10 wt % in the relatively darker domain near the margin (grains v, vi in Fig. 5b). In the monazite grains with reverse zoning, ThO2 contents vary between 9 and 10 wt % in the central part and 5–6 wt % in the margins (grain vii in Fig. 5b), broadly overlapping with patchy zones in the group-III monazites. In CI-chondrite normalized (McDonough & Sun, Reference McDonough and Sun1995) plots, the REE contents in the monazites broadly overlap and exhibit pronounced negative Eu anomalies (Fig. 6a–c).
CI-chondrite (McDonough & Sun, Reference McDonough and Sun1995) normalized REE spider plots for (a) group-I, (b) group-II and (c) group-III monazites, and (d) the bulk rock of the monazite-bearing sample.

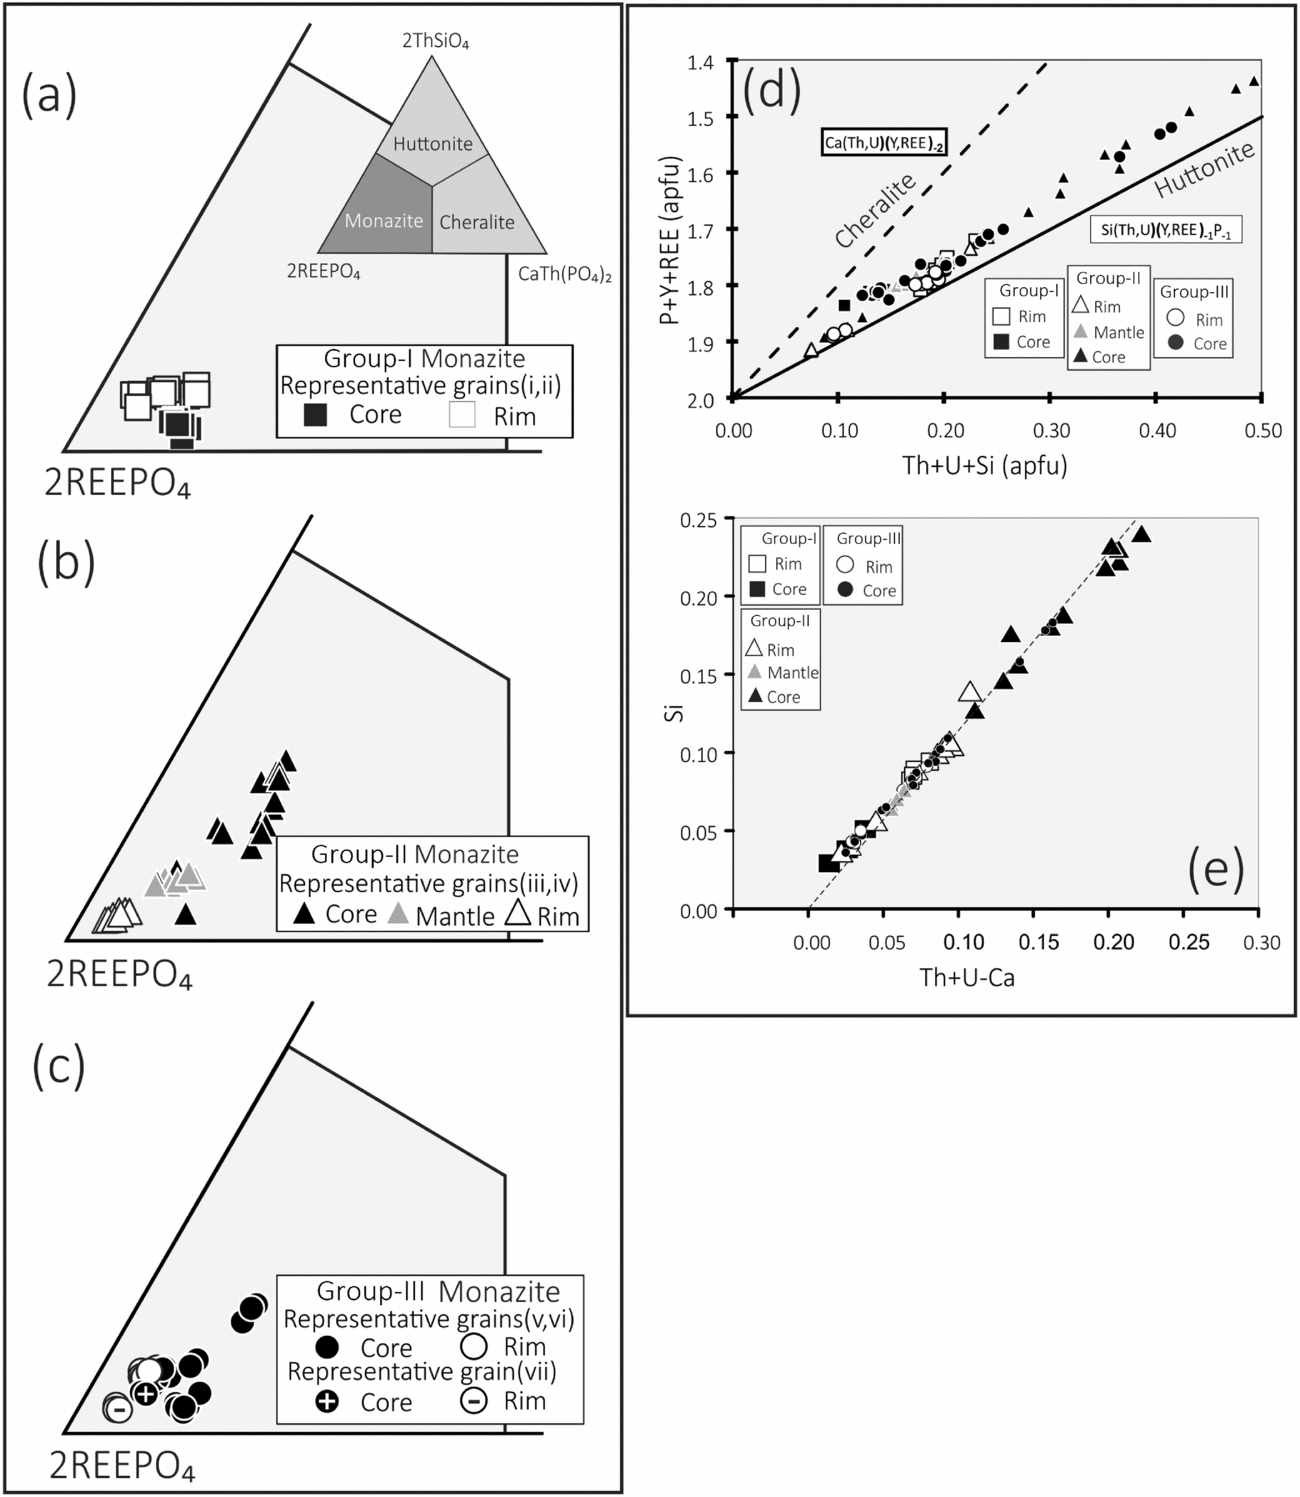
The compositional variations in monazites can be explained in terms of the following end-members: (a) La–Ce–Nd monazite (La, Ce, Nd)PO 4, (b) cheralite (2REE 3+ = Ca 2+ + Th 4+) and (c) huttonite (P 5+ + REE 3+ = Si 4+ + Th 4+). In ternary plots after Linthout (Reference Linthout2007), the chemical compositions of the core and rim of group-I monazites plot in the La–Ce–Nd monazite field where the ThO2-rich rims show relatively higher huttonite substitution compared to the cores of the group-I monazites (Fig. 7a). For the group-II monazites, most of the core compositions plot towards the huttonite (ThSiO4) end-member within the La–Ce–Nd monazite field and the chemical compositions of the mantle and marginal parts concentrate near the La–Ce–Nd monazite end-member (Fig. 7b). The chemical compositions of the matrix monazites showing patchy (grains v and vi in Fig. 5b) and Th-poorer zoning (grain vii in Fig. 5b) plot in the monazite field, varying from a huttonite-rich central part to a huttonite-poor marginal part (Fig. 7c).
Plot after Linthout (Reference Linthout2007) showing compositional variation in (a) group-I monazite, (b) group-II monazite and (c) group-III monazite. (d) (P + Y + REE) versus (Th + U + Si) and (e) Si versus (Th + U − Ca) plots of monazites.

The huttonite substitution in monazites could be explained in the plot of (P + Y + REE) versus (Th + U + Si) content where monazite compositions are clustered at higher (Th + U + Si) values than cheralite (Fig. 7d). Similarly, a plot of Si against (Th + U − Ca) also suggests that the chemical variations in monazite (Fig. 7e) are imparted by huttonite substitution, which usually occurs in high-temperature igneous rocks (Zhu & O'Nions, Reference Zhu and O'Nions1999 b; Broska, Petrík & Williams, Reference Broska, Petrík and Williams2000; Hoshino, Watanabe & Ishihara, Reference Hoshino, Watanabe and Ishihara2012).
5. Monazite chemical ages
Monazite with ThO2 content > 3.5 wt % was selected for geochronological studies to reduce the 2σ error in spot age calculation (Prabhakar, Reference Prabhakar2013). A total of 133 spot analyses in monazite yielded weighted mean ages between 939 ± 5 Ma and 574 ± 19 Ma (Fig. 8a). In the probability density plot (Ludwig, Reference Ludwig2012), the spot ages can be grouped into four populations. The mean value for the oldest age populations retrieved from group-I (grains i, ii), group-II (grains iii, iv) and group-III (grains v, vi) monazite cores is 939 ± 5 Ma. The chemical ages between 840 and 900 Ma (weighted mean 877 ± 5 Ma) are obtained in mantles surrounding the cores of group-II monazites and in patchy domains of group-III monazites (grains iii–v, vii in Fig. 5). The third set of younger ages (700–780 Ma) with a mean value at 749 ± 18 Ma are retrieved from chemical domains that occur as discontinuous rims with variable thickness surrounding the 877 ± 5 Ma mantle in group-II monazites and in outer patchy domains in group-III monazites (grains iii–v, vii in Fig. 5). The Early Cambrian/Late Neoproterozoic age cluster (mean value 574 ± 19 Ma) is obtained in chemical domains that occur along fractures and extremities in monazites (grain ii in Fig. 5b).
(a) Probability density plot of chemical ages in all monazites taken together (n = total number of spot ages). The values of unmixed ages from each population are also shown. A complete list of analyses from different domains of monazites is given in online Supplementary Material Table S1 and Figure S1 available at http://journals.cambridge.org/geo. (b) PbO versus ThO2* plot of the four age populations along with regressed isochron ages. (c) The weighted average age calculated using Isoplot for the three statistically different age groups.

The key to unmix polygenetic monazite ages obtained from EPMA depends on the chemical heterogeneity in texturally constrained monazite (Montel et al. Reference Montel, Foret, Veschambre, Nicollet and Provost1996; Williams, Jercinovic & Terry, Reference Williams, Jercinovic and Terry1999) as the chemical variations in a population of monazites have little influence on the calculation of average age based on the histogram method (Ludwig, Reference Ludwig2012). ThO2* (Suzuki & Adachi, Reference Suzuki and Adachi1991 a,b) against PbO is plotted to validate the selection of populations from the histogram distribution (Fig. 8b). In a closed system, if a homogeneous population of monazites contains the same amount of initial lead and a different amount of Th and U, the analytical data should define a straight line with the equation PbO = m*ThO 2 + c where m is the slope of the line and c is the initial concentration of non-radiogenic PbO (Suzuki & Kato, Reference Suzuki and Kato2008). Since the initial Pb content in the monazite is negligible (Parrish, Reference Parrish1990), the intercept of the best-fit line for a texturally constrained monazite group should be close to zero. The U–Th–Pbtotal chemical ages and associated MSWD were calculated using the CHIME program (Kato, Suzuki & Adachi, Reference Kato, Suzuki and Adachi1999).
In the PbO against ThO2* plot (Fig. 8b), the chemical compositions of the monazites in the Koraput anorthosite fall into four distinct age groups with regressed isochron ages of 938.6 ± 10.88 Ma (MSWD = 0.47), 875 ± 17 Ma (MSWD = 0.55), 732.54 ± 17.4Ma (MSWD = 0.59) and 585 ± 240 Ma (MSWD 0.046). The spot ages obtained from the core and rim in group-I monazites define the 938.6 ± 10.88 Ma isochron (MSWD = 0.47, Fig. 8bi). The chemical ages obtained from the core of group-II and group-III monazites also fall in the 938 ± 10 Ma isochron. Chemical ages obtained from the moderate ThO2-rich mantles in group-II monazites (grains iii, iv) and isolated patchy domains in the central and marginal parts of group-III monazites define the 875 ± 17 Ma (MSWD = 0.55) isochron (Fig. 8bii). Barring a single analysis obtained from the rim of a group-I monazite (883 ± 32 Ma, grain ii in Fig. 5c), spot ages ranging from 840–900 Ma (obtained from Fig. 5b) are absent in group-I monazites (Fig. 8bii). The 732.54 ± 17.4 Ma (MSWD = 0.59) isochron is defined by the chemical ages in the low-ThO2 rims of group-II monazites, from domains showing patchy zoning of group-III monazites (grains v, vi) and from ages obtained from the core and rim of reversely zoned monazites (Fig. 8biii). The 585 ± 240.72 Ma (MSWD = 0.046) isochron is defined by ages obtained near fractures from group-II monazites (Fig. 8biv). The four isochrons pass through the origin suggesting the presence of four distinct statistically separable groups of monazite ages. However, the isochron with an age value of 585 ± 240.72 Ma (MSWD = 0.046) and the corresponding dataset is excluded owing to large errors and a limited amount of data. The following weighted average ages (a) 939.9 ± 4.2 Ma (MSWD = 0.88), (b) 876.7 ± 4.9 Ma (MSWD = 1.17) and (c) 737.5 ± 5.3 Ma (MSWD = 1.18) calculated using Isoplot 3.75 (Ludwig, Reference Ludwig2012) are statistically separable and are in good agreement with the unmixed ages (Fig. 8a, c).
6. Discussion
The following features suggest that the ~ 930 Ma group-I monazites crystallized from melts: e.g. their occurrence within magmatic orthopyroxene (grains i–iv in Fig. 5a) and plagioclase grains (grains v–vii in Fig. 5a), sharp concentric chemical zones (Williams, Jercinovic & Hetherington, Reference Williams, Jercinovic and Hetherington2007), high-ThO2 contents (Schandl & Gorton, Reference Schandl and Gorton2004), a steady decrease in LREE (La) to MREE (Sm) contents, and a prominent negative Eu anomaly (Zhu & O'Nions, Reference Zhu and O'Nions1999 a). By analogy, the Early Neoproterozoic high-Th cores in group-II (grains iii, iv) and group-III monazites (grain v, vi), monazites hosted within magmatic orthopyroxene and plagioclase, respectively are also formed at similar supra-solidus conditions. Experimental data on Th partitioning in monazite–silicate melt equilibrium indicate that Th contents in monazites negatively correlate with crystallization temperature (Stepanov et al. Reference Stepanov, Herman, Rubatto and Rapp2012; Xing, Trail & Watson, Reference Xing, Trail and Watson2013) and positively correlate with increasing SiO2 contents in coexisting melt (Xing, Trail & Watson, Reference Xing, Trail and Watson2009). By implication, the group-I monazites with a low-ThO2 core and high-ThO2 rim may have crystallized from magma parental to the Koraput anorthosite complex. The group-II monazites with Th-rich cores mantled by concentric zones having successively lower Th contents may have crystallized from melts (Williams, Jercinovic & Hetherington, Reference Williams, Jercinovic and Hetherington2007) or precipitated from fluid reservoirs albeit under a different set of physio-chemical conditions compared to the group-I monazites.
A combination of the following possibilities may have led to the Th zoning observed in the younger rims in the group-II monazites hosted in magmatic grains. First, the emplacement of the neighbouring Koraput silica-undersaturated alkaline complex at 869 ± 7 Ma (Hippe et al. Reference Hippe, Möller, Quadt, Peytcheva and Hammerschmidt2015) may have acted as an additional heat source and/or may have led to a decrease in the Si contents via interaction with fluids, and this may have led to the precipitation of low-Th rims in group-II monazites. Second, the proximity of mineralogically altered zones in deformed pyroxenes and group-II monazites points to sub-solidus fluid activity that contributed to monazite growth. Several authors (Rasmussen & Muhling, Reference Rasmussen and Muhling2007; Hetherington, Harlov & Budzyń, Reference Hetherington, Harlov and Budzyń2010; Harlov & Hetherington, Reference Harlov and Hetherington2010) suggested that high-temperature (magmatic) monazites are usually unstable at a lower temperature and decompose to low-Th monazites by releasing Y, Th and U (Rasmussen & Muhling, Reference Rasmussen and Muhling2007). Thus, the low-ThO2 rims (4.3–5.3 wt %) with irregular outlines cross-cutting the concentric magmatic zones in group-II monazites (Fig. 5, grains iii, iv) probably suggest sub-solidus monazite growth. The patchy zoning in the matrix monazites (grains v, vi in Fig. 5b) points to chemical alteration due to magmatic fluids (Fitzsimons, Kinny & Harley, Reference Fitzsimons, Kinny and Harley1997) or hydrothermal alteration along fractures (Townsend et al. Reference Townsend, Miller, D'Andrea, Ayers, Harrison and Coath2000).
The oldest age population (mean 939 ± 5 Ma) in monazites hosted within dynamically recrystallized orthopyroxene and plagioclase correlates favourably with the emplacement ages of anorthosite plutons in the EGP at Chilka Lake (983 ± 2.5 Ma, Chatterjee et al. Reference Chatterjee, Crowley, Mukherjee and Das2008), Bolangir (933 ± 32 Ma, Krause et al. Reference Krause, Dobmier, Raith and Mezger2001), Turkel (980 ± 8 Ma, Raith et al. Reference Raith, Mahapatro, Upadhyay, Berndt, Mezger and Nanda2014) and Jugsaipatna (984 ± 10 Ma, Dharma Rao, Santosh & Zhang, Reference Dharma Rao, Santosh and Zhang2014 b). The emplacement age of the anorthosites (mean 939 ± 5 Ma) and the bordering granitoids (mangerite–charnockite–granite suites; Bhattacharya et al. Reference Bhattacharya, Raith, Hoernes and Banerjee1998) in the EGP coincides with the emplacement (980–960 Ma) of voluminous charnockite–enderbite plutons in isotopic Domain 2 (Paul et al. Reference Paul, Barman, McNaughton, Fletcher, Potts, Ramakrishnan and Augustine1990; Bose et al. Reference Bose, Dunkley, Dasgupta, Das and Arima2011) and the ultra-high-temperature (UHT) metamorphic event in the province (1000–900 Ma, Sengupta et al. Reference Sengupta, Dasgupta, Bhattacharya, Fukuoka, Chakraborti and Bhowmik1990) in the EGGB. The evidence, taken together, suggests a Grenvillian-age back-arc setting for the EGP granulites. The 877 ± 5 Ma chemical ages in the Th-rich cores in the group-II monazites coincide with a U–Pb zircon age (869 ± 11 Ma) retrieved from the silica-undersaturated Koraput alkaline complex (Hippe et al. Reference Hippe, Möller, Quadt, Peytcheva and Hammerschmidt2015) located close to the eastern margin of the anorthosite pluton (Fig. 2). Hippe et al. (Reference Hippe, Möller, Quadt, Peytcheva and Hammerschmidt2015) suggested the age corresponds with the emplacement of the nepheline syenite pluton related to the initiation of rifting in the EGGB leading to the break-up of Rodinia.
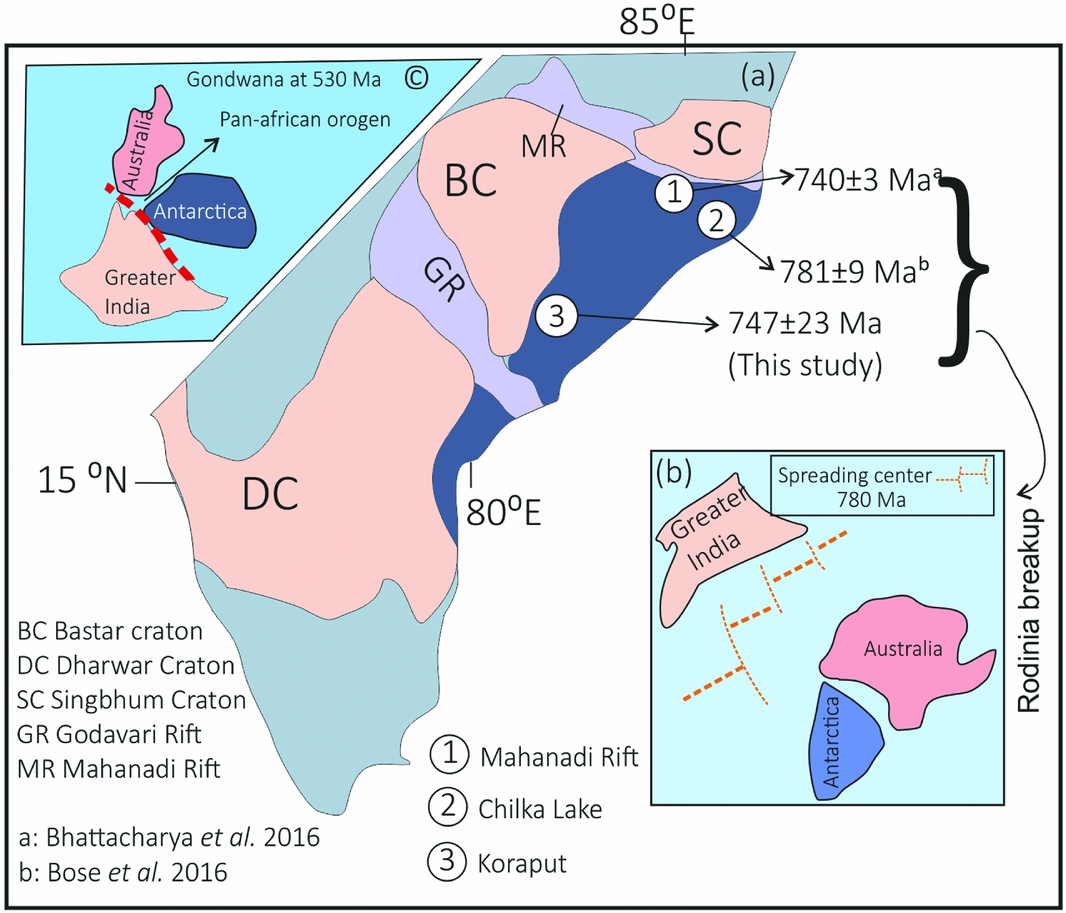
Recent age determinations along the Mahanadi Shear Zone (Bhattacharya et al. Reference Bhattacharya, Das, Bell, Bhattacharya, Chatterjee, Saha and Dutt2016 and references therein) and in the Chilka Lake Complex (Crowe et al. Reference Crowe, Nash, Harris, Leeming and Rankin2003; Bose et al. Reference Bose, Das, Torimoto, Arima and Dunkley2016) suggest that the northern margin of the EGP experienced a significant high-T (granulite facies) event in mid-Neoproterozoic time at ~750 Ma (Fig. 9a). This event was marked by extensional tectonism (Das et al. Reference Das, Bose, Karmakar and Chakraborty2012), as opposed to crustal shortening, and may correlate with the break-up of Rodinia (Fig. 9b; Torsvik, Reference Torsvik2003; Li et al. Reference Li, Bogdanova, Collins, Davidson, Waele, Ernst, Fitzsimons, Fuck, Gladkochub, Jacobs, Karlstrom, Lu, Natapov, Pease, Pisarevsky, Thrane and Vernikovsky2008). The 747 ± 23 Ma monazite age obtained from the Koraput leuconorite in this study suggests that the post-Grenvillian mid-Neoproterozoic rift-related tectonics leading to the disintegration of Rodinia may have extended along the western margin of the EGP granulites, and, by implication, this event is demonstrably more widespread than previously thought. The youngest, albeit small, population of monazite ages obtained in this study (573 ± 33 Ma) is similar to the Pan African dates retrieved from the Grenvillian-age EGP granulites and the cratonic rocks fringing the EGGB.
(a) Locations of mid-Neoproterozoic ages in the EGGB. Relative positions of India, Australia and Antarctica following Li et al. (Reference Li, Bogdanova, Collins, Davidson, Waele, Ernst, Fitzsimons, Fuck, Gladkochub, Jacobs, Karlstrom, Lu, Natapov, Pease, Pisarevsky, Thrane and Vernikovsky2008) at (b) 780 Ma and (c) 530 Ma.

The accretion of the EGP with the cratonic nucleus of India is poorly constrained, although recent work seems to suggest the accretion could have occurred late in the Pan African (Dobmeier et al. Reference Dobmeier, Lütke, Hammerschmidt and Mezger2006; Biswal, De Waele & Ahuja, Reference Biswal, De Waele and Ahuja2007; Das et al. Reference Das, Nasipuri, Bhattacharya and Swaminathan2008; Bhattacharya et al. Reference Bhattacharya, Das, Bell, Bhattacharya, Chatterjee, Saha and Dutt2016) during the final assembly of Gondwanaland (Fig. 9c; Torsvik, Reference Torsvik2003; Bhattacharya et al. Reference Bhattacharya, Das, Bell, Bhattacharya, Chatterjee, Saha and Dutt2016). The minor population of Pan African ages retrieved from the Koraput anorthosite possibly is a manifestation of this accretion event.
Acknowledgements
PN acknowledges financial support from the Science and Engineering Research Board through research project no. EMR/2014/000538. DS acknowledges the Director, IISER Bhopal for granting a fellowship for a doctoral dissertation. The authors acknowledge the detailed comments of Dr. Nilanjan Chatterjee and an anonymous reviewer; the comments went a long way in improving the content and styling of the manuscript. Editorial handling of the manuscript by Dr. Chad Deering is greatly appreciated.
Supplementary material
To view supplementary material for this article, please visit https://doi.org/10.1017/S001675681700084X