1. Introduction
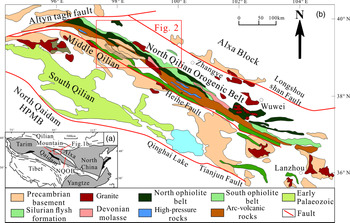
According to studies on the Precambrian blocks of the North China Craton (e.g. Li et al. Reference Li, Zhao, Santosh, Liu and Dai2011; Zhao et al. Reference Zhao, Cawood and Li2012), Yangtze Craton (e.g. Liu et al. Reference Liu, Lu, Wang, Huang, Xue and Wang2019) and Tarim Craton (e.g. Zhao et al. Reference Zhao, Sun, Yan and Diwu2015), the Columbia Supercontinent was basically formed at the end of the Palaeoproterozoic Era and gradually broke up during early Mesoproterozoic time (Rogers & Santosh Reference Rogers and Santosh2002, Reference Rogers and Santosh2009). The above three Precambrian blocks amalgamated with numerous smaller Precambrian blocks during Phanerozoic orogenies (Zhao et al. Reference Zhao, Cawood and Li2012; Zheng et al. Reference Zheng, Xiao and Zhao2013). The North Qilian Block (NQB) is one of these small Precambrian blocks and has been broken up into several crust fragments by multiple orogeneses since the Neoproterozoic Era. These continental crust fragments (i.e. NQB) are preserved in the North Qilian Orogenic Belt, which is a typical early Palaeozoic orogenic belt in China. The NQB mainly consists of the Palaeoproterozoic Beidahe Group (BDHG) and Mesoproterozoic Zhulongguan Group (ZLGG), and records the Proterozoic tectonomagmatic activities of the NQB (Fig. 1a). However, whether the Proterozoic tectonomagmatic activities are responses to the convergence–splitting evolution of the Columbia Supercontinent during the Proterozoic Eon has not yet been determined. This largely restricts the overall understanding of the evolution of the Chinese part of the Columbia Supercontinent.
(a) Tectonic framework of the Qilian block in NW China (after Song et al. Reference Song, Niu, Su and Xia2013); and (b) simplified geological map of the North Qilian Orogenic Belt showing the distributions of main tectonic units (modified after Wang et al. Reference Wang, Wu, Lei and Chen2018).

Previous studies on the North Qilian Orogenic Belt have mainly focused on the early Palaeozoic Era; limited studies on the tectonic evolution of the NQB during the Proterozoic Eon have been published. For example, the North Qilian Orogenic Belt is composed of ophiolites, high-pressure/low-temperature (HP/LT) metamorphic rocks, island-arc volcanic rocks, granitoids, flysch formations, molasse deposits and sedimentary cover, which record the evolutionary history of the North Qilian Ocean from seafloor spreading to oceanic subduction and closure (e.g. Song et al. Reference Song, Niu, Su and Xia2013). In addition to the above subduction-related components, there are many Precambrian continental crust fragments (i.e. the NQB) distributed in the North Qilian Orogenic Belt, including the BDHG and ZLGG. However, there is no consensus on the formation age and tectonic setting of BDHG and ZLGG. For instance, Wang et al. (2017b) suggested that the amphibolites from the BDHG in the Middle Qilian Block, which show back-arc basin basalts affinities with flat rare Earth element (REE) patterns but positive Rb, Ba and Sr, and negative Nb, Ta and Ti anomalies, have a crystallization age of c. 1.6 Ga. This age is younger than the island-arc basalt (IAB) -like amphibolites with a Palaeoproterozoic formation age of c. 1.7 Ga from the BDHG in the North Qilian Orogenic Belt (Liu, Reference Liu2019). Furthermore, one viewpoint is that that the BDHG was in an intracontinental rifting environment and developed bimodal volcanic rocks (Xu & Yue, Reference Xu and Yue1997; Zhang & Mao, Reference Zhang and Mao1998; Feng et al. Reference Feng, Wang, Zeng and Zhang2005). Some researchers have proposed that the BDHG formed in a continental-arc environment (Gao, Reference Gao2003; Fu et al. Reference Fu, Su, Hu and Wang2005). There are also different tectonic models for the ZLGG, for example, an intracontinental rifting setting, an ocean basin extensional setting and an active continental margin setting (e.g. Xu et al. Reference Xu, Yue and Liu1996; Mao et al. Reference Mao, Yang, Zhang, Song, Wu and Zuo1997; Xu & Yue Reference Xu and Yue1997; Zhang & Mao, Reference Zhang and Mao1998; Zuo et al. Reference Zuo, Liu and Zhang2000).
To constrain the tectonic evolution of the NQB, we conducted systematic petrological, whole-rock geochemical and Sr–Nd–Hf isotope analyses on the BDHG metabasalts and ZLGG basalts distributed in the western North Qilian Orogenic Belt. We investigated their petrogenesis and tectonic settings, and reconstructed the Proterozoic tectonomagmatic evolution of the NQB. Furthermore, we clarified whether the Proterozoic tectonic evolution of the NQB is related to the convergence and splitting of the Columbia Supercontinent.
2. Geological background, field and petrographic description
2.a. Geological background
The Qilian mountain system is part of the Qinling–Qilian–Kunlun Fold System (i.e. the Central China Orogenic Belt) and surrounded by the North China Craton to the east, the Tarim Craton to the NW and the Yangtze Craton to the SE (Fig. 1a). It is composed of four nearly NW–SE-trending sub-parallel tectonic units, including the North Qilian Orogenic Belt, whose Precambrian basement is referred to as (from north to south) the NQB, the Middle Qilian Block, the South Qilian Block and North Qaidam ultra-high-pressure metamorphic belt. The western and northern boundaries of the North Qilian Orogenic Belt are the sinistral strike-slip Altyn Tagh Fault and the Longshoushan Fault, respectively (Fig. 1b). The North Qilian Orogenic Belt is dominated by Palaeozoic rocks and is regarded as an early Palaeozoic oceanic suture zone that separates the Alxa Block to the north and Middle Qilian Block to the south (Fig. 1b). Previous research has mainly focused on the early Palaeozoic tectonic evolution of the North Qilian Orogenic Belt, as indicated by the lower Palaeozoic rocks related to subduction, collision and orogeny. The North Qilian Orogenic Belt was formed on the Precambrian continental crust remnants. These Precambrian continental crust remnants formed a hypothetical Precambrian block during the Proterozoic Eon that was then broken up and preserved in the North Qilian Orogenic Belt (Fig. 1b) due to the subduction–collision–orogeny events since the Neoproterozoic Era. The limited research on these Precambrian continental crust remnants hinders the understanding of the tectonic evolution of the NQB.
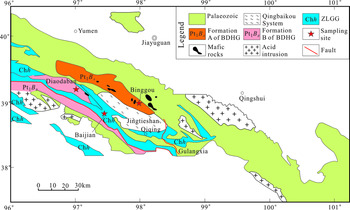
The NQB is mainly composed of Palaeoproterozoic BDHG and Mesoproterozoic ZLGG metamorphic–volcanic rocks that are unconformably overlain by a Palaeozoic succession. The Precambrian rocks consist of amphibolites, schist, marble, gneiss and conglomerates that are intercalated with minor volcanic rocks (e.g. Yang et al. Reference Yang, Zhang and Guo2016). The oldest Precambrian metamorphic basement is the BDHG, which is in fault contact with the ZLGG (Fig. 2). The BDHG formed during Palaeoproterozoic time (c. 1980–1613 Ma; Xu et al. Reference Xu, Yue and Liu1996; Mao, Reference Mao2003; Li et al. Reference Li, Lu, Xiang, Sun, Xiang, Geng and Zhou2007; Wang et al. 2017b; Liu, Reference Liu2019) and the ZLGG formed during Mesoproterozoic time (1555–1529 Ma; Yu, Reference Yu1997; Liu, Reference Liu2019).
Geological map of the western North Qilian Orogenic Belt, China (modified from Qi et al. Reference Qi, Chen and Hu2015).

2.b. Field observations
The study area is located in the Diaodaban, Binggou and Baijian areas of the western North Qilian Orogenic Belt (Fig. 2). The BDHG shows intense structural deformation and has developed fold structures with gneissosity and schistosity. The different metasedimentary strata show consistent attitude and there is no sharp change in lithology. Furthermore, the granularity of the metasedimentary strata becomes finer along the axis of the fold structures, indicating the conformable contact among these metasedimentary strata. The interbedded meta-igneous rocks show a similar attitude to the metasedimentary strata. The meta-igneous and metasedimentary strata are therefore in conformable contact, which, combined with the absence of xenoliths or cross-cutting relationships, suggests that the meta-igneous rocks were formed as volcanic rocks rather than intrusions.
According to the degree of metamorphism, the BDHG could be divided into two formations from north to south in the study area. Formation A is mainly composed of gneisses (metavolcanic rocks) and schists (metasedimentary rocks) with some clastic rocks and marbles, and has experienced amphibolite facies metamorphism. Formation A is distributed in the Binggou area in a NW–SE direction with a thickness of c. 1–4 km and a length of c. 70 km (Fig. 2), and the amphibole gneisses represent a unit with a thickness of c. 0.3–0.8 km and a length of c. 5 km. Formation B is also NW–SE-trending and mainly composed of different kinds of schists (metasedimentary rocks) with a small amount of plagioclase amphibolites (metavolcanic rocks) that have experienced amphibolite facies metamorphism. The schists are in conformable contact with the plagioclase amphibolites. The thickness and length of Formation B, which is distributed in the Diaodaban area, are c. 2–5 km and 120 km, respectively (Fig. 2), while the plagioclase amphibolites only show a thickness of c. 200 m and a length of c. 1.2 km. The decreasing in the cropping out of gneisses and the increase in the cropping out of schists from Formation A to B, combined with the mafic rocks metamorphosed into amphibole gneisses and plagioclase amphibolites within formations A and B, respectively, are indicative of the decrease in the degree of metamorphism from Formation A to B.
Ten amphibole gneisses and eight plagioclase amphibolites were collected from formations A and B in the Binggou and Diaodaban areas, respectively. The strata on both sides of contact between the BDHG and ZLGG show a sudden change of lithology of biotite schists to dolomites with an obvious relative displacement. The exposed surface of the dolomite has obvious scratches. Consequently, the ZLGG is in fault contact with the underlying BDHG (Fig. 2), indicating the absence of strata or change in sedimentary environment. The ZLGG mainly crops out in the Baijian area with a thickness and length of c. 3–7 km and 120 km, which is distributed in a NW–SE direction (Fig. 2). The rock assemblages of the ZLGG are mainly composed of dolomites, quartz biotite schists and basaltic volcanic rocks, and seven basalts were collected from the Baijian area (Fig. 2). The field observations showed that the collected samples did not contain crustal xenoliths, indicating the negligible effect of crustal contamination.
2.c. Sample description
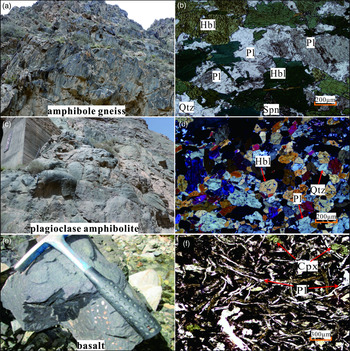
The BDHG amphibole gneisses show a gneissic structure and crystalloblastic texture (Fig. 3a). The main mineral components are amphibole (c. 50%), plagioclase (c. 40%), biotite (c. 5%), quartz (c. 4%) and minor spinel (c. 1%), and these minerals are foliated (Fig. 3b), indicating middle- to high-grade metamorphism. The BDHG plagioclase amphibolites have massive structure, and part of them retained the pillow structure of the protoliths (Fig. 3c), showing relatively low–middle-grade metamorphism. The BDHG plagioclase amphibolites exhibit a recrystallization texture associated with metamorphism (Fig. 3d); these samples mainly consist of subhedral–anhedral amphiboles (c. 60%) and plagioclase (c. 30%) with a small amount of quartz (Fig. 3d). The ZLGG basalts show a massive structure and porphyritic texture (Fig. 3e). The phenocrysts are mainly composed of anhedral plagioclase (c. 40%) and clinopyroxene (c. 20%) (Fig. 3f).
Field photographs and photomicrographs of (a, b) BDHG amphibole gneisses; (c, d) BDHG plagioclase amphibolites; and (e, f) ZLGG basalts. Hbl – hornblende; Pl – plagioclase; Apt – apatite; Cpx – clinopyroxene; Qtz – quartz; Bt – biotite; Cal – calcite; Spn – sphene.

3. Analytical methods
3.a. Whole-rock major- and trace-element analyses
Whole-rock major- and trace-element compositions were determined by X-ray fluorescence (XRF) and inductively coupled plasma – mass spectrometry (ICP-MS), respectively, and were carried out in the State Key Laboratory of Isotope Geochemistry (SKLaBIG), Guangzhou Institute of Geochemistry, Chinese Academy of Sciences (GIGCAS). Rock powders were fused to make glass discs for XRF analysis and acid-digested in steel-jacketed Teflon bombs to produce solutions for ICP-MS analysis. The Chinese national standards GSR-1 and GSR-3 were used to monitor accuracy. The differences between our results and the recommended values for the standards were generally better than 5% for major and trace elements. Sample preparations, instrument operating conditions and calibration procedures by Liang & Grégoire (Reference Liang and Grégoire2010) were applied.
3.b. Whole-rock Sr–Nd–Hf isotope analyses
Samples for analysis of Sr–Nd–Hf isotopes were dissolved in a mixture of HF + HNO3 + HClO4 using Teflon bombs, dried on a hot plate, refluxed in 6 N HCl, and dried again. Before chemical separation, 3 N HCl was used for sample extraction. Sr, Nd and Hf were separated using conventional ion exchange procedures as described by Yang et al. (Reference Yang, Duan and Du2010). Sr–Nd–Hf isotopes were determined at the GIGCAS. Sr, Nd and Hf isotopes were determined with a Neptune Plus multi-collector ICP-MS. Internal standards of NBS-987, JNdi-1 and JMC14374 were analysed together with the studied samples, which gave Sr–Nd–Hf isotopes of 87Sr/86Sr (0.710248), 143Nd/144Nd (0.512115) and 176Hf/177Hf (0.282189).
4. Results
4.a. Major and trace elements
Whole-rock major- and trace-element compositions of representative samples from the BDHG and ZLGG are given in Table 1. Given that these samples have high loss on ignition values (LOI = 0.28–5.70 wt%), we recalculated the major elements on an anhydrous basis. Furthermore, K and Na are mobile during metamorphism and alteration processes, while Nb, Ta, Ce, Zr, Ti, Yb and Y are immobile. We therefore chose immobile elements to distinguish rock properties.
Whole-rock major-element (wt%) and trace-element (ppm) data of the (meta-) basalts from BDHG and ZLGG

Mg no. = [Mg2+/(Mg2++Fe2+)]×100; δEu = EuN/[(SmN × GdN)1/2]; δCe = CeN/[(LaN × PrN)1/2]
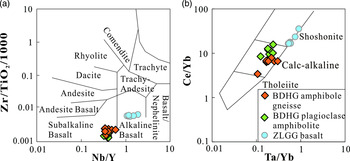
The BDHG amphibole gneisses have variable contents of SiO2 (45.5–51.4 wt%), Al2O3 (10.9–14.8 wt%), CaO (9.38–11.6 wt%), TiO2 (1.67–3.56 wt%) and MgO (5.29–7.48 wt%), with Mg no. values of 38.1–47.1 and relatively low contents of Na2O (1.66–2.90 wt%) and K2O (0.63–1.26 wt%), with total alkali contents (Na2O + K2O) of 2.82–3.62 wt%. The BDHG plagioclase amphibolites have uniform SiO2 (47.4–49.3 wt%), Al2O3 (14.5–15.7 wt%), CaO (9.20–10.4 wt%), TiO2 (1.54–1.76 wt%) and Na2O (2.44–2.63 wt%) contents and variable K2O (0.93–2.02 wt%) contents, with total alkali contents (Na2O + K2O) of 2.50–4.59 wt%, but relatively high MgO (8.58–9.00 wt%) contents with Mg no. values of 56.6–57.9. On the Ce/Yb versus Ta/Yb diagram (Fig. 4), the BDHG amphibole gneisses and plagioclase amphibolites all plot in the calc–alkaline series.
(a) Zr/TiO2 versus Nb/Y lithology classification diagram (after Winchester & Floyd, Reference Winchester and Floyd1976) and (b) Ce/Yb versus Ta/Yb diagram (after Müller & Groves, Reference Müller and Groves1995).

The ZLGG basalts have relatively low SiO2 (42.5–47.5 wt%), MgO (3.74–5.83 wt%, Mg no. = 31.4–42.4), and TiO2 (1.73–2.18 wt%) contents, but relatively high K2O (1.22–2.97 wt%) and Na2O (6.26–7.89 wt%) contents with total alkali contents of 7.64–9.95 wt%; they have relatively high Al2O3 (14.9–18.0 wt%) and TFe2O3 (15.6–17.9 wt%) contents and variable CaO (4.20–13.2 wt%) contents, showing features of shoshonite-series alkaline basalt (Fig. 4).
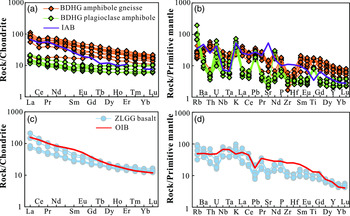
On the chondrite-normalized REE pattern diagram (Fig. 5a), the BDHG amphibole gneisses and plagioclase amphibolites are all characterized by enrichment of light REEs (LREEs, (La/Sm)N = 1.17–2.47 and 1.72–1.91, respectively), negligible Eu anomalies (δEu = 0.86–1.03 and 0.85–1.15, respectively) and different Ce anomalies (δCe = 0.78–0.79 and 1.01–1.08, respectively, Table 1). Relative to the primitive mantle (PM; Sun & McDonough, Reference Sun, McDonough, Saunders and Norry1989), the BDHG amphibole gneisses are enriched in Th, U, K and Pb and depleted in Ba, Sr, Nb, Ta, Zr and Hf, similar to typical IABs (Fig. 5b). The plagioclase amphibolites are enriched in Ba, U, K and Pb and depleted in Sr, Nb, Ta, Zr and Hf, and show affinities with IABs (Fig. 5b).
Chondrite-normalized rare earth element diagrams and primitive-mantle-normalized trace-element spider diagrams: (a, b) BDHG amphibole gneisses and plagioclase amphibolites; and (c, d) ZLGG basalts. Chondrite, primitive-mantle, OIB values after Sun & McDonough (Reference Sun, McDonough, Saunders and Norry1989); IAB value is average of Aleutian island-arc basalt after Kelemen et al. (Reference Kelemen, Yogodzinski, Scholl and Kelemen2003).

On the chondrite-normalized REE pattern diagram (Fig. 5c), the ZLGG basalts show enrichments of LREEs ((La/Sm)N =2.42–3.78) with slightly positive Eu anomalies (δEu = 1.08–1.11). On the primitive-mantle-normalized trace-element spider diagram, all basalts are enriched in Rb, Ba, Nb and Ta but depleted in Pb and Sr, which is a characteristic feature of oceanic-island basalts (OIBs) (Fig. 5d).
4.b. Whole-rock Rb–Sr, Sm–Nd and Lu–Hf isotopic compositions
The whole-rock Sr–Nd–Hf isotope analysis results of the samples are reported in Table 2.
Whole-rock Sr–Nd–Hf isotopic data of the (meta-) basalts from BDHG and ZLGG

In the calculations of ϵ Nd(t) and ϵ Hf(t), (143Nd/144Nd)CHUR = 0.512638; (147Sm/144Nd)CHUR = 0.1967; (143Nd/144Nd)DM = 0.51315; (147Sm/144Nd)DM = 0.2136; (176Hf/177Hf)CHUR = 0.282785; (176Lu/177Hf)CHUR = 0.0336; (176Lu/177Hf)DM = 0.0384; (176Hf/177Hf)DM = 0.28325.
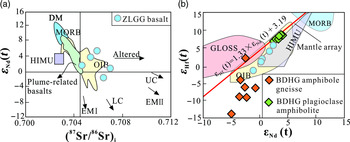
We calculated the (87Sr/86Sr)i, ϵ Nd(t) and ϵ Hf(t) values of the BDHG metamorphic samples and ZLGG basalts at ages of 1.7 and 1.6 Ga (discussed in Section 6), respectively. The BDHG amphibole gneisses have variable ϵ Nd(t) and ϵ Hf(t) values from −5.0 to −0.6 and from −14.2 to 2.0, respectively (Fig. 6b). The uniform ϵ Nd(t) and ϵ Hf(t) values of the BDHG plagioclase amphibolites range from 2.7 to 4.3 and from 6.9 to 8.8, respectively (Fig. 6b). The ZLGG basalts show variable (87Sr/86Sr)i values of 0.70464–0.70699, ϵ Nd(t) values of −1–2.6 and ϵ Hf(t) values of −1.5–5.7 (Fig. 6).
(a) ϵ Nd(t) versus (87Sr/86Sr)i diagram (HIMU, EM I, EM II data after Hanan et al. Reference Hanan, Shervais and Vetter2008; plume-related basalts are OJP basalts and Hawaiian shield basalts, after Mahoney et al. Reference Mahoney, Storey, Duncan, Spencer, Pringle, Pringle, Sager, Sliter and Stein2013; Tejada et al. Reference Tejada, Mahoney, Neal, Duncan and Petterson2018; Hawaiian shield basalts are from Coombs et al. Reference Coombs, Sisson and Kimura2004; Wanless et al. Reference Wanless, Garcia and Rhodes2006; Tanaka et al. Reference Tanaka, Makishima and Nakamura2008; Ren et al. Reference Ren, Hanyu, Miyazaki, Chang, Kawabata, Takahashi, Hirahara, Nichols and Tatsumi2009; Yamasaki et al. Reference Yamasaki, Kani and Hanan2009; Weis et al. Reference Weis, Garcia and Rhodes2011). (b) ϵ Hf (t) versus ϵ Nd(t) diagram (mantle array: ϵ Hf(t) = 1.33 × ϵ Nd(t) + 3.19, after Kempton et al. Reference Kempton, Pearce, Barry, Fitton, Langmuir and Christie2002; HIMU data after Hart & Zindler, Reference Hart and Zindler1986; MORB, OIB and GLOSS after Hofmann, Reference Hofmann1997; Nowell et al. Reference Nowell, Kempton, Noble, Fitton, Saunders, Mohaoney and Taylor1998; Chauvel et al. Reference Chauvel, Lewin, Carpentier, Arndt and Marini2008).

5. Discussion
5.a. Effects of metamorphism or secondary alteration
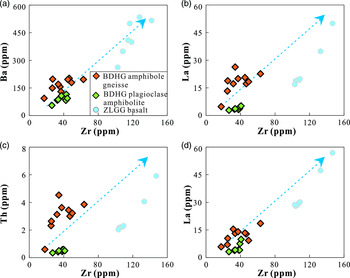
High-field-strength elements (e.g. Zr and Nb) are commonly considered to be immobile elements during low-grade metamorphism and alteration, making them the preferred reference for evaluating the mobility of other trace elements (Polat & Hofmann, Reference Polat and Hofmann2003). This could result in positive correlations on bivariate plots between Zr (or Nb) and the selected elements if the chemical compositions are controlled only by magmatic processes (Polat & Hofmann, Reference Polat and Hofmann2003). There is a positive correlation between Ba (or La, Th and Nb) and Zr of all samples (Fig. 7), demonstrating that these elements were not influenced by metamorphism or secondary alteration. These elements can therefore be used to discuss the petrogenesis and tectonic setting of the samples.
Elements versus Zr correlation diagrams for the studied samples.

5.b. Protoliths of BDHG metamorphic rocks
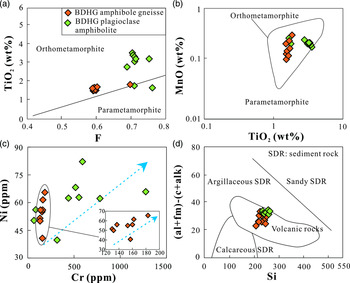
The protolith recovery of metamorphic rocks is mainly studied by the combination of field geological surveys, petrography and geochemistry. The field geological survey shows that the amphibole gneisses of the BDHG have metamorphic pillow structures (Fig. 3c), revealing that the protoliths may be volcanic rocks with pillow structures. Furthermore, the amphibolite gneisses and plagioclase amphibolites of the BDHG are all orthometamorphite, as indicated by protolith discriminant diagrams (Fig. 8a, b). Zhao (Reference Zhao1997) proposed that there is a positive correlation between Cr and Ni contents of amphibolites whose protoliths are volcanic rocks. Moreover, the Cr/Ni ratio of sedimentary rocks is usually < 1, while mafic rocks have a Cr/Ni ratio that is generally > 1. The Cr/Ni ratios of amphibole gneisses and plagioclase amphibolites of the BDHG are 7.8–32 and 2.4–3.8, respectively, and all samples show a positive correlation between Cr and Ni and plot in the field of volcanic rocks in the (al+fm)–(c+alk) versus Si diagram (Fig. 8c, d), indicating that the protoliths of these samples are mafic rocks. Consistent with the diagrams discriminating rock properties (Fig. 4a), the protoliths of the BDHG amphibole gneisses and plagioclase amphibolites are all subalkaline basalts. In conclusion, the protolith amphibole gneisses and plagioclase amphibolites from the BDHG are subalkaline basalts.
(a) TiO2 versus F diagram, F = (FeO + Fe2O3)/(FeO + Fe2O3 + MgO) (after Misra, Reference Misra1971); (b) TiO2 versus MnO diagram (after Rickwood, Reference Rickwood1989); (c) Cr versus Ni diagram; and (d) Simonen diagram (after Simonen, Reference Simonen1953).

5.c. Role of crustal assimilation and fractional crystallization
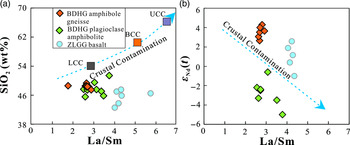
Crustal assimilation is almost inevitable for mantle-derived melts during their ascent through the continental crust or their evolution within a crustal magma chamber. In general, the assimilation of crustal materials increases the La/Sm ratio and SiO2 content of melts, while a decrease in the ϵ Nd(t) value of the continental crust is generally characterized by a relatively high La/Sm ratio and SiO2 content but a low ϵ Nd(t) value. There is no linear relationship between SiO2 (or La/Sm) and ϵ Nd(t) of the samples on discrimination diagrams of crustal contamination (Fig. 9). Combined with no appearance of crustal xenoliths, we suggest that the chemical compositions of all studied samples are not significantly modified by crustal contamination.
Crustal contamination discrimination diagrams for the BDHG and ZLGG samples: (a) SiO2 versus La/Sm diagram; and (b) ϵ Nd(t) versus La/Sm diagram. LCC, BCC and UCC data after Rudnick & Gao (Reference Rudnick and Gao2003).

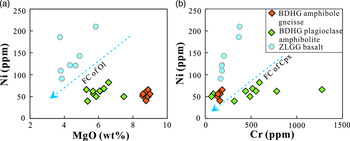
The low Mg no. values of the studied samples suggest that their parental magmas may have undergone significant fractionation of Mg-rich minerals, such as olivine and clinopyroxene. In olivine, Ni is compatible, and the MgO content is high (DNi c. 5.9–29; Leeman & Lindstrom Reference Leeman and Lindstrom1978; DMg c. 1.96–4.44, Beattie, Reference Beattie1994). If fractional crystallization of olivine occurs, the Ni content in the residual melt decreases with decreasing MgO content. As shown by the fractional crystallization discrimination diagrams (Fig. 10a), the Ni contents decrease with decreasing MgO contents in all samples, indicating that all samples experienced significant fractional crystallization of olivine. Moreover, all samples show a positive correlation between Cr and Ni (Fig. 10b), and the ZLGG basalts contain abundant phenocrysts of clinopyroxene (Fig. 3f) and slight Eu anomalies (Fig. 5a, c) (δEu = 0.86–1.03, 0.85–1.15 and 1.08–1.11; Table 1), signifying remarkable fractional crystallization of clinopyroxene for all samples without fractional crystallization of plagioclase. Positive Ti anomalies in some BDHG amphibole gneisses and plagioclase amphibolites (Fig. 5a) may be caused by the recrystallization of amphibole, which has a high Ti distribution coefficient (DTi = 2.02; Brenan et al. Reference Brenan, Shaw, Ryerson and Phinney1995). This is consistent with recrystallization texture of the BDHG amphibole gneisses and plagioclase amphibolites (Fig. 3b, d). In conclusion, the parental magmas for all studied samples from the BDHG and ZLGG have probably experienced the fractional crystallization of olivine and clinopyroxene. The recrystallization of amphibole resulted in the BDHG metabasalts having positive Ti anomalies.
Fractional crystallization discrimination diagrams for the BDHG and ZLGG samples: (a) Ni versus MgO; and (b) Ni versus Cr.

5.d. Source of BDHG and ZLGG samples
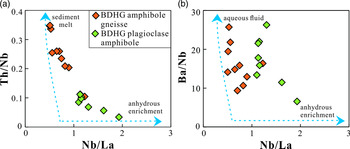
The BDHG metabasalts feature depletions of Nb, Ta, Zr and Hf, giving them geochemically similar signatures to IABs (Fig. 5b). Previous studies have shown that IABs are derived from the mantle and metasomatized by subducted slab-derived aqueous fluid and sediment melt (Hawkesworth et al. Reference Hawkesworth, Turner, Gallagher, Hunter, Bradshaw and Rogers1995; Wilson et al. Reference Wilson, Houghton and Mcwilliams1995; Ivanov et al. Reference Ivanov, Perepelov, Palesskii and Nikolaeva2008, Reference Ivanov, He, Yan, Ryabov, Shevko, Palesskii and Nikolaeva2013; Merle et al. Reference Merle, Marzoli, Reisberg, Bertrand, Nemchin, Chiaradia, Callegaro, Jourdan, Bellieno, Kontak, Puffer and McHone2014). However, the rocks formed by continental crust contamination during magmatic evolution may also have characteristics similar to IABs. The above discussions have shown that the parental magma of the metabasalts from the BDHG underwent insignificant crustal assimilation. The aqueous fluid released by the subducted slab is enriched in Rb, K, Sr, Ba, Pb, etc., whereas Th is mobile during the melting of subducted sediments (Regelous et al. Reference Regelous, Collerson, Ewart and Wendt1997). We can therefore use Ba and Th to determine whether the sources were metasomatized by aqueous fluid or sediment melt. The protoliths of BDHG amphibole gneisses are products of partial melting of the asthenospheric mantle that was metasomatized by subducted slab-derived aqueous fluid and sediment melt for the following reasons: (1) these samples have high Ba/Nb and Th/Nb ratios, showing features indicating metasomatization by subducted aqueous fluid and sediment melt (Fig. 11); (2) these samples have negative Ce anomalies (Fig. 5, δCe = 0.79–0.82), suggesting that subducted sediment melt was present in the magmatic source (Bellot et al. Reference Bellot, Boyeta, Doucelance, Bonnard, Savov, Plank and Elliot2018); (3) the variable and more enriched Nd and Hf isotopes (ϵ Nd(t) = −5.0 to −0.6 and ϵ Hf(t) = −14.2–2.0) (Fig. 6) indicate that the magmatic source of these samples was involved in subducted sedimentary melting; and (4) the decoupled Nd and Hf isotopes (Fig. 6) can be explained by the higher mobility of Nd than Hf during the partial melting of subducted sediments. The melts from subducted sediments can therefore have high Nd/Hf ratios and can modify the Nd isotope composition more significantly than the Hf isotope composition in the mantle wedge, which can result in Nd–Hf isotope decoupling in arc-related rocks (Todd et al. Reference Todd, Gill, Wysoczanski, Handler, Wright and Gamble2010). The BDHG plagioclase amphibolites have analogous Ba/Nb but lower Th/Nb ratios, and inappreciable Ce anomalies compared with amphibole gneisses (Figs 5a, 11); they also have limited variable, coupled and depleted Nd and Hf isotopes (ϵ Nd(t) = 2.7–4.3, ϵ Hf(t) =6.9–8.8) (Fig. 6), stating that the mantle source of plagioclase amphibolites was metasomatized by subducted slab-derived aqueous fluid with a small quantity of sediment melt.
Aqueous fluid and sediment melt metasomatized discrimination diagrams of BDHG samples (modified after Geng et al. Reference Geng, Sun, Yuan, Zhao and Xiao2011): (a) Th/Nb versus Nb/La diagram; and (b) Ba/Nb versus Nb/La diagram.

The ZLGG basalts are enriched in Rb, Ba, Nb and Ta but depleted in Pb and Sr, showing OIB geochemical affinities (Fig. 5d). The magmatism that generates OIBs is usually related to hotspots or mantle plumes. Many studies have argued that the subducted slab and sediment are important components of the mantle plume OIB (White & Hofmann, Reference White and Hofmann1982; Weaver, Reference Weaver1991; Chauvel et al. Reference Chauvel, Hofmann and Vidal1992, Reference Chauvel, Lewin, Carpentier, Arndt and Marini2008; Jackson et al. Reference Jackson, Hart, Koppers, Staudigel, Konter, Blusztajn, Kurz and Russell2007; Prytulak & Elliott, Reference Prytulak and Elliott2007; Ren et al. Reference Ren, Hanyu, Miyazaki, Chang, Kawabata, Takahashi, Hirahara, Nichols and Tatsumi2009; Willbold & Stracke, Reference Willbold and Stracke2010; Yang et al. Reference Yang, Li and Xiao2015, Reference Yang, Li and Tong2019). The ZLGG basalts have Sr–Nd isotope characteristics similar to those of plume-related OIBs (Fig. 6a). In addition, the Nd–Hf isotopes are decoupled and deviate from the mantle array (Fig. 6b). Blichert–Toft & Albarde (Reference Blichert–Toft and Albarde1997) proposed that there exists a relatively low 176Hf/177Hf reservoir in the mantle to meet the demand for Nd–Hf isotopes decoupled from the mantle, and the reservoir is in the subducted oceanic crust. The ZLGG basalts are therefore products of the mantle plume that was involved in subducted oceanic crust.
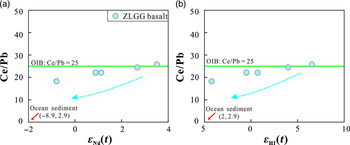
When oceanic crust subduction occurs, sediments are usually carried into the mantle simultaneously. The distribution coefficients of Pb and Ce are similar, and they hardly fractionate in the process of partial melting or crystallization differentiation. Consequently, the ratio of these elements can reflect the nature of the mantle source (Hofmann et al. Reference Hofmann, Jochum, Seufert and White1986; Hofmann, Reference Hofmann1997). In the ϵ Nd(t) (or ϵ Hf(t)) versus Ce/Pb diagram (Fig. 12), the Ce/Pb ratios decrease with decreasing ϵ Nd(t) and ϵ Hf(t) values. The preceding discussion indicates that these basalts were not contaminated by the crust. Sediment is therefore involved in the mantle source of these basalts. Furthermore, a prerequisite for the formation of mantle plumes is a high mantle potential temperature (Xu et al. Reference Xu, He and Chung2004), and the potential temperature of the mantle in large igneous provinces is significantly higher (> 1450°C; Herzberg & Asimow, Reference Herzberg and Asimow2005). The crystallization temperature of clinopyroxene phenocrysts reaches 1480°C (Liu, Reference Liu2019), indicating an extremely high mantle potential temperature. The basalts from the ZLGG are therefore products of mantle plume magmatism.
(a) ϵ Nd(t) versus Ce/Pb; (b) ϵ Hf(t) versus Ce/Pb diagrams (MORB and OIB data after Sun & McDonough, Reference Sun, McDonough, Saunders and Norry1989; ocean sediment data after Plank & Langmuir, Reference Plank and Langmuir1998).

5.e. Tectonic setting of BDHG and ZLGG samples
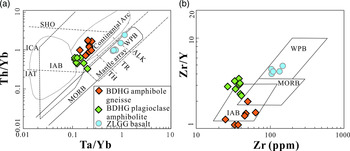
Some researchers argue that the BDHG formed in a rifting environment (Xu & Yue Reference Xu and Yue1997; Zhang & Mao, Reference Zhang and Mao1998; Feng et al. Reference Feng, Wang, Zeng and Zhang2005) or a magmatic-arc environment (Gao, Reference Gao2003; Fu et al. Reference Fu, Su, Hu and Wang2005; YC Nan, unpub. M.Sc. thesis, Chengdu University of Technology, 2018). To accurately distinguish the tectonic setting of the BDHG, we considered immobile elements such as Zr, Y, Ta, Th and Yb. The BDHG metabasalts mainly plot in the continental-arc and IAB fields on tectonic setting discriminant diagrams (Fig. 13). The studied samples from BDHG show IAB affinities and are products of partial melting of the asthenospheric mantle that were metasomatized by subducted slab-derived aqueous fluid and sediment melt, which is consistent with an arc setting. Additionally, the average Nb/U ratio of 11.7 in plagioclase amphibolites are akin to continental-arc volcanic rocks (Nb/U c. 12; Kelemen et al. Reference Kelemen, Yogodzinski, Scholl and Kelemen2003). There are also many IAB-like metamorphic Palaeoproterozoic mafic rocks (1.9–1.8 Ga), formed in a continental-arc setting, distributed in the Dunhuang Block (Wang et al. Reference Wang, Han and Xiao2014; Zhao et al. Reference Zhao, Sun, Yan and Diwu2015; Zhao, Reference Zhao2017). Moreover, Guo et al. (Reference Guo, Zhao and Li1999) proposed that the Huangyuan Group mafic volcanic rocks developed in the Middle Qilian Block, and showed that IAB geochemical features were also generated in an arc environment during the Palaeoproterozoic Era. Compared with adjacent blocks in tectonic settings, the BDHG was therefore formed in a continental-arc environment.
Tectonic setting discrimination diagrams: (a) Th/Yb versus Ta/Yb diagram (after Rudnick & Fountain, Reference Rudnick and Fountain1995); and (b) Zr/Y versus Zr diagram (after Pearce & Norry, Reference Pearce and Norry1979). IAB – island-arc basalt; MORB – mid-ocean-ridge basalt; WPB – within-plate basalt; SHO – shoshonite; ICA – calc–alkaline basalt; IAT – island-arc tholeiite; ALK – alkaline basalt; TH – tholeiite; TR – transitional basalt.

The fact that the two formations within the BDHG have different Nd and Hf isotope compositions, although they formed in the same tectonic environment, can be explained by the fact that they represent the different parts of a three-part arc (frontal arc, arc and rear arc). The different parts of the arc have different thermal conditions due to different subduction depths. The nature of released slab components depends on the thermal structure of the subducting oceanic slab and its depth in the subduction zone. For example, the Th/Nb ratio increases and ϵ Nd(t) value decreases towards the rear-arc region, perhaps due to the increase of the subducted sediment-derived melt with the increasing subduction depth (Yu et al. Reference Yu, Huang, Sun and Yuan2020). Furthermore, ratios of fluid-mobile to immobile incompatible trace elements (e.g. Ba/Th, Ba/Nb and Ba/La) increase towards the frontal arc with shallower subduction depth, suggesting greater slab dehydration and water flux below the frontal arc (Ancellin et al. Reference Ancellin, Samaniego, Vlastelic, Nauret, Gannoun and Hidalgo2017). The BDHG amphibole gneisses are products of partial melting of the asthenospheric mantle that was metasomatized by subducted sediment-derived melt. However, the mantle source of BDHG plagioclase amphibolites was metasomatized by subducted slab-derived aqueous fluid, signifying different thermal conditions. The two formations within the BDHG may therefore represent the different part of an arc with different metasomatic agent as a result of the different thermal conditions of different subduction depths.
Some studies on the tectonic setting of the ZLGG have been carried out. For example, Xu et al. (Reference Xu, Yue and Liu1996), Xu & Yue (Reference Xu and Yue1997) and Zuo et al. (Reference Zuo, Liu and Zhang2000) proposed that the volcanic rocks of the ZLGG formed in an intracontinental rifting environment. Furthermore, Xia & Xia (Reference Xia and Xia2000) argued that the Mesoproterozoic basalts in the western North Qilian Orogenic Belt were formed by mantle plume magmatism and in an intracontinental rift setting. Recently, Yan (Reference Yan2014) argued that the volcanic rocks of the ZLGG were derived from rifting. Extensional magmatic activities are also preserved in adjacent blocks of the NQB. For example, Wang et al. (2017a) proposed that the A-type granites (1732 ± 7 Ma) in the Dahongshan area, southeastern Tarim Craton, were formed in lithospheric extensional tectonic settings. Furthermore, the granites and mafic rocks of the Oulongbuluke micro-continental block and Northern Qaidam Block, with formation ages 1776 ± 33 and 1852 ± 15 Ma, respectively, were formed by micro-block splitting. The tectonic background discrimination diagrams (Fig. 13) show that the ZLGG basalts formed in a within-plate environment. The above discussions demonstrate that the ZLGG was formed in a continental rift environment.
6. Proterozoic tectonomagmatic evolution of the western NQB
Xu et al. (Reference Xu, Yue and Liu1996) calculated the Sm–Nd isochron age of BDHG basalts to be 1771 Ma. Recently, Mao (Reference Mao2003) obtained the Sm–Nd isochron age of 1980 ± 2.7 Ma, which is regarded as the formation age of BDHG rocks. The detrital zircons from BDHG quartz schists show an age peak of c. 1.8 Ga, signifying that the most intense tectonomagmatic activities occurred during the Palaeoproterozoic Era in the North Qilian Orogenic Belt (Li et al. Reference Li, Lu, Xiang, Sun, Xiang, Geng and Zhou2007). The latest magmatic zircons from the BDHG amphibolites yield a 207Pb/206Pb weighted average age of c. 1.7 Ga and an upper intersection age of c. 1.7 Ga (Liu, Reference Liu2019). However, the amphibolites which show back-arc basin basalts affinities from BDHG in the Middle Qilian Block yield a crystallization age of 1.6 Ga (Wang et al. 2017b). This age is younger than that mentioned above, but it is not contradictory. The Beidahe Groups in the North Qilian Orogenic Belt and Middle Qilian Block may represent the arc and back-arc basin of a complete trench-arc-basin system, as indicated by the different geochemical features that are similar to IAB and back-arc basin basalts, respectively. In fact, a back-arc basin generally forms c. 30–50 Ma after initial subduction (e.g. Xia et al. Reference Xia, Song and Niu2012; Tani et al. Reference Tani, Dunkley, Chang, Nichols, Shukuno, Hirahara, Ishizuka, Arima and Tatsumi2015; Hickey-Vargas et al. Reference Hickey-Vargas, Yogodzinski, Ishizuka, McCarthy, Bizimis, Kusano, Savov and Arculus2018; Magni, Reference Magni2019). The IAB-like protoliths of metamorphic rocks from BDHG in the North Qilian Orogenic Belt therefore represent the arc magmatism, which should be earlier than the back-arc basin magmatic activity (c. 1.6 Ga; Wang et al. 2017b) and formed during late Palaeoproterozoic time (c. 1.7 Ga; Liu, Reference Liu2019). According to the geological field survey, there is a fault-contact relationship between the ZLGG and the underlying BDHG. Consequently, the formation age of the ZLGG basalts should be younger than that of the BDHG (c. 1.7 Ga). The magmatic zircons in the quartz biotite schists from the lower part of the ZLGG yield a 207Pb/206Pb weighted average age of 1555 Ma (Liu, Reference Liu2019), further indicating that the ZLGG was formed after 1.6 Ga. In addition, Yu (Reference Yu1997) proposed that the formation age of lower ZLGG basalts in the Daquan area is 1529 Ma. We therefore constrain the formation age of ZLGG basalts to 1555–1529 Ma.
The BDHG formed in a continental-arc setting during late Palaeoproterozoic time (2.0–1.7 Ga), which is consistent with the Lvliang–Zhongtiao orogenic events (c. 2.0–1.8 Ga; Lu et al. Reference Lu, Li and Xiang2010) in the North China Craton. Moreover, similar tectonomagmatic events occurred in adjacent blocks. For example, the Middle Qilian Block and Dunhuang Block all contain IAB-like rocks that were formed in a volcanic-arc environment during late Palaeoproterozoic time (2.0–1.8 Ga). Some researchers have proposed that the Columbia Supercontinent formed during the Palaeoproterozoic Era (c. 1.8 Ga; Rogers & Santosh, Reference Rogers and Santosh2002, Reference Rogers and Santosh2009). The Palaeoproterozoic tectonomagmatic events in the NQB were therefore a response to the convergence events of the Columbia Supercontinent.
Previous studies have found that splitting events of the Columbia Supercontinent began at c. 1.7 Ga and terminated between 1.3 and 1.2 Ga (Ernst & Bell, 2000; Zhao et al. Reference Zhao, Cawood and Wilde2002, Reference Zhao, Sun and Wilde2004). The ZLGG basalts formed in an intracontinental rifting setting during the Mesoproterozoic Era (1.6–1.5 Ga). Moreover, recent studies have shown that mantle plumes are drivers of continental disintegration (Burov & Gerya, Reference Burov and Gerya2014), and a mantle plume existed in the NQB during the Mesoproterozoic Era, as revealed by the ZLGG OIB-like basalts. The Mesoproterozoic tectonomagmatic activities in the NQB were therefore a response to the break-up of the Columbia Supercontinent.
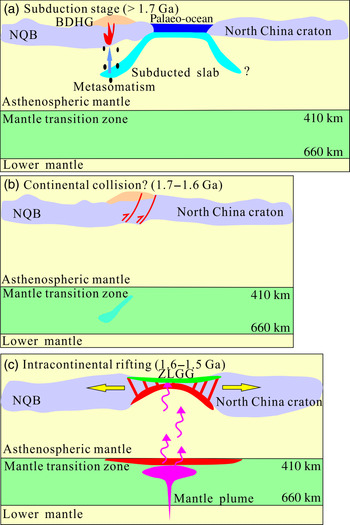
In conclusion, the NQB experienced a tectonic evolutionary history of palaeo-ocean subduction before late Palaeoproterozoic time (c. 1.7 Ga) and intracontinental rifting during the Mesoproterozoic Era (1.6–1.5 Ga). Furthermore, the late Palaeoproterozoic – Mesoproterozoic tectonomagmatic events in the NQB were a response to convergence–splitting events of the Columbia Supercontinent. The tectonic evolution can be summarized as follows (Fig. 14).
-
(1) Subduction stage (> 1.7 Ga, Fig. 14a): during late Palaeoproterozoic time, the NQB was in the palaeo-ocean subduction stage. The BDHG volcano–sedimentary rock assemblages formed in an arc setting. This tectonomagmatic event was in response to the Columbia Supercontinent convergence.
-
(2) Continental collision stage (1.7–1.6 Ga?, Fig. 14b): palaeo-oceanic subduction closed, and the NQB and North China Craton constituted part of the Columbia Supercontinent, which corresponds to the Lvliang–Zhongtiao orogeny of the North China Craton.
-
(3) Intracontinental rifting stage (1.6–1.5 Ga, Fig. 14c): the NQB started a new Wilson cycle during this stage. Lithospheric extension occurred again in the North China Craton and North Qilian suture zone and then formed intracontinental rifting. Its dynamic mechanism may have been related to lithospheric extension and thinning caused by mantle plume uplift. This stage corresponds to the large-scale splitting events of the North China Craton (1.77–1.3 Ga) and Columbia Supercontinent disintegration (1.7–1.2 Ga; Rogers & Santosh, Reference Rogers and Santosh2002, Reference Rogers and Santosh2009; Lu et al. Reference Lu, Yang, Li and Chen2002, Reference Lu, Li and Xiang2010; Chen et al. Reference Chen, Wang, Chen and Li2007).
Tectonic evolution of the North Qilian Block during the Palaeoproterozoic–Mesoproterozoic eras.

7. Conclusions
-
(1) The protoliths of the Palaeoproterozoic amphibole gneisses and plagioclase amphibolites from the Beidahe Group are basalts. These metabasalts show island-arc basalt affinities and were products of partial melting of the asthenospheric mantle that was metasomatized by subducted slab-derived aqueous fluid and/or sediment melt in a continental-arc environment during the Palaeoproterozoic Era.
-
(2) The basalts from the Zhulongguan Group are shoshonite series and are geochemically similar to oceanic-island basalts. These basalts are products of mantle-plume magmatism that participated with subducted oceanic crust and sediments in an intracontinental rift setting.
-
(3) The North Qilian Block experienced the tectonic evolution of palaeo-ocean subduction during late Palaeoproterozoic time and intracontinental rifting during the Mesoproterozoic Era. All the above-described tectonomagmatic events were responses to the convergence–splitting events of the Columbia Supercontinent.
Acknowledgments
This study was financially supported by the Foundation of Basic Scientific Research of Central Universities (grant no. lzujbky-2018-it20).
Conflict of interest
None.