


1. INTRODUCTION
Tropospheric path delay is typically expressed as a product of unknown total zenith path delay (ZPD), which is modelled as a random walk process noise, and a known mapping function relating slant path delay to ZPD (Kouba and Héroux, Reference Kouba and Héroux2001). Alternatively, the tropospheric path delay can be modelled as a function of zenith hydrostatic and wet delays, with two different mapping functions, plus tropospheric gradients (Gao et al., Reference Gao, Skone, Chen and Nicholson2004). In such a case, the zenith wet delay and two gradient coefficients are to be estimated. Unfortunately, unlike the zenith hydrostatic delay, the zenith wet delay is highly correlated with the total zenith tropospheric delay (Gutman et al., Reference Gutman, Fuller-Rowell and Robinson2003), which in turn is known to be highly correlated with the height component of the station coordinates (Kouba, Reference Kouba2003). The existence of such high cross-correlation as well as the temporal correlation of the tropospheric path delay slows down the convergence of the GPS solution. More recently, a number of regional and local monitoring networks have been established to generate tropospheric corrections. Among them is the NOAA tropospheric correction model, which incorporates GPS observations into numerical weather prediction (NWP) models (Gutman et al., Reference Gutman, Fuller-Rowell and Robinson2003). The model is distributed as a 2-D grid file, which is updated hourly and contains the zenith tropospheric delay (current and forecast) over the U.S. and surrounding regions (including a large portion of Canada). Unfortunately, however, although the model improved the positioning solution compared with the standard tropospheric models (e.g., Saastamoinen and Hopfield models), a residual tropospheric delay component remains un-modelled. Such a residual delay component is found to be temporally correlated, which may slow down the conversion of the GPS solution.
To overcome the limitations of the current models, a new approach to tropospheric modelling is proposed in this paper. In this approach, the bulk of the tropospheric delay is accounted for using the NOAA-generated tropospheric correction model, while the residual tropospheric delay component is accounted for stochastically. To do this, daily residual tropospheric delay data series at ten International GNSS Service (IGS) reference stations are obtained by comparing the NOAA tropospheric model and the new final tropospheric product of the IGS. The new IGS final tropospheric delay product, which is generated at a 5-minute interval, is described as highly accurate and highly reliable (Byun et al., Reference Byun, Bar-Sever and Gendt2005). The ten IGS reference stations included in this research are ALGO, AMC2, FLIN, HLFX, HOLB, JPLM, MOD1, NLIB, PRDS and USNO (Figure 1). The stations are selected in different geographical locations in order to represent the various climate conditions in our proposed model. Also the seasonal changes have been considered in the model by using data over the year 2006.
IGS station distribution in North America. (From http://igscb.jpl.nasa.gov/network/maps/all_nam.html).

Estimates of a set of auto-covariance functions of the un-modelled daily tropospheric delay residuals are obtained at each of the ten reference stations, which are used to develop the empirical covariance functions, in the least-squares sense. Three empirical covariance functions are examined as potential covariance functions, namely first- and second-order Gauss-Markov processes and the exponential cosine function. Fitting results show that the exponential cosine function gives the best fit most of the time, while the second-order Gauss-Markov model gives the worst fit. The first-order Gauss-Markov fits are close to those of the exponential cosine. Additionally, the model coefficients seem to be season independent, but change with geographical location.
2. NOAA TROPOSPHERIC DELAY MODEL
The US National Oceanic and Atmospheric Administration (NOAA) tropospheric corrections model has been developed by the NOAA Forecast Systems Lab (FSL) (Gutman et al. Reference Gutman, Fuller-Rowell and Robinson2003). The model is based on numerical weather prediction (NWP) models, where surface- and space-based meteorological measurements and others are combined into the model (Ahn et al., Reference Ahn, Lachapelle, Skone, Gutman and Sahm2006). The NOAA model estimates the zenith hydrostatic (dry) tropospheric delay as follows:

where, ZHD is the zenith hydrostatic tropospheric delay, H is the station orthometric height obtained from a digital elevation model (DEM), ϕ is station latitude and Psfc is the surface pressure given by:

where, Alt is the altimeter setting in mbar, which is calculated by using the surface pressure and the station height H from a geopotential surface that approximates the mean sea level, and

The NOAA model also estimates the zenith tropospheric wet delay from the integrated precipitated water (IPW) retrieved from the weather model as follows:


where, ZWD is the zenith wet tropospheric delay, T sfc is the surface temperature, T m is the weighted mean temperature of the atmosphere, R d and R v are the dry and wet air constants, respectively, and k 1, k 2, k 3 are refraction constants (see Ahn et al., Reference Ahn, Lachapelle, Skone, Gutman and Sahm2006 for more details).
NOAA has developed a software package that generates text files of hourly analyzed and 3-hour predicted zenith dry, wet and total tropospheric delays. The NOAA tropospheric delay software consists of a number of codes that interact to compute the dry, wet and total tropospheric delays as final products. More information about the software can be found at (ftp://aftp.fsl.noaa.gov/gpsmet/zwdgrids/tools).
3. EMPIRICAL COVARIANCE FUNCTIONS
As indicated earlier, daily data series of residual tropospheric delays obtained by comparing the new IGS tropospheric product with the NOAA ZTD were used to generate estimates of auto-covariance function (ACF) at different times and geographical locations. Assuming that the data represents a stationary random process, the unbiased ACF can be defined as:

where, τ is the lag or shift, x(i), i=0, 1, 2, …, N-1 is the data sequence with the mean removed, and N is the series number of points. As we deal with individual stations, we used the normalized ACF, which is obtained by dividing the ACF at lag τ and the ACF at zero lag.
Since the ZTD residuals time series are of limited length, the reliability of the estimated auto-covariances decreases as the lag increases. As such, we only used the first 10% of the auto-covariance estimates to develop the empirical auto-covariance function (El-Rabbany, Reference El-Rabbany1994).
Three functions have been tested as potential empirical covariance functions for the stochastic model. The best model was selected as the one with the least root-mean-square (RMS) error, in the least-squares sense. The first model is the first-order Gauss-Markov given by:

where, β is the unknown model coefficient (reciprocal of the correlation time), which can be determined using, for example, least-squares estimation, and τ is the time lag. The second model is the second-order Gauss-Markov given by:

where, β is the model coefficient (2·1461945/the correlation time), which again can be determined using the least-squares estimation, and τ is the time lag. The third model is the exponential cosine function given by:

where, β and α are positive quantities representing the unknown parameters of the model.
4. RESULTS AND DISCUSSION
A total of 1350 daily ZTD data series for the ten reference stations were generated from the new IGS and NOAA tropospheric correction products. The ZTD data series are distributed over many days of the year 2006, representing the various seasons (Figure 2). While the new IGS tropospheric delay product is generated at a 5-minute interval, the NOAA software package produces one record every hour for each of the ZHD, ZWD and ZTD. To generate ZTD residuals at a 5-minute interval, we interpolated all the NOAA-based ZTD series to 5 minutes using the Lagrange interpolation method. Figures 3 through 6 show examples of the NOAA-based residual tropospheric delay series (i.e., NOAA-based ZTD minus IGS-produced ZTD) for four days representing different seasons of the year.
Distribution of days processed for each station in the year 2006.

NOAA-based residual tropospheric delays at 8 stations for day 20 of the year 2006.

NOAA-based residual tropospheric delays at 10 stations for day 110 of the year 2006.

NOAA-based residual tropospheric delays at 10 stations for day 202 of the year 2006.

NOAA-based residual tropospheric delays at 9 stations for day 304 of the year 2006.

Figures 7 and 8 show the variations of the NOAA-based residual tropospheric delays for stations AMC2 and USNO over the year 2006. As can be seen in Figures 7 and 8, apart from a few spikes, the NOAA-based residual tropospheric delays can be considered to have no significant variations over the year. This indicates that the NOAA model accounts for the seasonal variations quite well. Consequently, a single stochastic model can be developed for a particular location, regardless of the time of the year. Investigation of the reason for the spikes in the NOAA-based residual tropospheric delays revealed that they exist as a result of bad records in the NOAA ZTD output. An example of such bad records is shown in Figure 9. As such, it is necessary that an outlier detection and removal mechanism be applied before using the data.
NOAA-based residual tropospheric delays over 117 days of the year 2006 for AMC2 station.

NOAA-based residual tropospheric delays over 101 days of the year 2006 for USNO station.

Example of bad records in the NOAA ZTD (day 75 of 2006, USNO station).

After data cleaning and linear trend removal, the estimated auto-covariance functions for the NOAA-based daily residual tropospheric delays were obtained using Equation (8). As indicated above, to avoid distortion at large lags, only the first 10% of the estimated ACFs were considered in developing the empirical auto-covariance function. Three functions were tested as potential empirical covariance models, namely the first-order Gauss-Markov, the second-order Gauss-Markov and the exponential cosine models. The coefficients of each of the models were determined through a least-squares fit to the estimated ACFs. Inspecting the RMS of the least-squares fit showed that the exponential cosine function gives the best fit most of the time for all the stations. The results of the first-order Gauss-Markov model were comparable to that of the exponential cosine model. The second-order Gauss-Markov model gave the worst results at all the times. Figure 10 shows an example of the three models LS fit for day 215 of year 2006 for JPLM station. Figure 11 shows the model parameter variation for each of the three models throughout the year 2006. The first parameter of the exponential cosine model has the least variation, while the parameter of the second-order Markov model has the highest variation. The second parameter of the exponential cosine model and the parameter of the first-order Gauss-Markov model were comparable. Table 1 shows the mean and standard deviation for each of the models' coefficients at all the stations.
Example of least-squares fit for first-order Gauss-Markov, second-order Gauss-Markov and exponential cosine for NOAA-based residual tropospheric delays (day 215 of 2006, JPLM station).

Example of model parameters throughout 2006 for NOAA-based residual tropospheric delays at station PRDS.

Mean and standard deviation (STD) of model parameters for NOAA-based residual tropospheric delays.

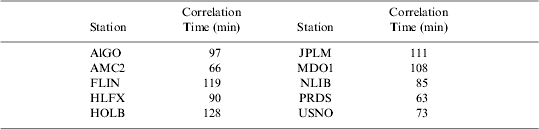
An advantage of the first-order Gauss-Markov over other models is its ease of use. Unlike other models, although stochastic modelling with the first-order Gauss-Markov process leads to a fully populated covariance matrix for the observations, its inverse is a block diagonal matrix (El-Rabbany and Kleusberg). This increases the efficiency of the estimation process. As such, without sacrificing the positioning accuracy, the first-order Gauss-Markov model should be adopted to stochastically model the NOAA-based residual tropospheric delay. As there are no significant seasonal variations in the NOAA-based residual tropospheric delay, a single (average) first-order Gauss-Markov model would be adequate for a particular location, regardless of the time of the year. Table 2 shows the average correlation times throughout the year for each station when the first-order Gauss-Markov is used. Examining the correlation times shows that model parameters are affected by the geographical location of the station to a certain degree. In addition, the stations can be clustered into three different groups (or regions), namely eastern, middle and western. The stations in each region have comparable model parameters (correlation times in the case of first-order Gauss-Markov). The average correlation time is in the order of 100 minutes, 75 minutes and 110 minutes for the eastern, middle, and western region, respectively.
Correlation times (minutes) for NOAA-based residual tropospheric delays.
5. CONCLUSIONS
Three empirical covariance functions have been tested to stochastically account for the NOAA-based residual tropospheric delays. The exponential cosine model was found to provide the best fit, in the least-squares sense, most of the time for all the stations. The performance of the first-order Gauss-Markov was somewhat comparable. The second-order Gauss-Markov model gave the worst results at all the times. Examining the parameters of the three empirical covariance functions shows that the stochastic characteristics of the NOAA-based residual tropospheric delays are largely season independent. To increase the efficiency of the estimation process without noticeable accuracy degradation, the first-order Gauss-Markov should be used. The NOAA-based residual tropospheric delays can be accounted for stochastically using the first-order Gauss-Markov model with correlation times of 100 minutes, 75 minutes and 110 minutes for the eastern, middle, and western North American regions, respectively.
ACKNOWLEDGMENTS
This research is supported in part by the Natural Science and Engineering (NSERC) of Canada, the GEOIDE Network of Centres of Excellence (NCE) and the Ontario Centres of Excellence (OCE). The authors would like to thank Seth Gutman and Susan Sahm of the NOAA Research-Forecast Systems Laboratory for providing NOAA model software and access to the model grid files FTP.



