Introduction
The age composition of Australia's population is projected to change considerably as a result of population aging (Australian Bureau of Statistics [ABS], 1991). Individuals over the age of 90 years are the fastest growing proportion of the population, with an increase of 88% (Australian Bureau of Statistics, 1991; 2001) between the 1991 and 2001 census. Over the next 25 years, females aged 95–99 years are estimated to increase by a factor of 5.8 compared to a factor of 2.0 for females aged 65–69 years. This is particularly true of the centenarians, the exceptional group of individuals who reach the age of 100 and beyond. According to the ABS (2006) census, there were 21,805 individuals in 95–99-year age group and 2,860 in the 100+ age group. It is estimated that there will be 12,000 centenarians in Australia by 2020 and 50,000 by 2050; the number of centenarians worldwide is estimated to increase 15-fold, to 2.2 million by 2050 (Richmond, Reference Richmond2008).
This demographic change poses twin challenges to researchers in that: (i) there is concern about the effects of this exceptionally old population on health and social systems, and (ii) they present an opportunity to examine the determinants of healthy aging and longevity. However, this population remains poorly researched. A few centenarian studies were started around the world in the last decade: the New England Study, the Georgian Study, the Dutch Study, the Danish Study, the Finnish Study, the Italian Study, the Heidelberg Study, and the Tokyo Study are the examples (Gondo and Poon, Reference Gondo, Poon, Poon and Perls2008). It is becoming apparent from these studies that assumptions based on findings from younger old groups (generally 70–85 years in most studies) are not necessarily true for centenarians. For example, contrary to estimates in the past that all 100-year olds would have dementia (Thomassen et al., Reference Thomassen, van Schaick and Blansjaar1998), reported rates of dementia in centenarians vary from 27% to 100%, with median rates being about 50% (Gondo and Poon, Reference Gondo, Poon, Poon and Perls2008). There are also centenarians who despite the presence of considerable neuropathology do not develop dementia during life, suggesting much brain reserve (Perls, Reference Perls2004).
There are many challenges in studying centenarians. Obtaining a representative sample is difficult because of errors in the recording of age, incompleteness of census and other data for this age group, frailty, sensory and cognitive deficits that reduce participation rates, and the fact that many centenarians live in aged care facilities with a variety of gatekeepers who limit access to them. In addition, there is a dearth of tools specifically designed for this population. Assessment of their cognition, for instance, poses major difficulties because of the sensory deficits, frailty, and lack of normative data. Yet assessment is important, as the determinants of exceptional cognitive aging may have lessons for the preservation of cognition generally.
The Sydney Centenarian Study (SCS) was designed to establish as representative a cohort of near-centenarians and centenarians as possible to address some of the issues raised above, with the main interest being in brain health. The major objectives are (a) to determine the “cognitive profile” of exceptionally old individuals (95+ years, hereafter “centenarians”); (b) to relate cognition in this age group to brain imaging parameters on MRI and to neuropathology in brain donors within the group; (c) to examine centenarians from neuropsychiatric, medical, nutritional, and lifestyle perspectives to establish a “centenarian phenotype”; and (d) to examine the determinants of “autonomy” in centenarians.
Methods
Sample
The approach was to recruit and comprehensively assess a cohort of individuals aged 95 years or above who are examined biannually and recruited into the brain donor program. The target sample size is n = 300 (250 in the 95–99 age group and 50 in the 100+ age group). The Australian Bureau of Statistics (2006) census indicated that in the Sydney region there were 4,082 people aged 95–99 and 639 people aged 100 and above. For this study, we targeted the following local government areas (LGAs): Randwick (6 men and 42 women identified in the census in this age group), Waverley (19 men, 88 women), Woollahra (26 men, 78 women), Botany Bay (3 men, 26 women), Kogarah (32 men, 38 women), Rockdale (31 men, 138 women), and Marrickville (20 men, 66 women) – all within 30-min driving distance from our center.
We used a multi-pronged approach to achieve comprehensive sampling, with the following strategies: (i) Addresses are obtained from the Australian Electoral Commission (AEC) and letters sent to targeted individuals with a reply-paid envelope and an expression of interest letter to participate or find out more about the study. It is compulsory for Australian citizens to be on the electoral roll, but permanent residents who are not citizens are not on this roll. Moreover, the addresses on the roll can be wrong, as changes in residence are often not recorded. (ii) The AEC database is cross-checked and supplemented with the Medicare Australia data to increase the accuracy of the addresses. All citizens and permanent residents of Australia are covered by a universal Medicare scheme, but these lists are safeguarded for privacy and cannot be the primary source of sampling. (iii) We mount media campaigns for recruitment through community newspapers and the local radio. (iv) We approach directors of residential aged care facilities (RACFs) to pass on information about the study to potential participants and/or their family members/caregivers. (v) We monitor hospital and outpatient aged care service contacts for potential participants and approach them for consent. (vi) We attend meetings of senior citizens’ organizations in the areas of interest to publicize the study, and encourage members to speak to their parents, uncles, and aunts about the study. (vii) We leave information about the study in private physicians’ surgeries in the area. (viii) We have identified individuals who are in the 95+ age group and have agreed to participate in the 45 & Up Study being conducted in NSW (n = 146 at the last survey). (ix) We approach participants from our large, longitudinal Sydney Memory and Ageing Study, being conducted in three of these electorates as they reach 95+ years.
Representativeness of the sample
The seven LGAs selected for the study were chosen because of their proximity to the research center, reflect a considerable variation in sociodemographic characteristics, and collectively form a reasonable representative subpopulation of the wider Australian population. Averaged across these LGAs, the median age, percentage of people over 65 years, percentage born in Australia, and median household income (36 years old, 13.9%, 52.9%, and $1271.70 per week, respectively) are broadly comparable with the values in the wider Sydney region (35 years, 12.3%, 60.4%, and $1154.00, respectively), within New South Wales (37 years, 13.8%, 69%, and $1036, respectively), and in the whole of Australia (37 years, 13.3%, 70.9% and $1027, respectively), with the exception that more people in these LGAs were born outside Australia. This variable will be examined as a covariate in some of our analyses. Furthermore, those who decline to participate are requested to provide minimal information about their residential status, major medical conditions, a diagnosis of dementia, and functional independence. In our experience, the majority of respondents (or their next of kin) agree to provide this information. This permits an accurate evaluation of the extent of any sampling bias and allows statistical adjustments to be made if any such bias is found to exist.
Inclusion and exclusion criteria
The study includes individuals aged ≥95 years who agree to participate, except those suffering from a terminal illness. Those unable to consent are included if they do not express an objection, and their next of kin consent to their participation. Those acutely ill but willing to participate will have their assessments postponed until recovery from acute illness.
Proof of age
There is evidence that self-reported age recorded in the census is not always accurate. We seek a birth certificate, and failing this, we use multiple other sources as corroborative evidence: old passports, military certificates, school reports, baptismal or other church certificates, marriage certificates, birth dates of children and siblings (if any), and other such documents. Documents most proximate to the likely date of birth are given greater salience in the determination of age. Discrepancies in documents are resolved with additional information.
Consent
The research assistant explained the nature and objectives of the study to the prospective participant on the first visit, speaking slowly and carefully, with visual and/or auditory aids in place, to ensure that the information was understood. The consent form was read out if the participant could not read due to visual impairment. This was done in the presence of a next of kin or a caregiver, or a residential facility staff member, who was also able to ask any questions. Written informed consent is obtained from participants whenever he/she is considered competent. If judged to be unable to consent, proxy consent is obtained from the nearest next of kin. In all cases, next of kin are kept informed and their concerns are addressed. The study has been approved by the ethics committees of the South Eastern Sydney and Illawarra Area Health Service and the University of New South Wales.
Comparison groups
We have the use of the following three younger control samples already assessed by our group: (i) The Sydney Memory and Ageing Study sample, aged 70–90 years (n = 1,037) recruited from Eastern Sydney who have been comprehensively assessed by our group in 2005–2007 and are being followed up at two-year intervals (Sachdev et al., Reference Sachdev2010). Methodological harmonization, such that many of the instruments used in the two studies overlap, is attempted to enable comparisons. (ii) The Personality & Total Health (PATH) Through Life Study 60+ sample (total n = 2,500) aged 60–64 years, who were assessed in 2001–2002, 2005–2006, and 2009–2010, and will continue to be assessed at four-year intervals (Cherbuin et al., Reference Cherbuin2009). A subgroup (n = 478) had a more comprehensive assessment, including magnetic resonance imaging (MRI) scans and blood samples for genetics, proteomics, and biochemistry. (iii) The PATH Through Life Study 40+ sample (total n = 2,530) aged 40–44 years, who were assessed in 2000–2001, 2004—2005, and 2008–2009. A subgroup (n = 454) had a more comprehensive assessment, including MRI scans and blood samples for genetics, proteomics, and biochemistry during Wave 2 and were reassessed in Wave 3 (Wen et al., Reference Wen, Sachdev, Li, Chen and Anstey2009).
Participant-based assessment
This comprises a neurocognitive, psychiatric, and medical assessment which was conducted in the participant's (P) home, kept brief, split up into multiple sessions, carried out in the presence of younger family members, and with adaptation of stimuli to overcome sensory limitations. A knowledgeable informant (Inf), who has had regular contact with the participant for a number of years, is recruited. The assessment is performed in the following stages:
Introductory visit
An initial visit by the research assistant helps introduce the study, obtain consent from the P as well as caregiver/next of kin, and obtain some demographic information. Some open autobiographical questions are used to help establish a relationship with the P. Commitment to the study is assessed.
Phase 1 (brief cognitive) assessment:
This comprises the following:
1. Demographics: Age, sex, living circumstances, marital status, number of offspring, family tree, care arrangements, education, occupation, current medications.
2. Medical history questionnaire based on report of P and Inf, and available documents; list of current medications.
3. Questions about subjective cognitive problems.
4. The Addenbrooke Cognitive Examination – Revised (ACE-R): A brief cognitive test battery to differentiate Alzheimer's disease and frontotemporal dementia (Mathuranath et al., Reference Mathuranath, Nestor, Berrios, Rakowicz and Hodges2000), which includes the Folstein Mini-Mental State Examination and Clock Drawing.
5. The GP-Cog as a 6-item instrument to screen for dementia (Brodaty et al., Reference Brodaty2002).
6. Brief physical examination: Gait and balance, and vision (Snellen's chart and near vision chart) and hearing (self-rating) assessments. We measure blood pressure (lying and standing × 2) with an OmronR automatic blood pressure monitor, and lung function (Forced Expiratory Volume, 1st second; FEV1) (Gardner et al., Reference Gardner1986) using a portable spirometer. Current weight and height are recorded and BMI calculated. Heart rate and irregularity of pulse (for atrial fibrillation) are noted. For physical strength, we conduct a Sit-to-Stand measurement, which correlates well with measures of falls and balance (Bohannon, Reference Bohannon1995). We also measure Timed Up & Go, which measures functional mobility, and correlates with measures of activities of daily living (ADL), balance, and gait speed in older people (Podsiadlo and Richardson, Reference Podsiadlo and Richardson1991), and grip strength, which has been used as a measure of physical health in older people, including the oldest-old (Frederiksen et al., Reference Frederiksen, Hjelmborg, Mortensen, McGue, Vaupel and Christensen2006; Jeune et al., Reference Jeune2006).
7. Dietary questionnaire (1 page).
8. Consent to proceed to Phase 2.
Phase 2 (in-depth neuropsychological) assessment:
Our pilot work has helped develop this battery, usually administered in one sitting with breaks, but may be extended to two sittings. Adaptations to test materials were made for sensory deficits, e.g. enlargement of visual materials, as in words on the National Adult Reading Test (NART) and MMSE (close your eyes) and dot counting and degraded letters on ACE-R.
1. Memory: Administration of the Hopkins Verbal Learning Test – Revised (Brandt and Benedict, Reference Brandt and Benedict2001) allows for assessment of learning, recall, and recognition.
2. Attention/processing speed: Mental control task from WMS-III (Wechsler, Reference Wechsler1997a); “Walking and Talking Test,” which is a dual task measure allowing assessment of the effect of a cognitive task (counting backwards) on walking speed, and walking on performance of counting task.
3. Visuospatial functioning: ACE-R pentagons and cube (Mathuranath et al., Reference Mathuranath, Nestor, Berrios, Rakowicz and Hodges2000); clock-drawing (done in Phase 1).
4. Language skills: The Boston Naming Test (15-item version; Kaplan et al., Reference Kaplan, Goodglass and Weintraub2001); naming of real items from ADAS-Cog (tactile naming in visually impaired; Rosen et al., Reference Rosen, Mohs and Davis1984); category fluency from ACE-R (Mathuranath et al., Reference Mathuranath, Nestor, Berrios, Rakowicz and Hodges2000).
5. Perceptual: ACE-R dot counting, degraded letters (done in Phase 1).
6. Executive function: Similarities Test from WAIS-III (Wechsler, Reference Wechsler1997b); Trail Making Test A and B (oral version; Ricker and Axelrod, Reference Ricker and Axelrod1994), which evaluates the ability to switch response set unhindered by perceptual or psychomotor problems; Clock Drawing Test for organization and planning (in ACE-R, Phase 1); Phonemic fluency (FAS) using the Controlled Oral Word Association Test (Benton, Reference Benton1967).
7. Practical problem-solving: Everyday Problems for Cognitively Challenged Elderly (Willis, Reference Willis1993), which evaluates the ability to solve problems related to tasks of daily living using printed stimulus materials. We use a version adapted to Australian situations, assessing three domains of daily living (medication use, phone and household, and meal preparation and nutrition).
8. Premorbid function: NART (Nelson and Willison, Reference Nelson and Willison1991).
Consent for Phase 3, MRI scan, blood or saliva sample, and brain donation is obtained at the time of Phase 2 assessment.
Phase 3 assessment:
1. Autobiographical memory: We interview Ps for personal details at specific critical time periods throughout life, and rate these for amount of details. This method has been used previously with older adults (Maguire and Frith, Reference Maguire and Frith2003), and we have abbreviated it for our centenarians.
2. Psychiatric Assessment: Participants are asked to complete the 15-item Geriatric Depression Scale (Sheikh and Yesavage, Reference Sheikh, Yesavage and Brink1986) to assess mood and the Short Form 12-item health survey (SF-12; Ware et al., Reference Ware, Kosinski and Keller1996) for overall mental and physical well-being.
3. Activity levels: We assess mental, physical, and social activity levels currently and at the age of about 40 years using an adaptation of the Lifetime of Experiences Questionnaire (Valenzuela and Sachdev, Reference Valenzuela and Sachdev2007).
4. The Satisfaction With Life Scale (SWLS) is used (Diener et al., Reference Diener, Emmons, Larsen and Griffin1985).
Informant-based assessment
Each P has an informant who must have at least weekly contact with the P. They provide the following information:
1. Confirm demographic details, including family tree and ages of first-degree relatives (current or at time of death). Obtain further supportive evidence on P's date of birth, if necessary.
2. The Informant Questionnaire on Cognitive Decline in the Elderly (IQCODE: Short Version) measures cognitive change over time (over previous five years in our study; Jorm et al., Reference Jorm, Scott and Jacomb1989).
3. We investigate everyday functioning with ADL; Lawton and Brody, Reference Lawton and Brody1969) and Bayer-Instrumental Activities Of Living (B-IADL) (Hindmarch et al., Reference Hindmarch, Lehfeld, de Jongh and Erzigkeit1998) questionnaires. We note whether deficits are due to physical or cognitive limitations.
4. The Clinical Dementia Rating (CDR) Scale (Morris, Reference Morris1993) - structured questions to informant.
Utilization of health services
To guage the utilization of health services, the number of Medicare-funded consultations is obtained from the Health Insurance Commission after obtaining informed consent. We plan to link this study to the Centre for Health Record Linkage (CheReL; http://www.cherel.org.au), the NSW health records linkage system. We use RUD Lite (Wimo and Winblad, Reference Wimo and Winblad2003) to assess service utilization.
Brain scans
Eligible subjects who consent and are able to travel to the Prince of Wales Hospital, Randwick, are scanned on a 3T Philips MRI scanner using the following protocol: T1-weighted 3D acquisition of whole brain with 1.0-mm isometric voxels; T2-weighted fluid attenuated inversion recovery (FLAIR) whole brain 3-mm axial slices with no gaps; 32 directions diffusion tenor imaging (DTI) of whole brain; and resting state functional MRI (fMRI). Total time: 30 min. We have an acceptance of MRI by about 1 in 10 (n = ~30 scans). The minimal data set is the T1-weighted volumetric set and the FLAIR images, which can be acquired in 15 min. Ps can indicate distress while in the scanner and abandon the scan at any time. Our pilot work suggests that a P is able to complete 20–30 min of scanning without distress. Images are de-identified, transferred to a Dell Pentium IV workstation, reconstructed, and re-sliced using Analyze® software (Biomedical Imaging Resource, Mayo Clinic, Rochester, MN, USA). Volumes of the hippocampus, entorhinal cortex, parahippocampal gyrus, and temporal neocortex are obtained using a standard tracing protocol. Automated segmentation of scans will allow calculation of total gray matter, white matter, cerebrospinal fluid (CSF) and intracranial volumes, and derivation of ventricular–brain ratio (VBR). Diffusion Tensor Imaging (DTI) in 32 directions for whole brain will yield fractional anisotropy maps and permit fiber tracking. White matter hyperintensity (WMH) volumes and topography are obtained from FLAIR images using supervised but automated segmentation procedure with an in-house developed software.
Blood collection
A blood sample is collected to test for reversible causes of dementia, investigate correlates of cognitive function (full blood count, clinical chemistry screen, thyroid stimulating hormone, fasting cholesterol and triglycerides, homocysteine, iron, Vitamins B12, C, and E, folic acid, luteinising hormone, and follicle stimulating hormone), and for DNA extraction using standard methods in the Genetics Repository Australia. Analysis for Apolipoprotein E polymorphism is performed. A genome-wide analysis of single nucleotide polymorphisms has been performed using the Illumina Omni Express microarray (Illumina Inc, San Diego, CA, USA).
Follow-up assessment
We repeat neuropsychological and medical assessments at six-month intervals to determine change over time and the rates of incident dementia. Repeat MRI scans are performed in those willing to do so. We expect an attrition rate of 30% to 40% per year due to death or infirmity.
Brain donation and neuropathology
A brain donor program for the participants is linked to the Sydney Brain Bank, using established protocols (Halliday et al., Reference Halliday2002). We anticipate 20 brains to be donated during the period of the study and in the following year. Amyloid load will be determined by measuring the density (N/mm2) and area fraction (Aplaque/Atotal) of plaques on Aβ-stained sections. The ratio of neuritic and diffuse plaques will be determined on silver-stained sections. Neurofibrillary tangle density will be determined for both intracelluar and extracellular tangles on silver-stained sections using established unbiased methodology. For cerebrovascular disease, the Esiri (Reference Esiri2000) system of microscopic assessment of haematoxylin and eosin slides will be used in the regions of interest and whole-brain macroscopic assessment will be based on gross vascular disease ratings.
Data analysis
Diagnosis
All neuropsychological, functional, and medical data are taken into consideration, determination of “cognitive impairment” is arrived at by consensus using our established rules, and dementia is diagnosed using standard criteria. Because of the sensory deficits and frailty of many of these participants, test performance cannot always be taken at face value. The research assistant administering the tests therefore presents all cases in which there is concern about performance to the consensus panel, and a decision is made about the acceptance or otherwise of some measures. This happened in 28% of cases, and clinical judgment was used for the interpretation of neuropsychological test results. Since a majority of individuals in this age group are impaired, statistical norms are not meaningful to decide impairment. Using available norms in younger cohorts (70–90 years), we have decided on levels of performance that indicate “within acceptable limits” functioning. A CDR score is generated from a review of all available data. Given the uncertainties of interpretation of performance in this age group, each case is brought to a consensus meeting attended by a neuropsychiatrist, a psychogeriatrician, and a neuropsychologist, along with research staff if any of the following applies: (i) sensory impairment is judged to have compromised the assessment; (ii) data are incomplete because of frailty or refusal to complete all aspects of the assessment; (iii) the informant is judged to not be very knowledgeable; (iv) there is an obvious discrepancy, as judged by the study coordinator, between neuropsychological test performance and reported functional level. In addition, 10% of the participants are randomly brought in for consensus. Altogether, about 50% of the participants were so reviewed. Autonomous function is characterized by preserved ADLs, good cognitive function, and good psychosocial function, as described elsewhere (Katz et al., Reference Katz, Downs, Cash and Grotz1970). For a diagnosis of dementia, both cognitive impairment suggestive of a significant decline, as well as functional impairment, must be demonstrated with the following cut-off scores as general guidelines: MMSE < 24; ADL > 7; BADL ≥ 3; Short IQCODE > 3.31; and CDR item 4 (home and hobbies) (CDR4) ≥ 1. For inter-group comparisons, centenarians will be divided into two groups according to age (95–99 and 100+ years) or cognitive status (impaired and unimpaired). Their neuropsychological test performances will be compared with the younger cohorts, which can be divided into 60–64, 70–79, and 80–90 years from the PATH Through Life and the Sydney Memory and Ageing studies of our group, with some complementarity of tests. Change over one year will be determined in a repeated measure analysis of variance for decline in cognitive function. Rates of incident dementia will be calculated using a consensus approach to diagnosis as well as predetermined criteria.
Results
A profile of the first 200 participants is provided.
Sociodemographic characteristics
The age of the participants ranged from 95 to 106 years (mean 97.4 years), and 59 (29.5%) were men. They had a mean education of 10.20 years. Status of current dwelling was as follows: private dwelling in community, n = 111 (55.5%); private dwelling within a retirement village, n = 6 (3%); low-level care accommodation for retired individuals, n = 37 (18.5%); and nursing home, n = 46 (23%). The large majority of participants (90%) were recruited by means of letters sent on the basis of the electoral roll or Medicare list, and the remaining through other strategies. To examine the representativeness of the sample, we compared the participants in the study on sociodemographic characteristics with census data for the same geographical area obtained from the Australian Bureau of Statistics (2006). The proportion of females was slightly lower than that in the ABS data (70.5% vs. 78.5%; p = 0.023). In terms of age distribution, the SCS sample had a higher proportion of individuals in the 100+ age group (18.0% vs. 13.4%), but this difference was not statistically significant (p = 0.110). The proportion of participants that lived in private dwellings in the SCS sample (58.5%) was very close to that in the ABS data (58.1%).
Health characteristics
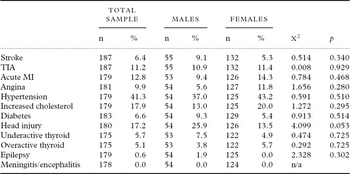
Past stroke was reported by 6% and transient ischemic attacks by 10.5% of the participants. Cardiac arrest was reported by 11.5%, while 9% reported cardiac angina. Hypertension was the most common vascular risk factor, with 37% of the sample having previously been diagnosed with hypertension. The rate of previously diagnosed diabetes mellitus was 6%. While 58.5% of the sample had never smoked, 27.5% had smoked regularly in the past. At the time of the assessment, no one was smoking. Low rates of angina were reported by both men (5.6%) and women (11.8%). Men reported a significantly higher incidence of head injury (25.9%) than women (13.5%, p < 0.05). Only one participant reported a history of epilepsy. A slight to moderate impairment in their hearing, with no sex differences, was reported by 63.6% of the sample. One-half of the sample wore hearing aids, the majority wore glasses (66.2%), and there were no significant differences between males and females (p = 0.715). With corrected vision, 75.6% of the sample had near-reading acuity of N8 or below. In relation to alcohol use, 38.5% of the sample had completely abstained within the last year. Of the 52.5% of participants who identified themselves as drinkers, an association between sex and alcohol consumption was found (p = 0.046). The proportion of females that were teetotallers (49.2%) was greater than that for males (25.9%, p = 0.005). Males were found to be heavier drinkers than females (59.3% vs. 32%, p = 0.001).
The medical histories of men and women in this sample are described in Table 1, along with the number of data points for each condition.
Medical history of participants

Note: TIA: transient ischaemic attack; MI: myocardial infarction.
Cognitive status
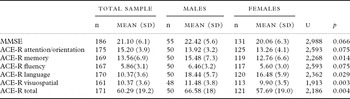
Fourteen participants were too impaired to complete the MMSE. The mean pro-rated MMSE score on the remaining 186 was 21.10 (SD 6.1) with men tending to score higher than women (22.42 vs. 20.06, U = 2,988, p = 0.06). Performance on the ACE-R (n = 175) similarly indicated that men performed significantly better than women (p = 0.015) and that these differences in performance were attributable to their better performance on the subscales of language (p = 0.003) and visuospatial abilities (p = 0.006). Further details on the subscales of the ACE-R are provided in Table 2. The mean score on the Short IQCODE was 3.70 (SD 0.73) with no significant sex difference.
Cognitive status of the sample

Note: ACE-R: Addenbrooke Cognitive Examination–Revised; MMSE: Mini-Mental State Examination.
Functional status
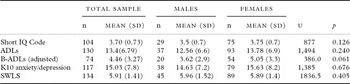
The mean ADL score was 13.4 (SD 6.8), indicating limitation of daily functioning in these individuals, with the cut-off for impairment generally being >7 (Lawton and Brody, Reference Lawton and Brody1969). Similarly, the cohort commonly experiences difficulties in IADL, with the mean score being 4.46 (SD 3.3), with the usual cut-off being ≥3 (Folquitto et al., Reference Folquitto2007). There were no significant sex differences in ADL scores (Table 3).
Functional and emotional status of the sample

Emotional status
On the K10 Psychological Distress Scale, the participants scored a mean 15.03 (±7.8) with no significant sex difference, with a score <20 indicating lack of psychological distress. The participants showed high satisfaction with life, scoring a mean 5.91 (±1.41) out of a maximum of 7, with no sex differences (Table 3).
Rates of dementia
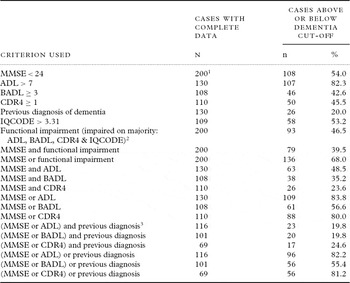
Of the 186 participants with MMSE data, 94 scored <24; the remaining 14 were too impaired to complete even a portion of the MMSE and were diagnosed to have dementia. The MMSE cut-off therefore gave a rate of 54% with dementia in this sample. Since the diagnosis of dementia typically requires cognitive as well as functional impairment, a functional index was calculated based on the information from four measures (ADL > 7, Bayer-IADL ≥ 3, CDR4 ≥ 1, and Short IQCODE > 3.31). Thirty-seven cases had all four measures, 83 had three, 29 had two, and 51 had only one measure available. An individual was considered impaired if he/she was below the threshold of impairment on more than half the measures available. Individuals with only one measure had to be impaired on it to be classified as impaired. For those with exactly one-half of available measures impaired (24 cases), all available information was examined by a panel of investigators and a classification given. Based on these criteria, 93/200 (46.5%) were considered to be functionally impaired, 79/200 (39.5%) were impaired both on the MMSE and functional measures, and 136 (68%) were impaired either on the MMSE or the functional measures. Putative rates of dementia based on other criteria are listed in Table 4. It is noteworthy that only 26 (20%) had been previously diagnosed with dementia from a sub-sample of those with available information (n = 130).
Putative rates of dementia in the centenarian cohort when different criteria were applied for the diagnosis of dementia

Notes: 1MMSE could not be performed in 14 cases who were too impaired to complete even a few items; all were diagnosed as dementia; in five of these cases, IQCODE was also missing, but dementia was not in dispute.
2The binary variable, “Functional impairment,” was derived using all available information from the four measures, MMSE, ADL, BADL, and IQCODE. Function was coded impaired if participants were impaired on more than half of the available (i.e., a majority vote based on whatever measures were available for each case). For those with exactly half of the available measures impaired (24 cases), all available information was examined, and a classification was given by the panel.
3Previous diagnosis of dementia by a medical practitioner and reported by an informant. There are four cases that were previously diagnosed with dementia that are not impaired on both MMSE and function. Three of these are impaired on MMSE but not function, and one is impaired on function but not on MMSE.
Discussion
This is the first Australian study to characterize the health and cognitive profiles of exceptionally old individuals in detail. The study aims to establish a cohort of centenarians and near-centenarians, with a target of 300 participants. This paper describes the methodology used in the study and the profile of the first 200 as a preliminary report. Recruitment is ongoing with 280 individuals now having been enrolled.
The study has attempted to address many of the challenges posed by centenarian research (Sachdev et al., Reference Sachdev, Levitan and Crawford2012). The foremost challenge was to obtain a representative sample. The study has tried to meet this challenge by identifying a discrete geographical region, as defined by seven electoral districts in Sydney, and using multiple strategies to identify as many centenarians and near-centenarians as possible. The search began by identifying potential participants in the electoral roll, as enrolment with the Australian Electoral Commission is compulsory for Australian citizens. However, owing to the inaccuracy of the electoral roll, the names were supplemented by the Medicare data, which is more accurate and includes non-citizens, as there is universal Medicare coverage in Australia, but lists by place of residence are not available to researchers. The mailing to potential participants was therefore done through Medicare. About 90% of the participants were identified by the above two strategies. Further strategies used were word-of-mouth, newspaper articles and community forums, hospital admissions in the area, and referrals by geriatricians and psychogeriatricians. Rates of refusal by those approached were limited, and generally due to the family acting as gatekeepers and declining participation of the centenarian. While complete representativeness cannot be assured in any such study, we believe that the cohort is a very good representation of the population of interest, as noted above.
The second challenge of recruitment was the ascertainment of age of the participants. The primary documents used for this purpose were birth certificates (18%), passports (23%), and drivers’ licenses (12%). The study did not rely on one source of information, but decided to use multiple, convergent, and validated sources, which in addition to the above included early school records, marriage certificates, children's birth certificates, and other evidentiary material. When there were discrepancies between different sources, these needed to be satisfactorily resolved before the individual could participate in the study.
This is a longitudinal cohort with assessments occurring at six-month intervals for one year with plans for annual assessments thereafter. The reason for more frequent assessments initially is to reduce survivor bias caused by death or serious illness leading to withdrawal, but six-month assessments are difficult to sustain indefinitely because of cost as well as practice effects on various tests for cognitive assessments. Hence, the decision to make the assessment annual after the first year, with a telephone follow-up at 18 months. The longitudinal design permits the examination of change in both physical and mental health and determination of incident dementia. Because of the limited number of centenarians in the geographical catchments, it was decided to include anyone >95 years, not only because the use of the “100” cut-off is somewhat arbitrary from a biological viewpoint but also the duration of the study would permit many of the near-centenarians to become centenarians.
For a comparison group, we draw upon other studies within the Brain and Ageing Research Program run by the Centre for Healthy Brain Ageing (CHeBA) at the University of New South Wales, which covers the entire range of middle and late adulthood, from 40–90 years, and of which this study will be a part. Since we have studied populations in the 40s, 60s, 70s, and 80s in great detail, we have comparative data to examine aging from a cross-sectional perspective. The longitudinal nature of our studies also permits examination in a prospective manner. During the course of this study, the Sydney Memory and Ageing Study (MAS) cohort will extend to 95 years, thereby giving us a sufficient number of subjects in the age bands 85–90, 90–95, 95–100, and 100–105 years for comparison. Since some of the neuropsychological measures in the two studies are different, the participants graduating from the MAS to the SCS receive additional measures, such as the ACE-R, to ensure harmonization.
The SCS is a quantitative study with validated measures being used. These, however, present a number of challenges owing to the presence of frailty, medical illnesses, mobility problems, cognitive and sensory impairment, etc. Assessments are often carried out in the centenarian's place of residence, which also provides an opportunity to assess other aspects of the participant's lifestyle and ADL. Assessment of centenarians demands patience, and the testing material has to be adapted to their particular deficits, such as slowed movement and mentation as well as hearing and visual impairments. Psychometric tests may need to be adapted by providing, for example, large print or a reading glass for reading tests, shorter questionnaires, assistance with self-report questionnaires, etc. Flexibility in scheduling and adapting tasks to the individual, and keeping the assessments brief are crucial elements for success. In spite of these efforts, incomplete data are a frequent occurrence and imputation strategies have to be used or other strategies adapted. In this study, 14 participants were too impaired to complete enough items on the MMSE to permit imputation. One or more functional measures were missing for the majority, and performance on four measures had to be considered to be able to categorize functionality.
The diagnosis of dementia in this age group is of particular interest. The scoring and interpretation of neuropsychological and functional ability tests pose many challenges. While the instruments used have been extensively used in older populations, their application in the exceptionally old has been limited, except perhaps for the MMSE and ACE-R. Normative data for these tests are generally developed on younger populations, and centenarians may perform poorly on these measures due to frailty, physical, or sensory deficits, thereby placing them at a disadvantage. Aging is also associated with slowing of psychomotor speed, which is likely to affect performance on all timed tests, and indeed even some non-timed tests. Functional measures, such as the use of a measure for ADL, may therefore be a more representative measure of ability than actual performance on cognitive tests. In our sample, 54% were below the cut-off on the MMSE and 46.5% had a functional impairment, with 39.5% showing both. Different rates resulted from the application of different criteria, which is understandable. It does appear that the majority had shown a decline in the previous five years, with a mean Short IQCODE score of 3.7, but many individuals had good functioning levels and lived independently in private dwellings, with many engaging in activities outside their homes, including volunteering to help others.
There has been some debate whether dementia is inevitable at an advanced age, with one small study (Blansjaar et al., Reference Blansjaar, Thomassen and Van Schaick2000) reporting that all 17 centenarians in a small Dutch town had dementia. The lowest reported rate was 27% from a Swedish study (Samuelsson et al., Reference Samuelsson1997), but after taking non-participants into consideration, the rate was estimated at 42%. The majority of studies have reported dementia rates in centenarians between 45% and 65% (Gondo and Poon, Reference Gondo, Poon, Poon and Perls2008), with an approximation that one in two centenarians has dementia. While our sample is younger (mean age 97.4 years), the rates are consistent with this finding. It is reasonable to conclude that dementia is not inevitable in centenarians. Whether supercentenarians (≥110 years old) will inevitably have dementia is also disputed. A Japanese study of individuals >104 years (n = 7) reported that all had dementia. Robine and Jagger (Reference Robine, Jagger, Finch, Robine and Christen2003) assessed seven supercentenarians (mean age 116.9 years) and from the ability of some of them to engage in meaningful conversation, concluded that it is possible to be non-demented at the age of 115 years. The longest-living person on record, Mme Jeanne Calment, was assessed neuropsychologically at the age of 118 and found to be not demented and a person with quick wit (Ritchie, Reference Ritchie1995).
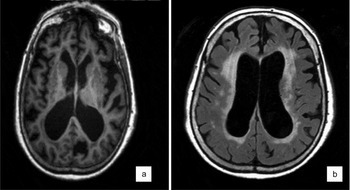
In summary, the SCS addresses some important questions about aging at the extreme end of life, despite the many challenges of assessing very old and often frail individuals. It provides further supportive evidence that dementia is not inevitable with aging, even though decline in some functions is observed in almost all individuals. We expect that in the future, the study will identify factors that determine autonomy in this group and, considering the growing number of individuals in this age group, this will have important implications for service planning and care delivery. As some of the participants have undergone brain imaging and also enrolled in a brain donor program, the study will provide information about the gross and microscopic structure of the brain at this age, as well as the presence of pathology (Figure 1). It will also help establish a cohort for future studies of longevity genes, and gene–environment interaction in healthy aging. This study is therefore important for the determination of health care needs of the growing population of centenarians.
Two transaxial slices from the MRI brain scan of a 101-year-old female participant with dementia (MMSE score 19/30) showing (a) moderate generalized brain atrophy, and (b) extensive white matter hyperintensities. (a) T1-weighted; (b) FLAIR (fluid attenuated inversion recovery sequence).

Conflict of interest
None.
Description of authors’ roles
Perminder S. Sachdev designed the study, obtained funding, supervised data collection, and prepared the first draft of the manuscript; Charlene Levitan coordinated data collection and performed initial analysis; John Crawford performed statistical analysis; Mamta Sidhu performed data collection; Melissa Slavin helped in study design, obtaining funds, and supervision of data collection; Robyn Richmond helped in study design, obtaining funds, and supervision of data collection; Nicole Kochan helped in study design and supervision of neuropsychological data collection; Henry Brodaty helped in study design, obtaining funds, and supervision of data collection; Wei Wen helped in study design, obtaining funds, and supervision of the neuroimaging component; Kristan Kang helped in data management and analysis; Karen A. Mather helped with genetic data analysis. Other team members included Angela King, Zixuan Yang, and Phillipa Williams.
Acknowledgments
Many research assistants and administrative assistants contributed to data collection. DNA samples were extracted by Genetic Repositories Australia, an Enabling Facility, which is supported by a National Health & Medical Research Council of Australia grant no. 401184. The APOE genotyping was performed by Drs Arezoo Assareh and Karen A. Mather under the supervision of Professor Peter Schofield and Dr John Kwok at the Neuroscience Research Australia (NeuRA), Sydney, Australia. Angie Russell and Kate Crosbie assisted in manuscript preparation. We thank the participants for their enthusiastic support. This study was supported by the National Health & Medical Research Council of Australia (project grant ID 630593 and program grant ID 568969) and the University of New South Wales Gold Star Award to Melissa Slavin.