


Introduction
Blood cultures (BC) are the cornerstone of diagnosing blood stream infections, allowing for timely identification of pathogens and antimicrobial susceptibility testing. The initial diagnosis and assessment of bacteremia in adults conventionally includes 2 sets of BC bottles (1 aerobic and 1 anaerobic bottle per set). Follow-up cultures (FUBC) are generally indicated to document clearance following a positive initial BC, as persistently positive blood cultures could suggest a lack of source control, antimicrobial resistance, metastatic infection, or antimicrobial failure for other reasons. Reference Ong, Luo and Fridman1 Certain clinical scenarios and organisms have morbidity and mortality benefits from documenting clearance on repeat cultures, such as bacterial endocarditis, Reference Baddour, Wilson and Bayer2 febrile neutropenia, Reference Kimura, Gomyo and Hayakawa3,Reference Canzoneri, Akhavan, Tosur, Andrade and Aisenberg4 and infections with Staphylococcus aureus, Reference Liu, Bayer and Cosgrove5 multidrug resistant gram-negative rods (MDR-GNR), Reference Shinohara, Hanai, Jung, Song, Iwata and Terasawa6 and Candida species. Reference Pappas, Kauffman and Andes7 However, when patients have clinical improvement and source control, the value of FUBCs is less clearly defined. Two sets of FUBCs are also frequently ordered following prior negative blood cultures in patients with new or worsening concern for sepsis, although the optimal frequency of monitoring patients with prior negative cultures is not well demonstrated. Reference Tabriz, Riederer, Baran and Khatib8–Reference Rosenblum, Lin, Kim and Levy10 FUBCs are also sometimes sent for routine surveillance or as part of standing orders without clinical indication. The inappropriate ordering of FUBCs may lead to patient harm due to increased contamination rates, antimicrobial overuse, and anemia. Additionally, false-positive results can increase length of stay by thousands of patient-days and cost several million dollars per year to a healthcare network. Reference Coburn, Morris, Tomlinson and Detsky11–Reference Zwang and Albert13
In July 2024, a major manufacturer of blood culture bottles, Becton, Dickenson and Company, announced a severe nationwide shortage of BC bottles. Reference Beddard14 We leveraged this shortage as a quality improvement opportunity to introduce sustainable long-term interventions to steward this valuable diagnostic resource. Our Specific, Measurable, Achievable, Relevant, and Time-bound aim was to reduce the overall use of FUBC by 10% between April 14, 2024 and August 3, 2024, compared to a preintervention period of August 4, 2024 to November 23, 2024.
Methods
Context
We performed a quality improvement study at our network of 2,600 beds across 8 academic and community hospitals in New York, including all age groups and all clinical settings (eg, inpatient, outpatient, and emergency departments), excluding two internal medicine floors undergoing a separate BC stewardship pilot program. At our institutions, there was general guidance on the hospital intranet when to order blood cultures, but there were no restrictions on ordering blood cultures. All the hospitals share the same electronic health record (EHR) and blood cultures were processed in our own hospital laboratories. A series of Plan-Do-Study-Act (PDSA) cycles were developed by our diagnostic stewardship workgroup including hospital epidemiologists, informaticists, pharmacists, and microbiologists. The intervention period was defined as beginning the first week after completion of PDSA Cycle 1 (August 4, 2024).
Data collection and definitions
We used the Model for Improvement to define our aims and measures. We collected data on blood culture results, ordering details, patient demographics, BPA responses, and patient clinical data including hospital admission and discharge dates and patient vital status at discharge over the study period for all sites within our network. Initial blood cultures were defined as the first set of blood cultures ordered in a patient’s hospitalization, while FUBC were defined as any blood cultures ordered after the initial sets in the same hospitalization. FUBC were considered “paired sets” if 2 or more sets were ordered within 5 minutes of each other and were otherwise considered “single sets.” Blood culture contaminant rates were defined as organisms in the National Healthcare Safety Network common commensals list 15 which were only positive in one set of blood cultures for a patient.
Interventions
PDSA cycle 1: communication to providers and ordering frequency limitation (7/25/2024–08/02/2024)
An educational memorandum was circulated by email to notify clinicians of the blood culture bottle shortage. This memorandum recommended single-set FUBC instead of paired-set FUBC for most patients; for select positive cultures (Staphylococcus aureus, Staphylococcus lugdenensis, or Candida species), paired-set FUBC continued to be recommended. On 8/2/2024, we put a hard stop in our EHR to restrict the ability to order more than one BC at a time (eg, ordering daily blood cultures for the next 3 d).
PDSA cycle 2: Best practice advisory to limit FUBC after a prior negative BC (8/12/2024)
On 8/12/2024, we added a soft stop best practice advisory (BPA) that triggered when a blood culture was ordered for a patient with a documented negative blood culture within the prior 72 hours, with a recommendation that FUBC only be drawn in the setting of a new concern for sepsis (Supplemental Figure 1). Clinicians could either remove the blood culture by accepting the BPA or proceed with the blood culture order.
PDSA cycle 3: order panel implementation (9/29/24–10/3/2024)
We created a new blood culture order panel which defaulted to 2 sets of blood cultures for “initial cultures” and 1 set if clinicians chose “follow-up blood cultures” (Supplemental Figure 2). A clinical memo was sent to providers about this order panel on 9/29/24, and the order panel went live on 10/3/24.
Measures
Our primary outcome measure was weekly average FUBC orders. Our secondary outcomes included: (1) paired-set vs single-set FUBC usage, (2) weekly average blood cultures ordered per patient, (3) weekly average overall blood culture use, (4) blood culture contamination rates, and (5) adherence to educational guidance on select organisms (S. aureus, Candida species). Our process measures were the number of BPA alerts and the clinician responses to the BPA. Balancing measures included: (1) hospital length of stay, (2) hospital readmission, (3) patient mortality, and (4) S. aureus and Candida blood stream infection recurrence rate (defined as repeat positive cultures with the same organism occurring at least 14 days from the date of the last positive blood culture). Reference Choi, Dagher and Ruffin16
Analysis
We applied established Associates for Process Improvement rules to determine special cause variation for all Shewhart charts. Chi-squared, Fisher’s Exact, Student’s T-test, and Wilcoxon Ranked Sum tests were used to compare pre and postintervention characteristics and balancing measures. P-values were then corrected for multiple comparisons using the Benjamini-Hochberg method, and a corrected P-value of <.05 was considered statistically significant. Data analysis was performed using R 4.5.1 (R Foundation for Statistical Computing, Vienna, Austria) and RStudio 2024.09.0+375 (Posit, Boston, MA, USA). All hospital institutional review boards deemed the study to be Non-Human Subjects Research.
Results
From April 2024 to November 2024, 124,919 BC, including 33,472 FUBC, collected from 40,021 patients were included for analysis. Demographic data for patient cohorts in baseline and intervention periods were similar (Table 1).
Demographic characteristics of all patients who had blood cultures at our 8-hospital network from 4/2024 to 11/2024

Table 1. Long description
A table comparing demographic characteristics of patients before and after an intervention. The table has 10 rows and 5 columns. Column headers are Demographic characteristics, Before intervention, After intervention, and P-value. Row labels include Gender, Age, Race, Ethnicity, and Total patients. Each row provides specific data points for each category. For example, the Gender row shows the number and percentage of females before and after the intervention, with a P-value of 0.99. The Age row provides the median age and interquartile range before and after the intervention, with a P-value of 0.94. The Race row lists the number and percentage of different racial groups before and after the intervention, with corresponding P-values. The Ethnicity row shows the number and percentage of Hispanic or Latino origin and Not Hispanic or Latino origin before and after the intervention, with P-values. The Total patients row provides the total number of patients before and after the intervention.
Outcome measures
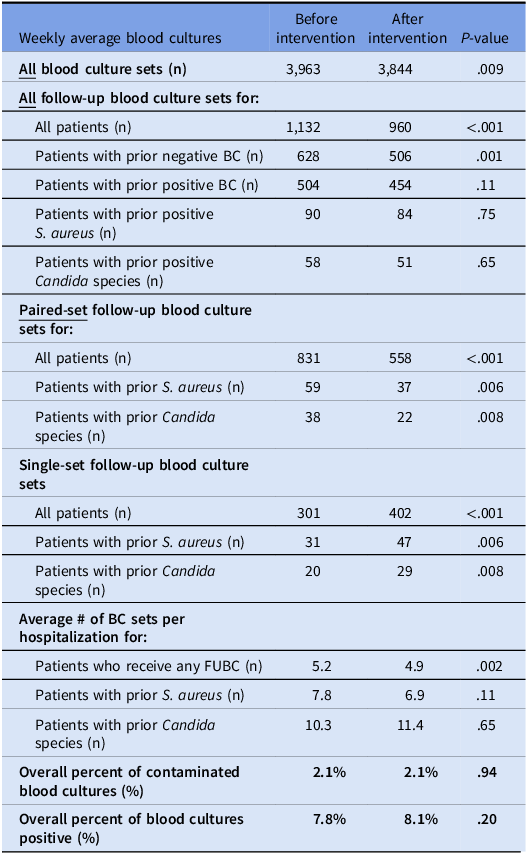
We monitored variation in FUBC use over time and found one instance of special cause that was sustained throughout the intervention period, showing a stable 18% absolute reduction in FUBC use (center line 1,133 to 934) (Figure 1). From the baseline period to the postintervention period, there was a 33% decrease in the weekly average number of paired FUBC sets (831 vs 558, P < .0001), a 4% decrease in weekly average overall BC use (3,963 vs 3,844, P = .009), and a 6% decrease in average number of BC sets per patient (5.2 vs 4.9, P = .002) (Table 2). Weekly average use of FUBCs following a prior negative BC significantly decreased by 19% (628 vs 506, P = .0001), while there was no significant decrease in weekly average FUBC following a prior positive BC (507 vs 451, P = .11). There was no significant change in blood culture positivity rates after intervention (7.8% (311/3,963) vs 8.1% (312/3,844), P = .20). There was also no significant change in blood culture contamination rates (P = .94) across our network.
I-chart of follow-up blood culture weekly usage at our 8-hospital network from 4/2024 to 11/2024, annotated with each PDSA cycle. FUBC, follow-up blood cultures.

Weekly average blood cultures at our 8-hospital network from 4/2024 to 11/2024. BC: blood culture, FUBC: follow-up blood culture

Table 2. Long description
A table comparing weekly average blood cultures before and after an intervention. The table has 14 rows and 4 columns. Column headers are: Before intervention, After intervention, and P-value. Row labels include All blood culture sets, All follow-up blood culture sets for all patients, patients with prior negative BC, patients with prior positive BC, patients with prior positive S. aureus, patients with prior positive Candida species, Paired-set follow-up blood culture sets for all patients, patients with prior S. aureus, patients with prior Candida species, Single-set follow-up blood culture sets for all patients, patients with prior S. aureus, patients with prior Candida species, Average number of BC sets per hospitalization for patients who receive any FUBC, patients with prior S. aureus, patients with prior Candida species, Overall percent of contaminated blood cultures, and Overall percent of blood cultures positive. Row 1: 3963, 3844, 0.009. Row 2: 1132, 960, <0.001. Row 3: 628, 506, 0.001. Row 4: 504, 454, 0.11. Row 5: 90, 84, 0.75. Row 6: 58, 51, 0.65. Row 7: 831, 558, <0.001. Row 8: 59, 37, 0.006. Row 9: 38, 22, 0.008. Row 10: 301, 402, <0.001. Row 11: 31, 47, 0.006. Row 12: 20, 29, 0.008. Row 13: 5.2, 4.9, 0.002. Row 14: 7.8, 8.1, 0.20. Row 15: 2.1, 2.1, 0.94.
Analysis of patients with positive initial blood cultures for S. aureus or Candida species showed an unintended decrease in the weekly average use of paired FUBC sets (S. aureus, 37% decrease (59 vs 37, P = .006); Candida species, 42% decrease (38 vs 22, P = .008)). However, there was no significant decrease in weekly average overall BC use among these patients (S. aureus, 90 vs 84, P = .75; Candida species, 58 vs 51, P = .65), and there was no significant decrease in average number of BC sets per patient with S. aureus bacteremia (7.8 vs 6.9, P = .11) or candidemia (10.3 vs 11.4, P = .65) (Table 2).
Process measures
Our primary process measure, the BPA to limit the use of blood cultures with a prior negative in the previous 72 hours, showed an average of 326 BPA alerts triggered per week (Figure 2). In 9.4% (444/4,718) of cases, the clinician removed the blood culture order, while in 90.6% (4,274/4,718) of cases, the BPA soft stop was overridden and the clinician confirmed the orders as initially placed.
C-chart of interruptive best practice advisory (BPA) alerts over time, triggered when a negative blood culture result occurred in the prior 72 hours.

Balancing measures
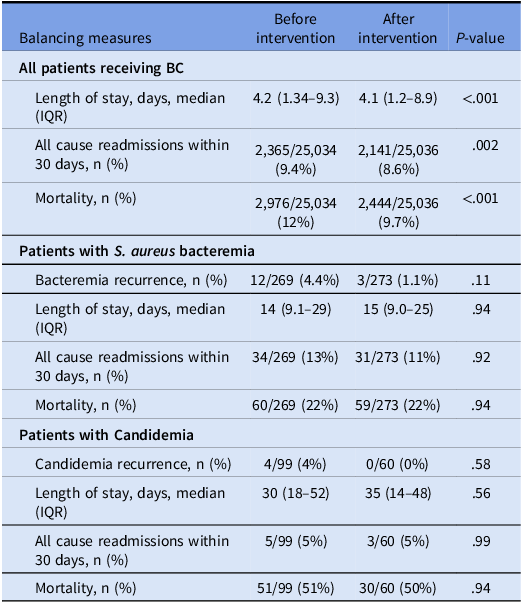
During hospitalizations for which blood cultures were drawn, there was an improvement in length of stay, all-cause readmissions within 30 days, and patient mortality (Table 3). There was no significant difference in these balancing measures upon subgroup analysis of patients receiving FUBC following S. aureus bacteremia or candidemia. Additionally, there was no significant increase in S. aureus bacteremia or Candidemia recurrence.
Balancing measures for all patients in hospital network from 4/2024 to 11/2024. BC, blood cultures

Table 3. Long description
A table with six rows and four columns comparing patient outcomes before and after an intervention. The columns are labeled Balancing measures, Before intervention, After intervention, and P-value. The rows are grouped into three categories: All patients receiving BC, Patients with S. aureus bacteremia, and Patients with Candidemia. Each category includes data on length of stay, readmissions within 30 days, mortality, and recurrence rates. Notable trends include a reduction in length of stay, readmissions, and mortality for all patients receiving BC after the intervention. For patients with S. aureus bacteremia and Candidemia, there are no significant differences in the measured outcomes before and after the intervention.
Discussion
In this quality improvement project, we decreased FUBC across our network by 18% while also modestly reducing the overall number of BC, primarily through the decreased use of paired-set FUBC and decreased use of FUBC following a prior negative BC. These improvements occurred without an increase in patient mortality, hospital re-admission, or hospital length of stay; these measures had a statistically significant improvement following our intervention, but this could be unrelated to our stewardship intervention and may instead be related to seasonal variations or other confounding factors. Reference Blot, Hammami, Blot, Vogelaers and Lambert17
Similar studies from other institutions showed decreases in blood culture use from 18% to 48%, roughly in line with our own reduction strategy. Reference Ryder, Van Schooneveld, Diekema and Fabre18–Reference Butt, Kressel and Haines21 These studies used alternative stewardship interventions including clinical decision support algorithms with both hard stop and soft stop systems, Reference Ryder, Van Schooneveld, Diekema and Fabre18,Reference Doern, Whitman and Doll19,Reference Hudson, Rodriguez Nava and Sampson22 reduction of initial blood cultures from 2 sets to 1 set, elimination of follow-up cultures within 48–72 hours, and elimination of follow-up cultures within 7 days for positive cultures other than MDR-GNR, S. aureus, and yeast. Reference Ryder, Van Schooneveld, Diekema and Fabre18,Reference Humphries, Wright and Banerjee20,Reference Butt, Kressel and Haines21
A limitation of this study is that with rapid serial interventions, we could not assess the individual impact of these interventions, and we were unable to review indications for appropriateness of orders. Our study used education, interruptive BPAs, and order restrictions, although the BPA was overridden in >90% of cases. While these pop-ups in the EMR may guide clinicians toward appropriate ordering, fatigue and frustration with continuous pop-ups in the EMR may lead to alert fatigue and reduced effectiveness, especially as the number of BPAs in patient encounters continues to grow. Reference Ng, Kansal and Abdul Naseer23 Future strategies could be employed to improve the language and accessibility of the BPA and improve clinician education to increase compliance with recommendations.
While FUBCs to document clearance has a mortality benefit for select organisms, Reference Liu, Bayer and Cosgrove5,Reference Pappas, Kauffman and Andes7 we saw a significant and unintended decrease in paired-set FUBC following a prior positive culture for S. aureus or Candida species. However, subgroup analysis did not show any increase in patient mortality, 30-day hospital readmission, hospital length of stay, or blood stream infection recurrence rates, though our data set was unable to assess recurrence beyond the end date of the study period. These findings suggest that serial single-set FUBC use may be sufficient to document clearance of these organisms, although further research studies would be necessary for definitive conclusions.
In this article, we exceeded our goal of reducing blood cultures by focusing on FUBC. Our data show that this valuable resource can be reduced without patient harm, but highlight the need to track unintended consequences. Our approach to FUBC is scalable beyond the bottle shortage and could become part of the diagnostic stewardship toolkit for blood culture stewardship.
Supplementary material
The supplementary material for this article can be found at https://doi.org/10.1017/ash.2026.10913.
Acknowledgements
We thank all members of the NewYork-Presbyterian Diagnostic Stewardship Workgroup for their contributions to this project and devising the changes needed to reduce FUBC use safely in our patients.
Author contribution
JMK data curation, formal analysis, writing—original draft, BR data curation, formal analysis, writing—review and editing, XQW data curation, writing—review and editing, RW data curation, conceptualization, writing—review and editing DK, data curation, writing—review and editing, AN—resources, writing—review and editing, TG resources, writing—review and editing, SS resources, writing—reviewing and editing, JM resources, writing—reviewing and editing, KPA conceptualization, writing—reviewing and editing, HH conceptualization, writing—review and editing, TW, conceptualization, writing—review and editing, DAG resources, writing—review and editing, GB resources, writing—review and editing, EFS resources, writing—review and editing, DL resources, writing—review and editing, CG resources, writing—review and editing, NP methodology, writing—review and editing, RK formal analysis, writing—review and editing, MS—conceptualization, methodology, supervision, writing—review and editing, LW resources, writing—reviewing and editing, EYF conceptualization, methodology, supervision, writing—review and editing, HKS conceptualization, formal analysis, investigation, methodology, writing—original draft
Financial support
None reported.
Competing interests
All authors declare no conflicts of interest.





 Open access

