Implications
Potential use of milk mid-infrared (MIR) spectra to predict the individual methane (CH4) emission of dairy cows by Dehareng et al. The disadvantages of existing methods for CH4 measurement are the financial and human costs and/or the practical difficulties of these methods when they are used directly on field. The MIR spectrometry used for milk analysis corrects this inconvenience. Therefore, the aim of this study was to develop an accurate and robust tool to predict the individual CH4 emission of dairy cows by using MIR spectrometry.
Introduction
Livestock farming is right at the forefront of climate change issues. Agriculture is regarded as the biggest producer of anthropogenic methane (CH4), mainly through ruminant gas emissions (Food and Agriculture Organization (FAO), 2010). Enteric CH4 is produced by ruminants during the microbial digestion of feed in the rumen. CH4 contributes widely to global warming, accounting for ∼52% of the green house gases emissions in both developing and developed countries (FAO, 2010). CH4 absorbs 25 times as much infrared radiation than carbon dioxide (CO2), enlarging global warming problems (Fuglestvedt, Reference Fuglestvedt2009). In addition to those environmental concerns, the eructed CH4 induces a significant loss of gross energy intake for the animal. This gas loss corresponds between 3% and 10% of gross energy intake (Johnson and Johnson, Reference Johnson and Johnson1995; Jouany, Reference Jouany2008; Beauchemin et al., Reference Beauchemin, McAllister and McGinn2009). These losses are mainly explained by the animal (age and species), the diet (intake level, composition) and the level of milk production (Vermorel, Reference Vermorel1995). However, individual variations between animals of the same breed were reported in the range from 30% to 60% in production of CH4/unit of feed ingested when these animals received the same diet at equivalent ingestion and production levels (Lassey et al., Reference Lassey, Uylatt, Martin, Walker and Shelton1997). They are related to different rumen microbial populations, coming from different ruminal kinetics, such as salivation, rumination (Demeyer and Fievez, Reference Demeyer and Fievez2000) and different feeding behaviors, indicating interaction between animals and their microbiota. Recent results suggest, therefore, a genetic component in variation of individual CH4 production (Martin et al., Reference Martin, Doreau and Morgavi2010). However, most studies showed that ruminants that are genetically different for feed efficiency (e.g. Hegarty et al., Reference Hegarty, Goopy, Herd and McCorkell2007) and productivity showed reduced daily CH4 production (e.g. Bell et al., Reference Bell, Wall, Russell, Morgan and Simm2010). Given the complexity of this variation, large-scale studies should be conducted, but no in vivo method to measure CH4 emissions in ruminants is sufficiently accurate to be applied on a large number of animals (Clark, Reference Clark2010). Indeed, the available methods, such as the use of calorimeter or CH4 chambers, the tunnel system and the sulfur hexafluoride (SF6) tracer technique, are not easy to use on farm and are laborious to estimate individual CH4 production of many cows in a short period. Therefore, a simpler and appropriate method is required to predict individual CH4 emissions. For this, the method investigated here was based on the fact that CH4 synthesis depends on the kind of rumen fermentation, which also influences many other parameters such as milk composition (Ørskov et al., Reference Ørskov, Fraser and Kay1969).
Carbohydrates are the most important source of energy and the primary precursors of fat and lactose in cow's milk. The end products of carbohydrate degradation are the volatile fatty acids (VFA), CO2, CH4 and H2. Demeyer and Fievez (Reference Demeyer and Fievez2000) have developed an equation that shows clearly the relationship between VFA and CH4. During the fermentation process, acetate and butyrate promote CH4 production, whereas propionate maintains a competitive role for the use of hydrogen. According to Miettinen and Huhtanen (Reference Miettinen and Huhtanen1996), an increased butyrate/propionate ratio decreases the lactose content and increases the fat content in milk and the rumen CH4 synthesis. Thus, a relationship among CH4, lactose and fat contents could be assumed as suggested by Vlaeminck and Fievez (Reference Vlaeminck and Fievez2005). In addition, the rumen VFA composition also influences milk fat composition. In ruminants, the milk fatty acids (FA) come from two sources, uptake from circulation and de novo synthesis within the mammary gland. Approximately one half of the milk FA (molar percent) is derived from de novo synthesis, based on acetate and butyrate (Bauman and Griinari, Reference Bauman and Griinari2003). Short- and medium-chain FA (4 to 14 carbons) arise totally from de novo synthesis. Long-chain FA (>16 carbons) are collected in the circulating lipids, and FA of 16 carbons depend on these two sources (Bauman and Griinari, Reference Bauman and Griinari2003). Thus, the proportions of different FA reflect the ruminal fermentation via VFA and then CH4 production (Weill et al., Reference Weill, Kerhoas, Chesneau, Schmitt, Legrand and Rennaud2008 and Reference Weill, Chesneau, Chilliard, Doreau and Martin2009). Moreover, several authors have already reported, for different diets, relationships between milk FA (measured by gas chromatography (GC)) and CH4 emission of dairy cows (Chilliard et al., Reference Chilliard, Martin, Rouel and Doreau2009; Delfosse et al., Reference Delfosse, Froidmont, Fernandez Pierna, Martin and Dehareng2010; Dijkstra et al., Reference Dijkstra, Apajalahti, Bannink, Gerrits, Newbold, Perdok, van Zijderveld and Berends2010). These results suggest that, in general, CH4 emissions are linked to milk composition. As the mid-infrared (MIR) spectrum reflects the milk composition (Soyeurt et al., Reference Soyeurt, Dardenne, Dehareng, Lognay, Veselko, Marlier, Bertozzi, Mayeres and Gengler2006 and Reference Soyeurt, Dehareng, Gengler, McParland, Wall, Berry, Coffey and Dardenne2011), it is logical to postulate that the MIR spectrum could predict directly the individual emission of CH4. Therefore, the aim of this study was to have a first evaluation of the potential use of milk spectra obtained by Fourier Transform InfraRed analysis (FTIR) apparatus directly to predict the quantities of CH4 eructated by individual dairy cows. The development of a MIR CH4 equation will permit to predict and therefore to study at large scale the CH4 emission of dairy cows, because the MIR technology is already implemented in milk laboratories to quantify the major milk components used for the milk payment and the routine milk recording.
Material and methods
Animals and diets
Two experiments were carried out with different experimental conditions in order to maximize the variability of individual CH4 emission needed to establish a robust calibration model.
In the first experiment, two primiparous and six multiparous (three of second lactation and three of third lactation) lactating Holstein cows were divided into two groups of four cows each. At the beginning of the trial, the groups were similar in terms of lactation stage (180 days in milk) and of average milk production (17.4 ± 3.9 kg/day). Two isoenergetic experimental diets (17 kVEM) were offered according to a 2 × 2 crossover design. Experimental diets were fed twice daily at 0900 and 1600 h as total mixed rations (TMR). The diets were fed at an intake level of 18.5 kg/day and aimed at producing 20 kg/day of milk. Diet 1 consisted of: freshly cut pasture grass (third cutting, Holcus lanatus), 550 g/kg dry matter (DM); dried beet pulp, 200 g/kg DM; soybean meal, 150 g/kg DM; and soybean hulls, 100 g/kg DM. Diet 2 consisted of: corn silage, 400 g/kg DM; meadow hay, 200 g/kg DM; cracked corn, 130 g/kg DM; rapeseed meal, 150 g/kg DM; palm meal, 55 g/kg DM; soybean meal, 55 g/kg DM; and a 50 : 50 mix of coconut and flaxseed oil, 10 g/kg DM. Both diets contained a mixture of vitamins and minerals.
In the second experiment, three multiparous (two of second lactation and one of fourth lactation) lactating Holstein cows with a similar milk production (26.2 ± 1.9 kg/day) were fed a same basal diet, with an intake level of 20.3 kg/day. This diet (TMR) consisted of grass silage, 520 g/kg DM; corn silage, 130 g/kg DM; cracked corn, 130 g/kg DM; soybean meal, 110 g/kg DM; and dried beet pulp, 110 g/kg DM.
For both the experiments, the adaptation period was 21 days and milk and CH4 samples were then collected from days 22 to 28. Fresh water was available at all times.
All the procedures used involving the animals were approved by the regional ethics committee in animal experimentation (protocol CRAW09/01).
Sampling and analyses
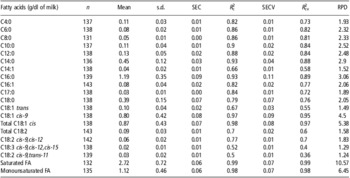
Milk yield was recorded daily at each sampling period at 0730 and 1630 h. A 50 ml aliquot of milk, containing sodium azide (0.32 g/l), was stored at 4°C until infrared analyses. The sample stored at 4°C was analyzed by a FTIR Lactoscope spectrometer (Delta Instruments, Drachten, the Netherlands). The Lactoscope works within 925 to 3000/cm and uses an interferometer. This instrument gave the spectral data and the direct measurement of milk components such as lactose, protein, fat, and non-protein nitrogen (considered to be essentially urea). Similar FA composition predictions were also obtained based on equations specific to this machine. Table 1 presents the statistical parameters of some of these equations. For each FA equation, the standard error of cross-validation (SECV) given by the FTIR Lactoscope equations are included between those given by Soyeurt et al. (Reference Soyeurt, Dardenne, Dehareng, Lognay, Veselko, Marlier, Bertozzi, Mayeres and Gengler2006) and those of Soyeurt et al. (Reference Soyeurt, Dehareng, Gengler, McParland, Wall, Berry, Coffey and Dardenne2011). A total of 154 samples were collected and analyzed (spectra were in triplicate).
Estimated statistical parameters for each calibration equation that estimated the concentrations of fatty acid in milk (g/dl milk) used in this study

s.d. = standard deviation; SEC = standard error of calibration; R 2 c = calibration coefficient of determination; SECV = standard error of cross-validation; R 2 cv = cross-validation coefficient of determination; RPD = ratio of standard error of cross-validation to standard deviation; FA = fatty acids.
Quantification of CH4
During the 7-day period, the SF6 gas tracer technique was used according to the method described by Martin et al. (Reference Martin, Rouel, Jouany, Doreau and Chilliard2008) in order to measure the individual production of enteric CH4 by the studied cows. In brief, a calibrated permeable tube containing ultra pure SF6 was placed in the rumen of each cow before the experimental period. The average release rate of SF6 from the tubes was 1189.5 ± 168.6 ng/min.
A representative of breath gas sample, containing respired and eructated gas, was collected through a capillary tube situated between the nostril and the mouth of each animal, thanks to an halter. This gas sample was stored in a canister placed near the animal (more or less one meter) in a way that the animal could not touch it. The canister was changed daily after morning feeding and the CH4 and SF6 concentrations were analyzed using GC (Martin et al., Reference Martin, Rouel, Jouany, Doreau and Chilliard2008).
A GC (Varian-Chrompack, CP-9003, Les Ulis, France) fitted with an electron capture detector (Perkin Elmer instruments; Autosystem XL, Courtaboeuf, France) and with a flame ionization detector was used to determine the concentrations of SF6 and CH4, respectively. The samples were run on GCs equipped either with a Molecular Sieve 0.5 nm column (3 m × 3.2 mm i.d.) maintained at 50°C for the SF6 or with a Porapak N 80-100 mesh column (3 m × 3.2 mm i.d.) maintained at 40°C for the CH4. The flow rate of the carrier gas was 30 ml/min of N2 for SF6 and 40 ml/min of He for CH4. Chromatographic analyses were performed after calibration with standard gases (Air Liquide, Mitry-Mory, France) for SF6 (55 and 195 ppt) and CH4 (100 ppm).
To determine the released amount of  , the concentration of SF6 and CH4
 in the canister and the predetermined released rate of SF6
 were used. In parallel to each daily measurement, the concentration of the atmospheric air
 determined with another canister was subtracted (Johnson et al., Reference Johnson, Huyler, Westberg, Lamb and Zimmerman1994):

where  and
 are the molecular weights of CH4 and SF6, respectively.
The CH4 emission was therefore expressed in g of CH4/day and reexpressed later in g of CH4/kg of milk, thanks to the recorded milk yield because the global daily CH4 production is linked to productivity.
Spectral data treatment
Each cow was milked twice daily, providing two individual samples, which were analyzed by MIR, thus two spectra, whereas individual CH4 emission was measured once daily. Therefore, to build the calibration model, the recorded spectral data were transformed to represent one daily spectrum related to one daily CH4 record. The methodology used to create the average milk spectra (AMS) was tested by comparing MIR predictions obtained from AMS and the real spectral data obtained from the infrared analysis of a representative daily milk sample (i.e. 50% of morning and 50% of evening milk samples). This ratio was chosen because it corresponds to the averaging used during the majority of milk-recording process. Alternatively, the weighted average was also tested. It corresponded to the average of the two milk spectra of the day in proportion to the amount of milk produced by the cow in each respective milking (morning and evening). The reason for this was that a weighted average represented better the biological background of the process.
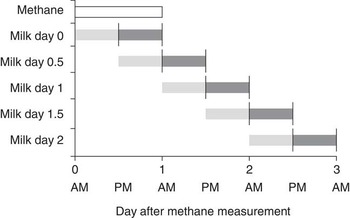
A dynamic relationship between milk composition (and therefore spectral data) and CH4 was considered by assuming that there is a delay between the production of fermentation products and their use to produce milk components. Consequently, different ways exist to define the AMS. Indeed, the spectral data used to create the AMS can be generated by the milk analysis of samples collected at different times compared with the time of CH4 measurement. The AMS were calculated from five methods averaging always two samples, which are illustrated in Figure 1:
Possibility to average the spectra milk in function of methane day collect. Vertical lines corresponds to milking time; surface shaded to milk production.

-
• the same day of CH4 measurement (day 0),
-
• evening of the same day and morning next day (day 0.5),
-
• next day (day 1),
-
• evening next day and morning 2 days later (day 1.5), and
-
• 2 days later (day 2).
Always two samples were averaged to reflect a whole test-day in the milk as whole day was also represented in the CH4 measurements.
Given the stability of diets and the high degree of auto-correlation that can be therefore assumed across values for the five methods, the objective of this was not to infer a definitive response what the delay between the production of fermentation products and their use to produce milk components, but to find retrospectively which definition of the AMS gives the best predictions under the condition of this study.
Calibration model
As mentioned previously, a calibration set with a large spectral variability is required to develop robust calibration models. Therefore, a principal component analysis was carried out on available spectra at day 0 in order to illustrate the spectral variation observed from the collected milk samples.
The calibration models were developed by Foss WINISI 4 software from the recorded spectral and CH4 data using Partial Least Squares regressions. The spectral regions used for that were: 972 to 1589/cm, 1720 to 1782/cm and 2746 to 2970/cm. No additional pretreatment was applied on spectral data because with a derivative, results were not significantly better probably because of the fact that only one spectrometer was used in this experiment. The number of factors used was determined by a full cross-validation (with n observations, create n models by removing n time one sample that is predicted by the others n − 1), which was also used to estimate its robustness. The accuracy of the resulting calibration models was evaluated by calculating the calibration coefficient of determination (R 2 c), cross-validation coefficient of determination (R 2 cv), standard error of calibration (SEC) and the standard error of cross-validation (SECV). The predictability of the calibration was evaluated through the ratio of performance to deviation (RPD; s.d./SECV where s.d. was the standard deviation of the CH4 measures). The RPD should be as high as possible; values between 5 and 10 are adequate for quality control, and values >2.5 are satisfactory for screening breeding programs (Williams and Sobering, Reference Williams and Sobering1993).
Correlations with milk components
To show the interest of using a new direct MIR equation to quantify the CH4 emissions, the best correlation between milk components already predicted by MIR and CH4 was calculated. In this way, it was possible to verify whether the predicted CH4 production data obtained by the developed calibration equation were because of new recombination of global spectral information or just because of specific milk components already predicted by MIR and whose equations are available. If the cross-validation correlation is higher than the correlation between CH4 and specific MIR milk component, it can be assumed that the developed equation provides additional information than the simple correlation between CH4 and the already-predicted milk components.
Results and discussion
Spectral variation
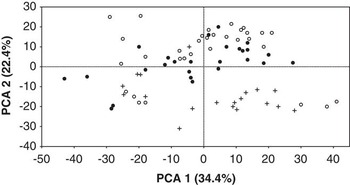
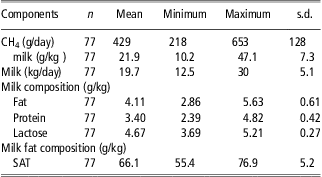
The first two principal components described 56.8% of the total variation observed in the studied data set (n = 77). These principal components (Figure 2) were used to illustrate the spectral differences of studied milk samples. Spectra from cows fed different diets (i.e. grass silage, corn silage and fresh pasture) are separated (Figure 2). On the basis of the literature (Collomb et al., Reference Collomb, Bütikofer, Sieber, Jeangros and Bosset2002), this suggests that the use of different diets involved a change in milk composition, and therefore in the milk spectral data. Moreover, Table 2, with descriptive statistics, also shows high variations of milk composition primarily fat, protein, lactose and saturated fatty acids. This variability of spectral data is needed to develop a robust calibration equation.
Plot of the principal component analysis of milk spectra for individual cows fed three differing diets: corn silage (•), fresh pasture (○) and grass silage (+). CH4 = methane.

Means and range of CH4 emissions, production and composition of the milk, SAT composition of the milk fat for the two experiments (day 0)

CH4 = methane; SAT = saturated fatty acids; s.d. = standard deviation.
Table 2 also shows the variability of CH4 expressed in g/day and g/kg of milk. The coefficients of variation were 29.84% and 33.33%, respectively. This large variation could be explained partly by the use of three different diets. A slightly larger variation was observed for the CH4 emission expressed in g of CH4/kg of milk, because the definition of this trait took into account simultaneously the variability of CH4 and milk yield.
Spectral data treatment
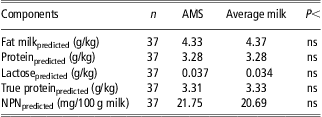
As mentioned previously, for each cow, two spectra measurements and one CH4 measurement were available. To have one spectrum for one measure of CH4, the collected spectral data from the morning and evening milk samples were averaged. To validate the methodology, the contents of major milk components (i.e. fat, protein, lactose, true protein and NPN) predicted from AMS derived from 50% morning and 50% evening spectral data and from the spectral data obtained from the infrared analysis of a representative 24 h milk sample were compared. Table 3 shows no significant difference (P > 0.005) in milk components predicted by AMS and by the 24 h spectral data. Therefore, AMS was considered similar to the spectrum of the representative 24 h milk sample showing the pertinence of the method used to create the AMS.
Comparison between components prediction for AMS and spectra of average milk in a ratio 50 to 50 for 37 milk samples during the second experiment

AMS = average milk spectra; NPN = non-protein nitrogen.
ns: P > 0.05.
Calibration model
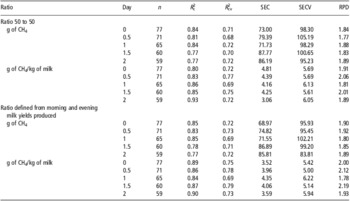
Different equations were built to predict the quantity of CH4 produced per day in function of the five different possibilities used to create AMS as shown in Figure 1. Table 4 presents the statistical parameters obtained for the 20 developed calibration equations. The prediction of CH4 by MIR, based on R 2 cv, was better by considering g of CH4/kg of milk instead of g of CH4/day (R 2 cv = 0.79 v. R 2 cv = 0.73). This could be explained by the fact that the expression unit g of CH4/kg of milk compared with g of CH4/day takes into account the milk production, which is directly related to the release of CH4 by cows (Vermorel, Reference Vermorel1995) and, therefore, reflected in the spectral data, thanks to the dilution effect known for the majority of milk components. For instance, the literature shows that the contents of major milk components such as fat, protein and FAs (Soyeurt et al., Reference Soyeurt, Dardenne, Dehareng, Bastin and Gengler2009) are negatively correlated with the milk yield. Table 4 also shows that the use of a ratio taking into account the milk produced during the evening and morning milkings for the calculation of AMS compared with the ratio 50% of morning and 50% of evening spectral data gave better results. This could be explained by the relationship between the milk production and the CH4 emission by dairy cows (Vermorel, Reference Vermorel1995). Therefore, the equations using the CH4 content expressed in g/kg of milk and the morning and evening milk AMS gave the best results.
Evolution of accuracy of the resulting calibration with the different kind of AMS with a ratio 50 to 50 and a weighted average for the two experiments. The number of available data depends on the chosen day

AMS = average milk spectra; R 2 c = calibration coefficient of determination; R 2 cv = cross-validation coefficient of determination; SEC = standard error of calibration; SECV = standard error of cross-validation; RPD = ratio of performance to deviation; CH4 = methane.
The interval between the measurement of CH4 by the SF6 tracer method and the spectral data used (Figure 1) gave different results (Table 4). By observing the last five lines of Table 4, day 1.5 gave the best result for the internal validation (i.e. R 2 cv = 0.79). The best equation seems to be the one built from the AMS created from the weighted average, taking into account the milk produced, the CH4 content expressed in g/kg of milk and an interval between the measurement of CH4 and the spectral data equal to 1.5 days. This equation also seemed to be the most robust because the difference between R 2 c and R 2 cv was the lowest (0.08). These results are only first indications of the delayed response of milk composition to rumen fermentation. More research is needed in other experimental conditions, for instance, by inducing the inhibition of the rumen methanogenesis and observing the milk spectra modifications in the next few days.
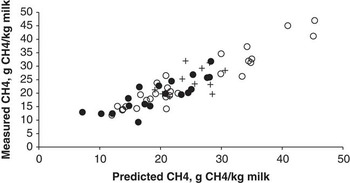
Even if this study must be validated on a larger data set, the obtained results suggest a clear indirect link between the CH4 emission and the milk composition through the direct use of the MIR spectral data. Chilliard et al. (Reference Chilliard, Martin, Rouel and Doreau2009) also showed this relation through the link between the contents of milk FA analyzed by GC and the production of CH4 by dairy cows fed with diets supplemented or not with linseeds. The present study also shows the feasibility of the MIR prediction of CH4 produced by dairy cows and a relative robustness of the developed equation. Indeed, despite of the large variation observed for g of CH4/kg of milk produced per cow and per diet over the study period and the observed variability of milk composition (Table 2), the MIR CH4 predictions were good and R 2 c and R 2 cv were never below 0.77 and 0.68, respectively. Moreover, CH4 prediction did not seem to be affected (Figure 3) by the different kind of diets used during the experiments (one consisting of corn silage, another of pasture grass and other of grass silage). However, it seems that the pasture grass diet contributes mainly to the large variation in CH4 emissions. This variation between animals for this diet could be because of the season, and therefore a higher lignification of grass at the end of the experimentation. In addition, individual, for example genetic, differences among the animals could be the reason for these results. To be able to make a generalization of the prediction, it is important to continue to collect data on different diets. Finally, the RPD, which relates the standard error of prediction to the standard deviation of the original reference data, was equal to 2.19, suggesting a good robustness of the prediction. Indeed, Williams and Sobering (Reference Williams and Sobering1993) showed that a value of 2.5 and above are satisfactory for screening. Therefore, using this equation, it is currently feasible to classify the dairy cows in two groups: low and high CH4 producers. More variability in the available data can improve the ability of the equation to predict CH4 emission. Potential use of data obtained from genetically diverse animals, fed on different diets and producing in diverse management, should allow improving the equations.
Infrared methane prediction on the basis of milk spectra of the day 1.5 for the different diets: corn silage (•), fresh pasture (○) and grass silage (+). PCA = principal component analysis.

Correlations with milk components
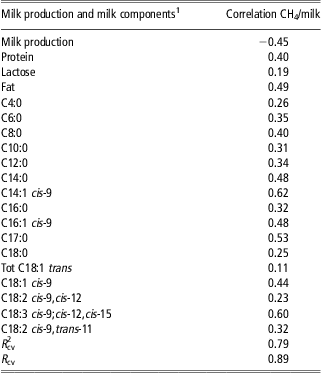
Because of the strong indirect link existing between CH4 emissions and the overall milk composition, it was expected that CH4 emissions would correlate strongly with milk production and milk components already predicted by MIR and whose equations are available (Table 5). Despite what was expected (Miettinen and Huhtanen, Reference Miettinen and Huhtanen1996), a low correlation was observed between lactose and CH4 emissions. Nevertheless, R 2 cv for the best equation is always superior to the correlation obtained from milk production and MIR milk components, suggesting that the developed equation provides additional information.
Individual correlations between different milk parameters and the CH4/kg of milk produced for the day 1.5

CH4 = methane; FTIR = Fourier Transform InfraRed analysis; R 2 cv = cross-validation coefficient of determination.
R cv = square root of the R 2 cv value.
1Milk components were predicted by FTIR spectrometer.
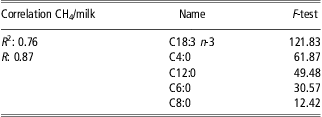
A multiple correlation (Table 6) was built starting from the parameters appearing in Table 5 to predict CH4 production/kg of milk for the day +1.5. The R 2 (R 2 = 0.76) was lower than the R 2 c (R 2 c = 0.87) obtained by the equation for this parameter in Table 4. In addition, the results presented in Table 6 suggest the existence of a close relationship between FA profiles and CH4 emission, as previously reported by Chilliard et al. (Reference Chilliard, Martin, Rouel and Doreau2009). However, our first results showed that the use of the full spectral data gave more information. In the future, the use of more precise equations for the prediction of the FA could help us better understand the role of each FA and confirm or reverse these observations. In fact, the precision (SECV) of our FA equations could be upgraded in order to meet at least the precision obtained by Soyeurt et al. (Reference Soyeurt, Dehareng, Gengler, McParland, Wall, Berry, Coffey and Dardenne2011). This underlines the practical interest to use MIR spectra to predict individual CH4 emission of dairy cows.
Multiple correlations from the parameters appearing in Table 5 to predict the CH4/kg of milk produced for the day 1.5

CH4 = methane; R = square root of the R 2 value.
Conclusion
The results of our study tended to show that the prediction of CH4 emissions from milk spectra is feasible. This is partially explained by the fact that the milk spectrum reflects the milk composition, which is considered linked to CH4, because of the relationship of both phenomena to ruminal fermentation. Results from this study showed that CH4 is better predicted, based on R 2 cv, with the weighted AMS built from spectral data collected at day 1.5 compared with the moment of CH4 measurement. Additional studies providing data from genetically diverse animals and different breeds, fed different diets and producing in diverse managements, are needed to improve the obtained RPD, and therefore clarify and potentially confirm the initial relationship, which is reported in this study.
The calibration results indicated that the best equation could be used for screening purposes, differentiating high and low CH4 producers, even if addition research is still required to make it more reliable and potentially implementable on other spectrometers. Once this is achieved, as the existing methods for CH4 measurement are difficult to apply on a large scale, this alternative method has the potential to be very useful to predict CH4 emission for dairy herds at individual cow level from milk MIR spectra. These required data are already taken and used for the milk recording and the milk payment. Through the large-scale generation of predicted CH4 emission data, the method could help improve the knowledge about the sources of CH4 variation (genetic or not) and about its link to other traits of interest.
Acknowledgments
The authors gratefully acknowledge the financial support of the Ministry of Agriculture of the Walloon Region of Belgium [Service Public Wallon, Direction générale opérationnelle ‘Agriculture, Ressources naturelles et Environnement’ (DGO3), Direction de la Recherche; Namur, Belgium] and Delta Instruments who provided gracefully a FTIR Spectrometer. The authors thank M. Didelez and the bovine group for their technical assistance, Y. Rochette for the laboratory gas analysis and M. Doreau for his help in the elaboration of the first experiment protocol. Hélène Soyeurt and Nicolas Gengler, who are Post-doctoral Researcher and Senior Research Associate of the National Fund for Scientific Research (Brussels, Belgium), acknowledge their support.