Introduction
Lactate is an ion produced by anaerobic respiration which occurs during periods of tissue hypoxia.Reference Bakker, Nijsten and Jansen 1 , Reference Okorie and Dellinger 2 Elevated lactate may be caused by increased lactate production, decreased clearance, or a combination of both. Elevated serum lactate (sLA) has been shown to be a reliable predictor of in-hospital mortality and length of intensive care unit (ICU) stay.Reference Okorie and Dellinger 2 - Reference Vandromme, Griffin, Weinberg, Rue and Kerby 4 It has also been shown to be more accurate than blood pressureReference Vandromme, Griffin, Weinberg, Rue and Kerby 4 at predicting requirements for blood transfusion, and may have prognostic use in out-of-hospital cardiac arrests.Reference Williams, Martin and Celenza 5 , Reference Anderson, Mackenhauer, Roberts, Berg, Cocchi and Donnino 6 The prognostic value of sLA for inpatient settings has inspired interest in the utility of prehospital point-of-care lactate (pLA) testing.
Prehospital pLA has been shown in several small studies to be useful as a predictor of outcome in trauma patients,Reference Guyette, Suffoletto, Castillo, Quintero, Callaway and Puyana 7 carbon monoxide poisoning,Reference Moon, Shin and Chun 8 , Reference Inoue, Saito and Tsuji 9 paracetamol overdose,Reference Bernal, Donaldson, Wyncoll and Wendon 10 and burns.Reference Jeng, Jablonski, Bridgeman and Jordan 11 Several studies have shown pLA to be useful in diagnosing sepsisReference Mikkelsen, Miltiades and Gaieski 12 , Reference Goyal, Pines, Drumheller and Gaieski 13 and as an independent indicator of reduced neurological status in septic patients.Reference Seymour, Band and Cooke 14 Traditional prehospital vital signs have been shown to have limited use in critically ill patients, due to patient compensation,Reference Husain, Martin, Mullenix, Steele and Elliott 15 so the utility of a simple point-of-care measure such as lactate cannot be overlooked.
Prehospital lactate measurement must be seen as a reliable substitute for in-hospital sLA measurement if it is to be used to guide diagnosis and treatment of critically ill patients. Point-of-care tests have been shown to deliver reliable and accurate results in hospital settings.Reference Gaieski, Drumheller, Goyal, Fuchs, Shofer and Zogby 16 , Reference Shapiro, Fisher and Donnino 17 However, the reliability of pLA as a surrogate for sLA under field conditions has not been well established. Clearance of sLA may be inhibited or enhanced by certain conditions, so the time difference between pLA and sLA may affect the perceived reliability of pLA.
To date, no Australian studies have been published to determine whether pLA measurements are reliably associated with sLA. The aim of this study was to determine whether pLA is a reliable predictor of sLA. It was hypothesized that pLA will be a reliable surrogate for sLA, with decreasing reliability as the time between the measurements increases.
Method
This study is a retrospective clinical audit, which was conducted over a period of 12 months in the Australian Capital Territory (ACT).
Setting
The population of the ACT is approximately 392,000 people, 18 predominantly urban dwellers with a small number of semi-rural residents. Ambulance services are provided by the ACT Ambulance Service (ACTAS), which is a government funded and managed service that attends approximately 30,000 emergency cases per year. The ACT is serviced by two public emergency departments (EDs). Canberra Hospital is a tertiary hospital with approximately 600 beds, including a 31 bed ICU, and is the primary referral hospital in the region. 19
Materials
All ACTAS emergency ambulances are equipped with the Lactate Pro 2 (ARKRAY; Shiga Prefecture, Japan) point-of-care blood lactate test meter to measure pLA in the prehospital setting. Like other point-of-care tests, the Lactate Pro 2 uses an enzymatic amperometric detection method.Reference Bonaventura, Sharpe, Knight, Fuller, Tanner and Gore 20 This method interprets the electrical signal produced by the reaction between lactate in the blood and the enzyme lactate oxidase on the sensor strip. The voltage signal corresponds directly to the lactate concentration of the sample.Reference Bonaventura, Sharpe, Knight, Fuller, Tanner and Gore 20 Paramedics have the option of using capillary or venous blood for lactate testing. If venous blood is tested, the sample is obtained using a ProtectIV Plus Safety I.V. Catheter (Smiths Medical International Ltd; Lancashire, United Kingdom).
Serum lactate was measured in arterial or venous blood which was collected using a heparinized 3mL PORTEX Arterial Blood Gas Sampling Kit (Smiths Medical ASD Inc; Keene, New Hampshire USA) with a 0.5 mm PrecisionGlide Needle (Becton Dickinson; Singapore). After collection, the sample was processed within minutes on GEM Premier 4000 blood gas analyzers (Instrumentation Laboratory; Bedford, Massachusetts USA) located throughout the ED and ICU. Samples were not stored on ice, since in-vitro lactate elevation is not an issue for samples processed in under 15 minutes.Reference Bakker, Nijsten and Jansen 1
Procedure
The ACTAS paramedics are trained to collect a pLA measurement to support a potential diagnosis of sepsis. As such, they are encouraged to take a lactate measurement in the presence of signs of infection and potential shock (ie, elevated heart rate, elevated respiratory rate, and/or hypotension). Prehospital lactate measurement is not compulsory and is at the discretion of the treating paramedic. Similarly, sLA is tested whenever the attending doctor believes there is an indication for blood gas analysis, regardless of the suspected clinical diagnosis. All patients attended by ACTAS are documented on an electronic patient care record (ePCR), which records patient details, vital signs, symptoms, and treatment provided.
Participants
Inclusion criteria were all adult patients (age >12 years) transported to Canberra Hospital by ACTAS in the 12 months from July 1, 2014 through June 30, 2015 who had a pLA measurement recorded. Patients were excluded if they had a cardio-respiratory arrest at any time during the episode of care, or if they did not have a sLA measured within 24 hours of hospital arrival.
Data Collection
The attending paramedics manually recorded the pLA from the point-of-care analyzer into the ePCR. Prehospital records were accessed from the ACTAS clinical data warehouse. Hospital-based data were primarily collected from Clinical Research Information System (CRIS), and sLA was collected from Pathology Clinical Integration System (CIS). In addition to pLA and sLA, gender, time of lactate collection, age, time of hospital arrival, and time of any cardiac arrests were recorded. Prehospital times were recorded on the ePCR by paramedics, and hospital sLA times were recorded on the blood gas analyzer by hospital medical staff. No attempt was made to synchronize times.
Prehospital and hospital records were linked by one author (KS) using name, gender, date of birth, and time of admission. Once the data were linked, all identifying information was stripped to ensure patient anonymity. This project was approved by the ACT Health Human Research Ethics Committee (ETHLR.15.171; September 8, 2015).
Statistical Analyses
A prospective cross-sectional study by MikamiReference Mikami, Ohde, Deshpande, Mochizuki, Otani and Ishimatsu 21 determined that the most accurate equation to predict arterial lactate from venous lactate was: arterial lactate=-0. 259+venous lactate x 0.996. For the purposes of this study, since pLA is measured on venous or capillary blood, any arterial sLA samples were converted to venous sLA using this equation. They were then rounded to one decimal place prior to statistical comparison. These new values were known as adjusted sLA.
Statistical analysis was performed using IBM SPSS Statistics for Windows version 20 (IBM Corp; Armonk, New York USA). Inferential tests were two-tailed with an alpha-level of 0.05. Descriptive statistics were completed to determine the age and gender breakdown and the average time between sLA and pLA. Box plots for pLA and adjusted sLA were completed to determine skewness and a scatterplot to visually display the raw data points. Statistics are reported as either mean (standard deviation) or median (interquartile range). To check for time as a potential confounder, the time between lactate measurements was split into <60 minutes, 60-120 minutes, and >120 minutes.
The level of agreement between pLA and sLA was evaluated using procedures proposed by Bland and Altman.Reference Bland and Altman 22 , Reference Bland and Altman 23 This method compares the mean of the two different measures against the difference between the measurements. From this, a 95% confidence interval (CI) is derived to determine the limits of agreement between the two methods. If the CI is narrower than a pre-determined cut-off, then the two measurements are said to be interchangeable. The cut-off is determined clinically based on what is being measured; for this study, a difference of less than 0.5 mMol/L was considered a clinically acceptable level of agreement.
Elevated blood lactate levels of ≥2 mMol/L,Reference Anderson, Mackenhauer, Roberts, Berg, Cocchi and Donnino 6 >3 mMol/L,Reference Okorie and Dellinger 2 or ≥4 mMol/LReference van Beest, Mulder, Oetomo, van den Broek, Kuiper and Spronk 24 can be classified as hyperlactatemia, depending on different journal articles, but there is no consensus on the value currently. The ACTAS uses a cut-off of <2 mMol/l for normal lactate; that cut-off was adopted for this study.
Results
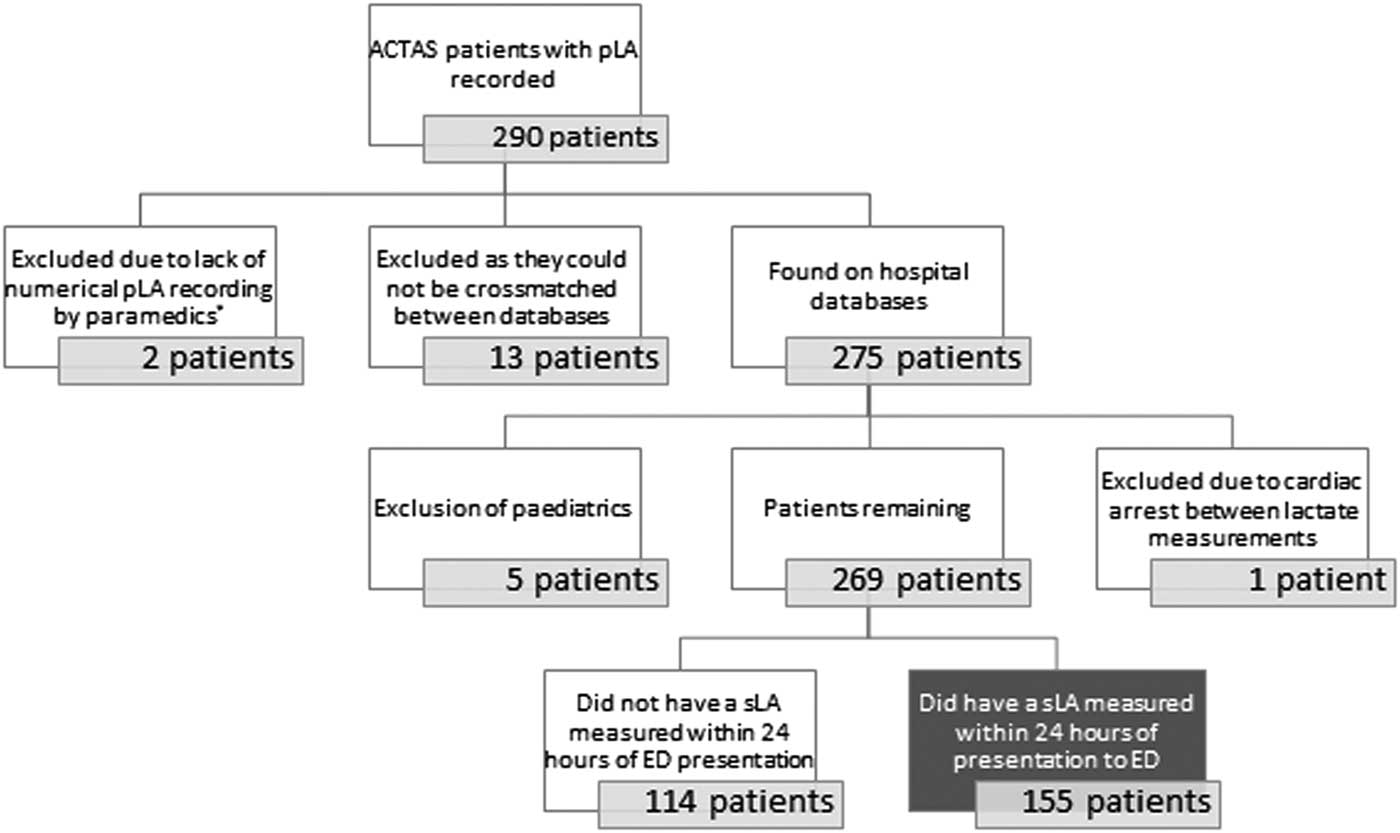
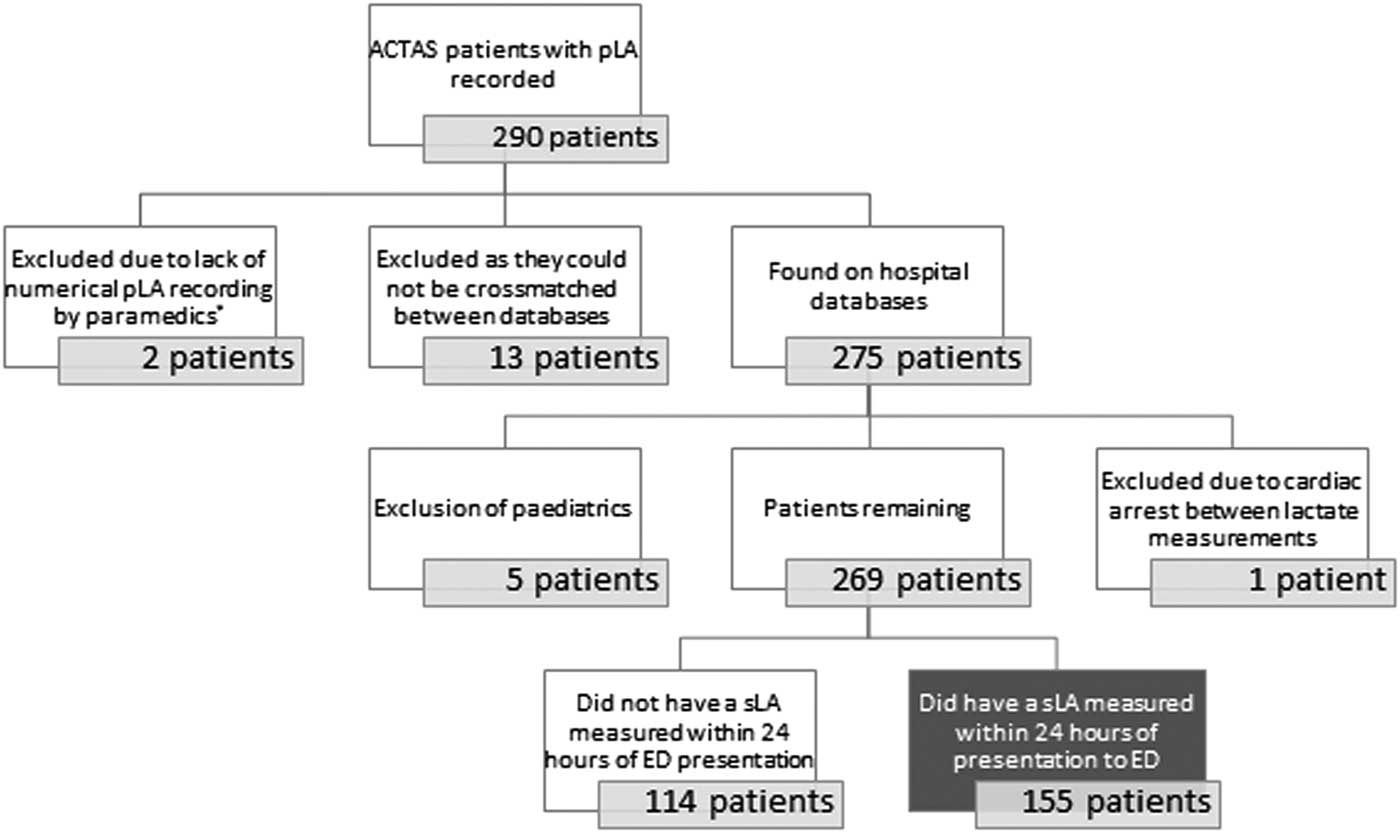
During the study period, 290 patients were transported with a pLA recorded. Of these, 275 were able to be linked to hospital data. After exclusions (Figure 1), there were 155 patients remaining who had an sLA recorded within 24 hours of their pLA measurement.
Patient Inclusions, Exclusions, and Groups for Statistical Analysis. Abbreviations: ACTAS, Australian Capital Territory Ambulance Service; ED, emergency department; pLA, point-of-care lactate; sLA, serum lactate. *In place of numerical lactate, “lactate monitor malfunction” and “inaccurate reading” were recorded.
Missing Data Analysis
Given the large number of participants who had a recorded pLA but no sLA recorded within 24 hours, those with an sLA (n=155) were compared to those without (n=114). There was no difference in age between the two groups (mean 69.4 years [SD=20.6] vs 71.1 years [SD=18.3]; t(267)=-0.686; P>.05); however, there were more males in the group with a recorded sLA (54.8% vs 43.0%; Chi-squared (1)=3.69; P=.055). Taken as a continuous variable, pLA was higher in the group that had sLA recorded (median: 3.0mMol/l [IQR=2.0] vs 1.95 mMol/l [IQR=1.7]; t(267)=-3.667; P<.001). Taken as a categorical variable (normal: <2 mMol/l; elevated: ≥2 mMol/l) in the total population (n=269), sLA was more likely to be measured when pLA was elevated than when it was normal (76.1% vs 23.9%; OR 3.18; 95% CI, 1.88 to 5.37; P<.0001).
Level of Agreement between pLA and sLA
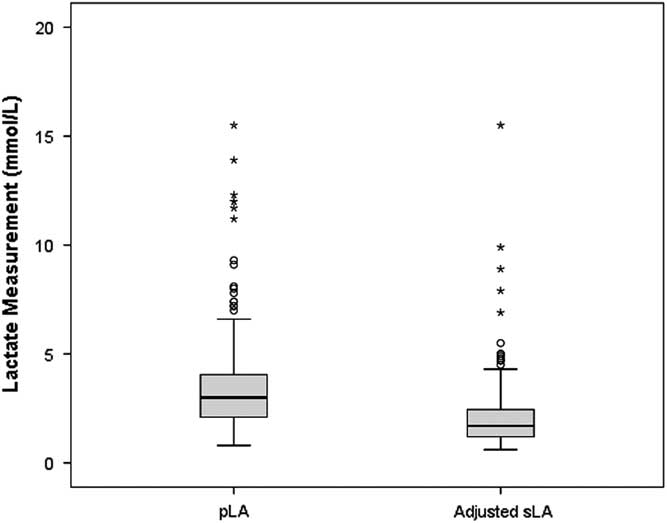
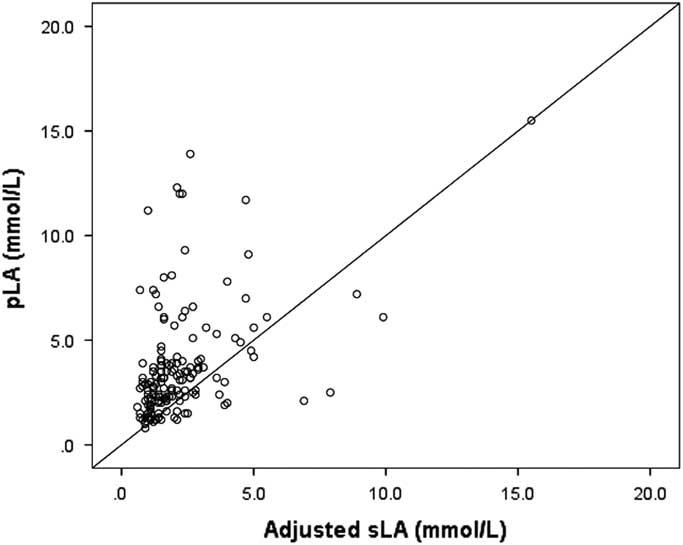
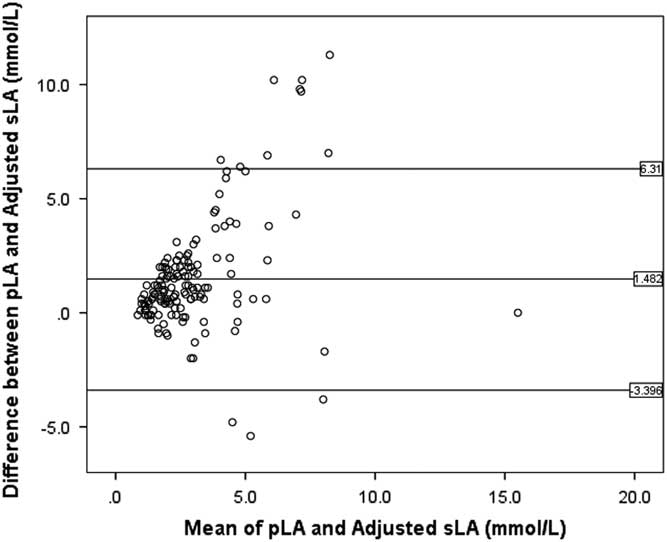
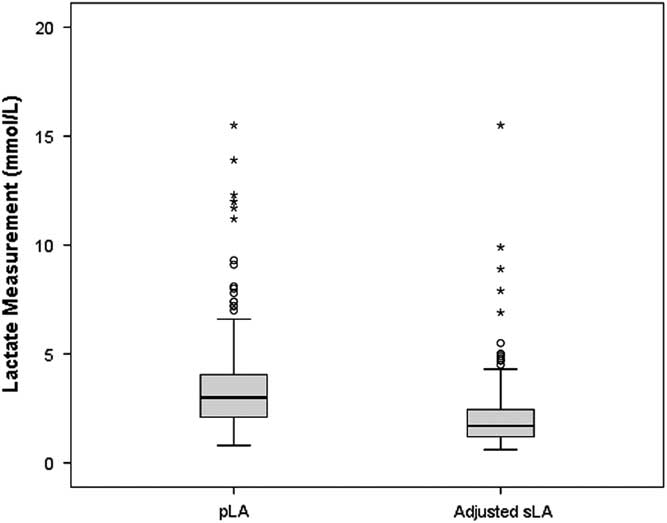
Considering only those participants with sLA recorded (n=155), 54.8% were male with a mean age of 71.1 years (SD=18.3). The median time between pLA and sLA was 89 minutes (IQR=75). The median pLA was 3.0 mMol/L (IQR=2.0) and the median adjusted sLA was 1.7 mMol/L (IQR=1.3). Both pLA and adjusted sLA had similar distribution with a positive skew (Figure 2). Figure 3 shows a scatterplot of pLA and adjusted sLA. Using Wilcoxon’s signed rank test, there was a significant difference between pLA and adjusted sLA (W=10508; P<.001). An analysis was conducted to determine the level of agreement between pLA and adjusted sLA using methods developed by Bland and Altman (Figure 4; n=155). Using this method, there was a mean difference between pLA and adjusted sLA of 1.48 mMol/L (95% CI, -3.34 to 6.31).
Box Pot of pLA and Adjusted sLA Values (n=155). Abbreviations: pLA, point-of-care lactate; sLA, serum lactate.
Scatterplot of pLA and Adjusted sLA with Line of Equality (n=155). Abbreviations: pLA, point-of-care lactate; sLA, serum lactate.

Bland-Altman Plot for All pLA, Compared to its Corresponding Adjusted sLA (n=155). Abbreviations: pLA, point-of-care lactate; sLA, serum lactate.

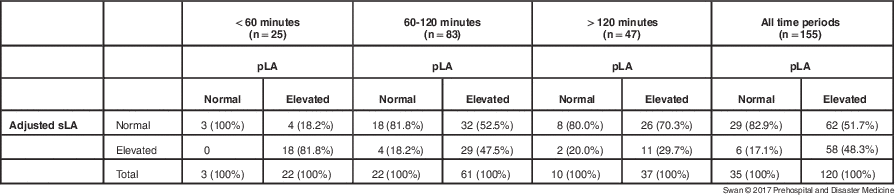
Considered as a categorical variable, normal pLA was likely to be a true negative in 82.9% of cases, and elevated pLA was likely to be a true positive in 48.3% of cases (Table 1; OR=4.52; 95% CI, 1.75-11.68; P=.002).
2x2 Tables Comparing pLA and Adjusted sLA, Split by the Time between the pLA and sLA Measurements

Abbreviations: pLA, point-of-care lactate; sLA, serum lactate.
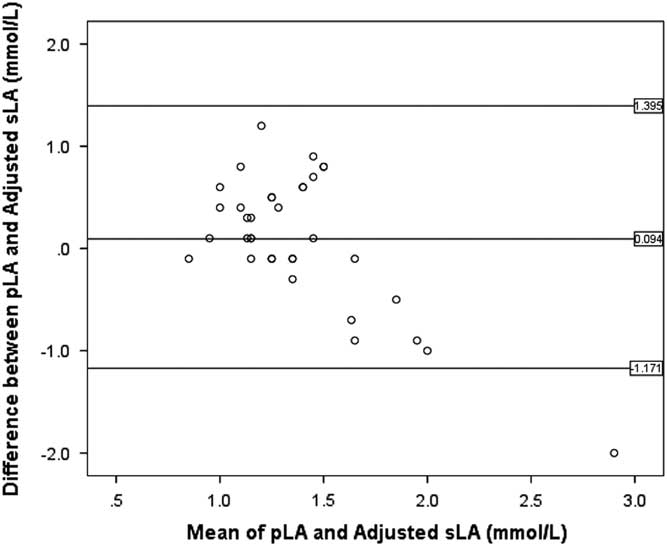
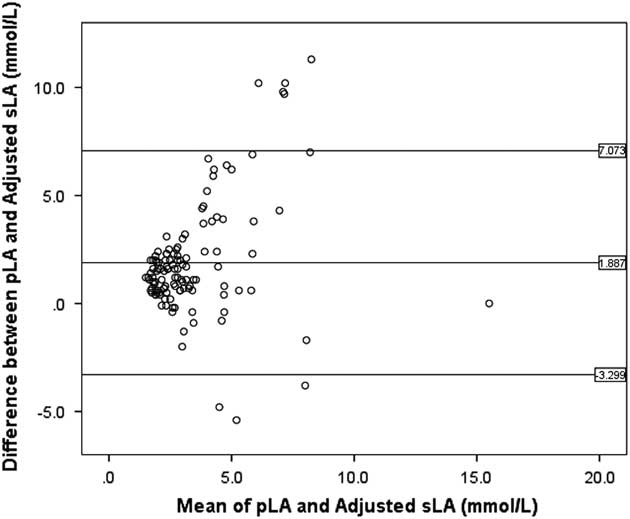
In those participants with normal pLA (<2 mMol/L; n=35), the median pLA was 1.3 mMol/L (IQR=0.4) and the median adjusted sLA was 1.1mMol/l (IQR=0.4) with a difference of 0.2 mMol/L (Wilcoxon signed rank=399.5; P>.05). When a Bland-Altman analysis was conducted only on those participants with a normal pLA (Figure 5), the mean difference was 0.09 mMol/L (95% CI, -1.17 to 1.40). For those participants with elevated pLA, measured pLA was higher than adjusted sLA (median: 3.5 mMol/L [IQR= 2.5] vs 1.9 mMol/L [IQR=1.3]; Wilcoxon signed rank=6533; P<.001). A Bland-Altman analysis conducted on those with elevated pLA (Figure 6) found a mean difference of 1.89 mMol/L (95% CI, -3.30 to 7.07).
Bland-Altman Plot for Normal Category pLA (n=35), Compared to its Corresponding Adjusted sLA. Abbreviations: pLA, point-of-care lactate; sLA, serum lactate.

Bland-Altman Plot for Elevated Category pLA (n=120), Compared to its Corresponding Adjusted sLA. Abbreviations: pLA, point-of-care lactate; sLA, serum lactate.

Results Split by Time Interval
In order to determine if the time between pLA and sLA being taken affected the reliability of pLA, the accuracy rate was considered for three different time periods (<60 minutes, 60-120 minutes, and >120 minutes; Table 1). When the time between pLA and sLA was less than 60 minutes (n=25), a normal pLA predicted normal sLA with 100% accuracy, with a false-positive rate of 18.2%. When the time interval was 60-120 minutes (n=83), normal pLA was 86.4% accurate and the false-positive rate was 52.5%. When the interval exceeded 120 minutes (n=47), accuracy for normal pLA was 80.0% and false-positives were 70.3%.
Discussion
Overall, the level of agreement between pLA and adjusted sLA is poor. Using Bland and Altman’s level of agreement methods, there was a mean difference of 1.49 mMol/L with pLA overestimating adjusted sLA. The 95% CI well exceeded the 0.5 mMol/L cut-off established prior. On this basis, pLA and sLA cannot be reliably used interchangeably. A prospective study of 699 ED patients demonstrated that pLA is on average 0.32 mMol/L lower than sLA.Reference Shapiro, Fisher and Donnino 17 This is in contrast to the current study which found an average over-estimation of sLA by pLA.
The level of agreement improved when only normal pLA (<2 mMol/L) was considered; the average over-estimation in this group was only 0.1 mMol/L, but the 95% CI was still greater than 0.5 mMol/L. It is possible to use pLA as a screen and report the results as a categorical variable (ie, normal or elevated). When considered this way, pLA performed much better; pLA appears to be more useful as a screening tool for elevated lactate rather than as a quantitative measure, though larger prospective trials would be needed to confirm this.
One previous study showed the mean time between in-hospital pLA and sLA was 65 minutes.Reference Gaieski, Drumheller, Goyal, Fuchs, Shofer and Zogby 16 Another demonstrated that the median time from triage to in-hospital pLA was 21 minutes,Reference Goyal, Pines, Drumheller and Gaieski 13 and the median time from triage to sLA lactate was 172 minutes.Reference Goyal, Pines, Drumheller and Gaieski 13 From this, it can be seen that there can be a significant delay between patient presentation at hospital and sLA measurement. This was also reflected in the current study, which found a median 89-minute interval between pLA and sLA.
Lactate is sensitive to a range of treatment options available to the ED, so it is perhaps unsurprising that the accuracy of pLA diminished markedly as the time between the two measurements increased. When the time between pLA and sLA was less than 60 minutes, a normal pLA predicted a normal sLA, with a false-positive rate of 18.2%. As the time interval between the measurements increased, the false-positive rate increased to 52.5% (60-120 minutes) and 70.3% (>120 minutes). No attempt was made to control for any treatments provided to the participants that may have affected their lactate levels, which is a limitation of the study.
This study considered a threshold of ≥2 mMol/L for elevated lactate and found this to be a reasonable threshold in this cohort. The choice of threshold is important if pLA is to be used as a screening tool. Further research should be undertaken to determine the best cut-off for various conditions.
Of the 269 patients who fit the inclusion criteria, only 57.6% had a sLA measured within 24 hours of arrival. This constrained the sample size remarkably, reducing the overall power of the study. Of interest, however, was the possible evidence that clinicians are already using pLA as a screening tool. When pLA was elevated, sLA was much more likely to be measured than when pLA was normal. It is possible that hospital clinicians may be using a normal pLA as evidence that sLA does not need to be measured. Again, a larger prospective trial is needed to confirm this hypothesis.
Limitations
As well as the inherent limitations of retrospective cohort studies, the current study was limited by not attempting to control for a range of factors, particularly the treatment provided to patients during their ambulance transport or after their arrival to ED. Such treatments have the potential to affect sLA considerably, particularly as the time interval between measurements increases. Similarly, while this study found poor levels of agreement between pLA and sLA, it has raised the potential of using pLA as a screening tool. However, by not measuring patient outcome in this study, the use of pLA as a screening tool remains a hypothesis.
Conclusion
This retrospective clinical audit compared prehospital lactate with sLA, and found poor levels of agreement between the two measures, particularly as the time interval between them increased. However, prehospital lactate performed better when considered as a categorical variable, showing reasonable performance at predicting sLA using a threshold of 2.0 mMol/L. Further prospective studies are required to establish the role of prehospital lactate measurement.
Acknowledgements
The authors thank Kathryn Nicholls from the Canberra Hospital Clinical Record Service for her assistance in facilitating data collection.