


I. INTRODUCTION
Gallium nitride (GaN) has garnered significant attention in recent years for its wide use as a semiconductor material and its low density of defects. Reference Reshchikov and Morkoc1 GaN nanowires (NWs), Reference Philipps, Müntze, Hille, Wallys, Schörmann, Teubert, Hofmann and Eickhoff2 nanoparticles Reference Slimane, Najar, Elafandy, San-Román-Alerigi Dá, Anjum, Ng and Ooi3 and nanotubes Reference Goldberger, He, Zhang, Lee, Yan, Choi and Yang4 have various applications within optoelectronic devices, Reference Kuykendall, Pauzauskie, Zhang, Goldberger, Sirbuly, Denlinger and Yang5,Reference Zhang, Zhang, Wang, Liang, Peng and Wang6 white LEDs, Reference Nguyen, Zhang, Cui, Han, Fathololoumi, Couillard, Botton and Mi7 and directional white light sources. Reference Schwartzberg, Aloni, Kuykendall, Schuck and Urban8 Variations on NW structures such as core/shell structures, p- and n-type doping, and NWs with incorporated quantum dots display a wealth of PL behaviors. Reference Sanders, Blanchard, Bertness, Brubaker, Dodson, Harvey, Herrero, Rourke, Schlager, Sanford, Chiaramonti, Davydov, Motayed and Tsvetkov9–Reference Zhao, Kibria, Wang, Nguyen and Mi12 GaN has also been suggested for use as a catalyst in water splitting using bulk, nanomaterials, and even specific GaN surfaces. Reference Philipps, Müntze, Hille, Wallys, Schörmann, Teubert, Hofmann and Eickhoff2,Reference Kuykendall, Aloni, Jen-La Plante and Mokari10,Reference Ohno, Bai, Hisatomi, Maeda and Domen13–Reference Abe17 The use of GaN surfaces for photocatalytic processes is especially attractive since photo-excited carriers are created at the surface, making them readily available to interact with the surrounding medium. Reference Qiu, Zeng, Ha, Ge, Lin, Hettick, Hou, Alexandrova, Javey and Cronin18
Many studies of GaN PL over the years have utilized excitation at or above the band gap (3.4 eV), producing band-edge luminescence and the widely reported yellow band luminescence. Reference Singh, Molnar, Ünlü and Moustakas19–Reference Wang, Talin, Werder, Creighton, Lai, Anderson and Arslan23 However, few experiments have excited directly into mid-gap states. Reference Reshchikov, Morkoç, Park and Lee24 Some researchers have used excitations below 3.4 eV but have accessed the conduction band via multiphoton processes in both bulk GaN Reference Toda, Matsubara, Morita, Yamashita, Hoshino, Someya and Arakawa25,Reference Schuck, Grober, Roskowski, Einfeldt and Davis26 and NWs. Reference Schwartzberg, Aloni, Kuykendall, Schuck and Urban8 Despite a bulk band gap in the ultraviolet, GaN thin films and nanostructures can exhibit unusually strong and broad emission across the entire visible spectrum, Reference Schwartzberg, Aloni, Kuykendall, Schuck and Urban8,Reference Lähnemann, Hauswald, Wölz, Jahn, Hanke, Geelhaar and Brandt11,Reference Chin, Ahn, Li, Vaddiraji, Bardeen, Ning and Sunkara27–Reference Chen, Yeh, Chen, Yu, Liu, Wu, Chen, Chen, Peng and Chen29 which have been attributed to surface states and defects at the surface and in the bulk. Reference Reshchikov and Morkoc1,Reference Philipps, Müntze, Hille, Wallys, Schörmann, Teubert, Hofmann and Eickhoff2,Reference Kuykendall, Aloni, Jen-La Plante and Mokari10,Reference Chin, Ahn, Li, Vaddiraji, Bardeen, Ning and Sunkara27 The exceptionally broad emission spectrum suggests a wide manifold of states existing well below the bulk conduction band edge.
Various methods have been used to investigate defects and/or surface states present in nanostructures. Some researchers have observed PL differences in dense forests of NWs with different orientations (e.g., a-axis and c-axis GaN NWs), Reference Chin, Ahn, Li, Vaddiraji, Bardeen, Ning and Sunkara27 while others have used near-field measurements to probe surface defect states and other variations along the nanostructure. Reference Bao, Melli, Caselli, Riboli, Wiersma, Staffaroni, Choo, Ogletree, Aloni, Bokor, Cabrini, Intonti, Salmeron, Yablonovitch, Schuck and Weber-Bargioni30 Other investigators have used cathodoluminescence (CL) to reveal differences between the bulk material and surfaces, Reference Li and Wang21 distinctions between a-axis and m-axis NWs, Reference Kuykendall, Altoe, Ogletree and Aloni31 and CL spectral variations within the NW itself. Reference Lähnemann, Hauswald, Wölz, Jahn, Hanke, Geelhaar and Brandt11 Furthermore, optical confocal measurements Reference Bao, Melli, Caselli, Riboli, Wiersma, Staffaroni, Choo, Ogletree, Aloni, Bokor, Cabrini, Intonti, Salmeron, Yablonovitch, Schuck and Weber-Bargioni30 have revealed a distinct spectrum from the NW end facets. Reference Schwartzberg, Aloni, Kuykendall, Schuck and Urban8
In this work, we use confocal hyperspectral imaging to record the emission spectra from different facets of GaN NWs with diffraction-limited spatial resolution. The GaN NWs have triangular cross sections, which expose different crystallographic terminations along the different facets. Our measurements reveal for the first time distinct emission spectra associated with those different facets. Moreover, the emission spectra from these facets blue-shift when the power of the excitation laser is increased, and emission collected from the ends of the NWs often exhibits distinct spectral characteristics. We present a simple qualitative model in which the PL results from direct excitation into a broad manifold of surface-associated states which are rapidly populated at a high excitation intensity and which can couple to etalon modes via longitudinal photon emission. This nanosystem provides the unique opportunity to investigate different GaN surfaces simultaneously, a comparison that is virtually impossible with bulk GaN samples.
II. SAMPLE PREPARATION
Our GaN NWs are grown via metal–organic chemical vapor deposition (MOCVD) along the a-axis
 $\left[ {11\bar 20} \right]$
, leading to an overall wurtzite crystalline structure with a triangular cross section. The NWs were grown using a nickel catalyst and various substrates that matched the structure and lattice constants of GaN, and TEM analysis show no crystallographic defects in the bulk of the NW. Additional specifics on the growth and NW structure are discussed elsewhere.
Reference Kuykendall, Altoe, Ogletree and Aloni31
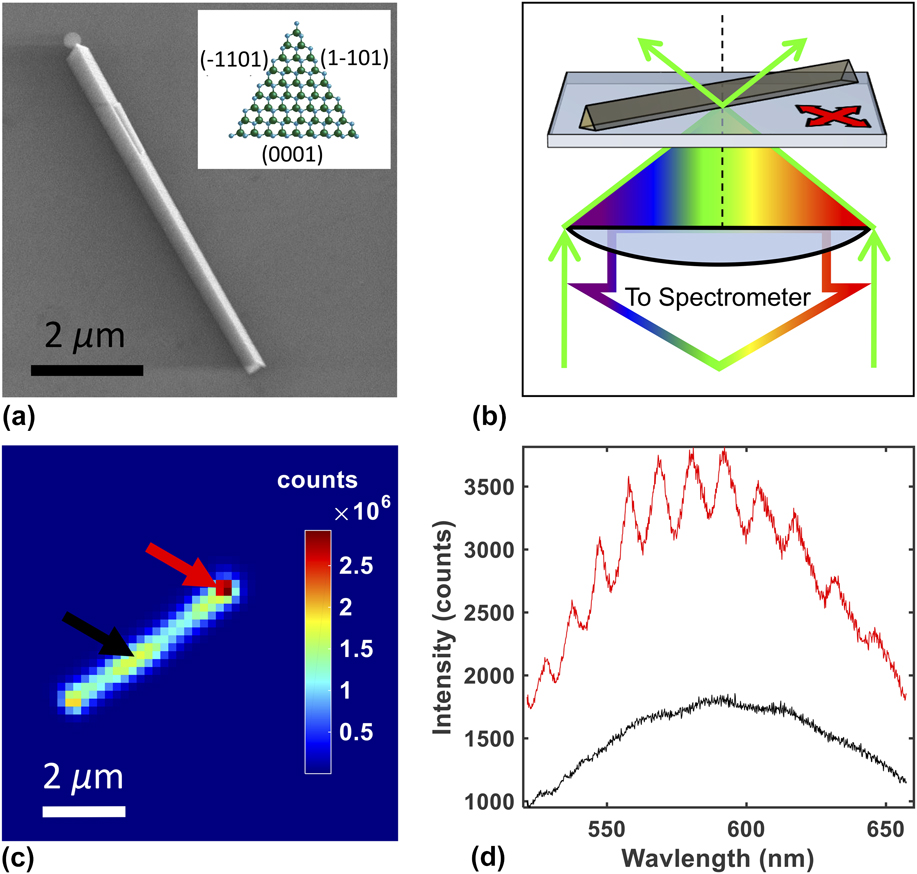
Following the growth, the NWs were mechanically transferred to clean glass cover slips (0.13–0.16 mm thick) by sliding the NW growth substrate across 30 μL of methanol deposited on the cover slip. Excess methanol was allowed to evaporate after transfer, allowing isolated, single NWs to settle onto the coverslip for PL measurements, often resulting in cleanly cleaved NWs with a-plane end-facets, a single polar c-plane longitudinal facet (0001), and two semipolar longitudinal facets,
 $\left( {\bar 1101} \right)$
and
 $\left( {1\bar 101} \right)$
Reference Wang, Talin, Werder, Creighton, Lai, Anderson and Arslan23
[see Fig. 1(a)]. The
 $\left( {\bar 1101} \right)$
and
 $\left( {1\bar 101} \right)$
semipolar planes are crystallographically related (see Supplementary Material). SEM and AFM measurements showed that many of the triangular GaN NWs were tapered at one end, which could be a result of competing sidewall growth.
Reference Li and Wang21
AFM measurements reveal that the NWs vary in length between 1 and 20 µm and have triangular cross sections with edge lengths between 100 and 700 nm.
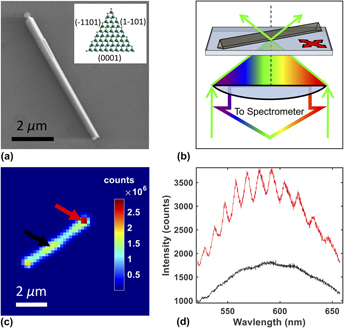
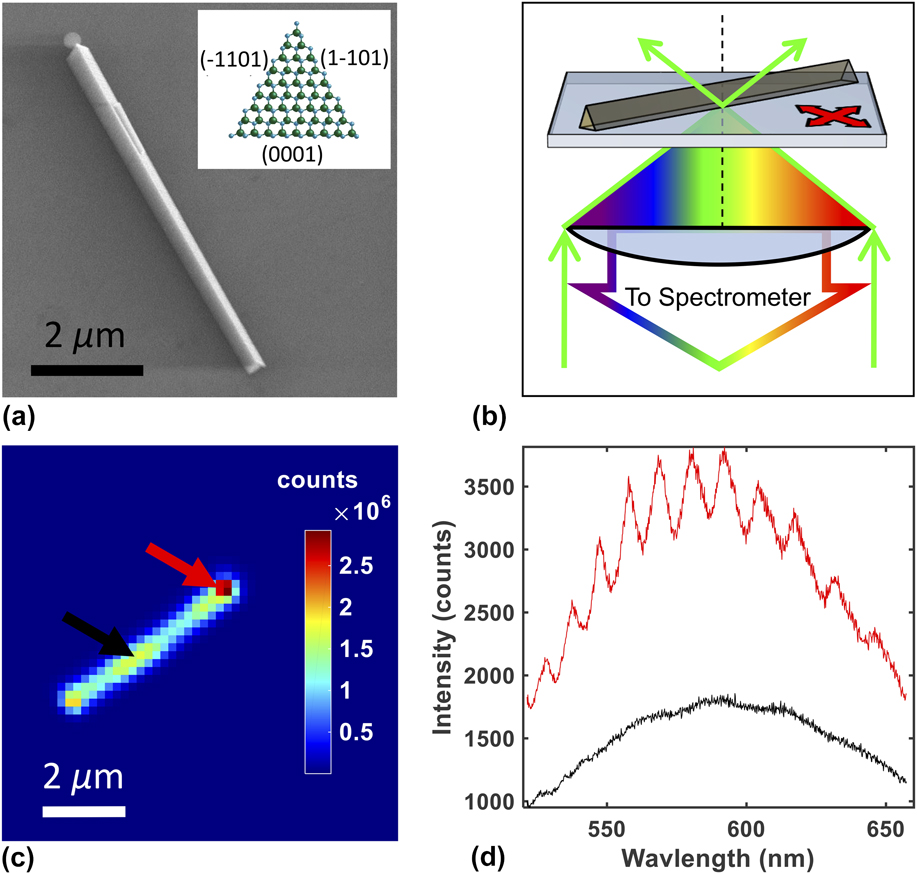
(a) Scanning electron microscopy image of a nanowire. Inset indicates the wurtzite crystallographic terminations of the nanowire facets. (b) Confocal microspectroscopy system. Resulting NW fluorescence passes back though the objective lens to the spectrometer while the stage scans the sample to create hyper-spectral images. (c) Hyper-spectral integrated intensity image where each pixel is the integrated intensity at that specific point. (d) Individual spectra from the end and the mid-point of the NW as indicated by corresponding colored arrows in panel c. High intensity end-points exhibit interference fringes.
III. EXPERIMENTAL METHODS
PL data was collected under ambient conditions on a commercial WITec Alpha SNOM-300 confocal micro-spectroscopy system (WITec, Ulm, Germany). A 488-nm wavelength excitation laser was coupled to the microscope through an optical fiber and focused onto the NW sample using a Nikon 100× magnification, 1.4 numerical aperture oil-immersion objective lens [Nikon, Melville, New York; see Fig. 1(b)]. The resulting PL was analyzed using a spectrometer with a 600 g/mm grating. For these experiments, the spectrometer had a spectral range of 526–652 nm. Excitation intensity-dependent measurements were performed by attenuating the excitation laser with various neutral density filters.
The confocal setup simultaneously excited and collected a fluorescence spectra from a diffraction-limited volume with a spot size approximately 350 nm in diameter. The NW sample was raster-scanned through this focal spot using a piezo-electric actuator while the spectra were collected pixel by pixel (70 × 70 to 200 × 200 pixels typical), allowing the construction of hyperspectral images (see Fig. 1). To create a PL intensity image [Fig. 1(c)], the spectrum acquired at each pixel was integrated over the entire wavelength range of the spectrometer. Individual spectra were background subtracted; a background spectrum was generated by averaging the spectra from the 1% of pixels with the lowest signal. These hyperspectral images were used to reveal variations in the PL spectrum at different spatial points on the NW, both parallel and transverse to the NW longitudinal axis [see Fig. 1(d)]. The observed broad emission spectra are consistent with previous measurements by other groups. Reference Schwartzberg, Aloni, Kuykendall, Schuck and Urban8
To visualize spectral variations along the NW, we calculated the first moment or spectral center of mass (SCOM) of the emission spectrum at each spatial pixel:
 $${\rm{SCOM}} = {{\sum {\left[ {\lambda \cdot I\left( \lambda \right)} \right]} } \over {\sum {I\left( \lambda \right)} }}\quad ,$$
where λ is the wavelength (in nm) and I(λ) is the intensity corresponding to each wavelength. The summation is performed over the entire wavelength range of the spectrometer. The calculated SCOM value and resultant SCOM images allow visualization of the spectral variation along the NW, while being model independent. To facilitate visualization, we applied a bicubic interpolation to the PL intensity images and SCOM images yielding an output pixel value as the weighted average of original pixels in the nearest 4 × 4 area.
IV. RESULTS
Upon measuring various NWs using our confocal microspectroscopy system, we typically observed two different patterns in the SCOM images: those in which the emission spectrum (characterized by the SCOM value) varied relatively little along the NW, neither longitudinally nor transversely (radially uniform: Fig. 2) and those in which the SCOM values on either side of the longitudinal axis were distinct (radially asymmetric: Fig. 3). Additionally, most NWs exhibited a “halo” in the SCOM image: an annular region along the periphery of the NW where the SCOM values are shifted to the red compared to the NW itself. Further discussions for these observations appear below.
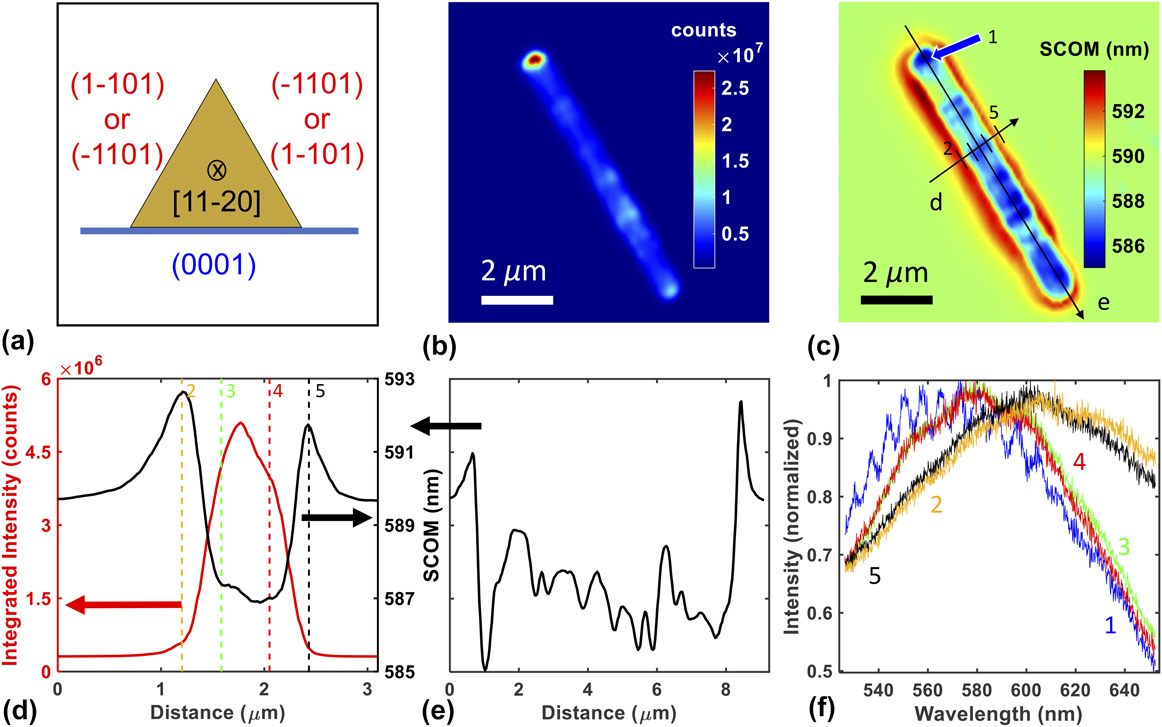
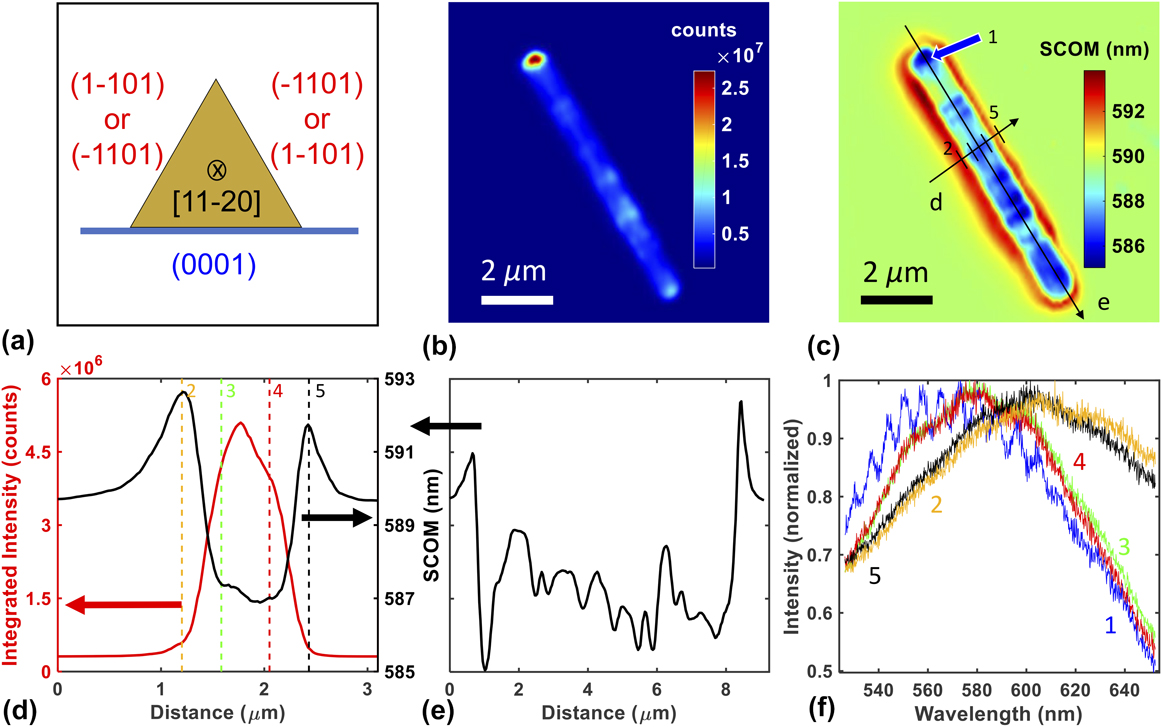
Confocal hyper-spectral images for a NW exhibiting a radially uniform image pattern. (a) Cartoon of the NW cross section showing two similar terminations on the upper surfaces. (b) Intensity image of the NW. (c) SCOM image of the NW. Drawn lines indicate positions of line profiles in panels d and e. Arrow and line cross hatches correspond to the pixel positions of individual spectra shown in panel f with their corresponding number identifiers. (d) Transverse SCOM and intensity profiles along the line indicated in panel c. Colored vertical lines indicate the relative positions of the selected spectra along the profile shown in panel f with numbered positions corresponding to panel c. (e) Longitudinal SCOM profile along axis of the NW as shown in panel c. (f) Five individual spectra taken from pixels indicated in panels c and d with corresponding colors. The blue curve was acquired near the end facet of the NW (note the modulation and blue shift). All spectra were scaled to the blue spectra with the following scaling factors: blue spectra 1: ×1.0, orange spectra 2: ×51.6, green spectra 3: ×6.1, red spectra 4: ×6.8, and black spectra 5: ×54.2 (larger scaling factor indicates weaker emission).
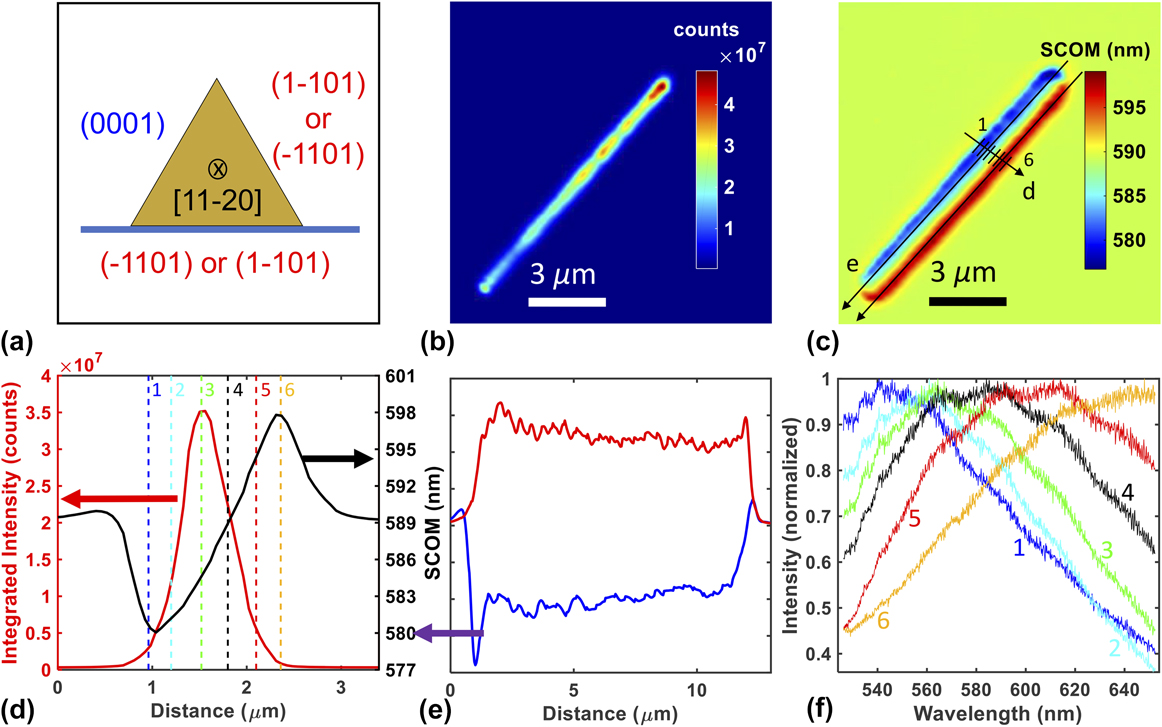
Confocal hyper-spectral images of a NW exhibiting a RA image pattern. (a) Cartoon of the NW cross section showing two dissimilar terminations on the upper surfaces. (b) Intensity image of the NW (c) SCOM image of the NW. Drawn lines indicate positions of line profiles shown in panels d and e. Line cross hatches correspond to the pixel positions of individual spectra shown in panel f with their corresponding number identifiers. (d) Transverse SCOM and intensity profile along the line indicated in panel c. Colored vertical lines indicate the relative positions of the selected spectra along the profile shown in panel f with numbered positions corresponding to panel c. (e) Longitudinal SCOM profiles along both sides of the NW as shown in panel c, with colors indicating the red or blue side of the NW respectively. (f) Six individual spectra taken from pixels indicated in panels c and d with corresponding colors. All spectra were scaled to the green spectra with the following scaling factors: blue spectra 1: ×12.0, cyan spectra 2: ×2.5, green spectra 3: ×1.0, black spectra 4: ×1.7, red spectra 5: ×6.4, and gold spectra 6: ×45.9 (larger scaling factor indicates weaker emission).

The integrated intensity image in Fig. 2(b) for a NW exhibiting a radially uniform (RU) image pattern reveals relatively little intensity variation along the length of the NW, except at the bright ends. Similarly, the SCOM image in Fig. 2(c) indicates a fairly consistent emission spectrum, showing little variation in the SCOM along the transverse and longitudinal directions of the NW. Cross sections shown in Figs. 2(d) and 2(e) provide more quantitative evidence of these small variations [note the scale in Fig. 2(e)]. Figure 2(f) shows the collected emission spectra from five spatial locations indicated in Fig. 2(c). Spectra from the two sides of the triangular cross section exhibit very similar shape and intensities (red and green curves), while spectra from the edges of the NW (in the halo region, orange and black curves) exhibit lower intensity and are red-shifted. The emission spectrum from the end of the NW (blue curve) exhibits clear modulations, which are associated with longitudinal etalon modes as discussed below.
The integrated intensity image for a NW exhibiting a radially asymmetric (RA) image pattern shown in Fig. 3(b) also reveals little intensity variation except at the bright ends. However, the SCOM image in Fig. 3(c) shows two distinct regions separated by the longitudinal axis of the NW. A transverse profile of the SCOM image shown in Fig. 3(d) further quantifies the difference between the “red” and “blue” side of the NW, while the longitudinal profile in Fig. 3(e) again demonstrates relatively little variation along the NW length, yet different SCOM values along each side of the NW. The emission spectra shown in Fig. 3(f) confirm that the large shifts in the SCOM value from one side of the longitudinal axis to the other result from differences in the shape of the emission spectra at these locations.
The emission collected near the end facets of the NWs often has higher intensity and exhibits interference fringes [e.g., see Figs. 2(b) and 2(f)]. There is a strong correlation between these two aspects of the end-facet emission; furthermore, when fringes are present, the spectral peak (and SCOM) is typically blue-shifted relative to the emission from nearby areas of the NW. Bright ends accompanied by spectral fringes from GaN NWs have been observed previously Reference Schwartzberg, Aloni, Kuykendall, Schuck and Urban8 and have been attributed to etalon action within the NW due to the relatively high index of refraction for GaN (∼2.5). The implications of this effect are discussed in more detail below.
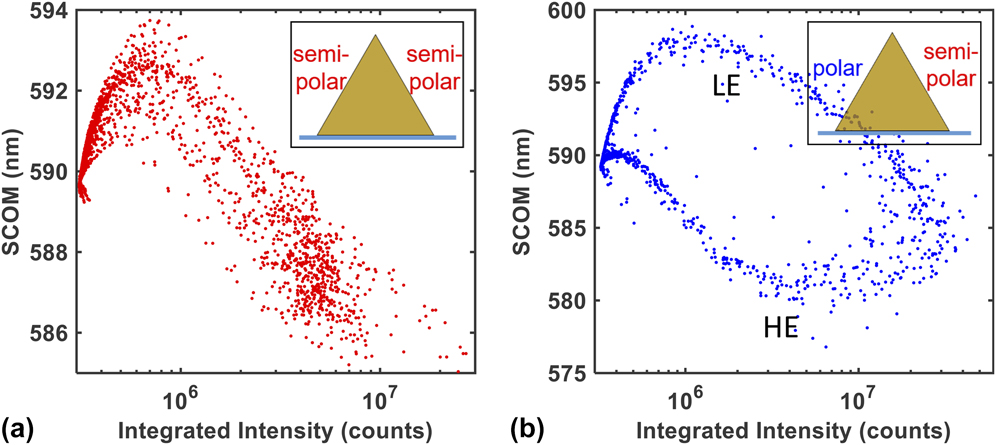
To gain additional insight into the origin of the RU and RA image patterns, each pixel’s SCOM was plotted against its integrated intensity (without background subtraction) to create a SCOM–Intensity (S–I) plot (see Fig. 4). RA image patterns exhibit two branches in the S–I plots [Fig. 4(b)], while RU patterns exhibit only a single branch [Fig. 4(a)]. The detailed shapes of the branches result from a complex interplay of the intensity profile of the laser focus and its position along the NW (see Supplementary Material), but three important features are mentioned here. First, the upper branch in the RA S–I plot [Fig. 4(b)] is similar in shape to the RU plot [Fig. 4(a)], suggesting that these branches arise from the same mechanism. Second, the low- and high-energy (LE, HE) branches of Fig. 4(b) meet at an intermediate SCOM value at the highest signal intensities corresponding to laser beam positions along the apical backbone of the triangular cross section where the diffraction limited laser focus (∼350 nm spot size) illuminates both sides of the NW in roughly equal measures. Finally, points in the RA S–I plot [Fig. 4(b)] between ∼7 × 10⁵ and ∼5 × 10⁶ counts correspond to spatial positions of the laser focus along the periphery of the NW where the diffraction-limited laser focus illuminates both the NW and the surrounding halo region simultaneously. The halo region is a ubiquitous feature of the SCOM images (e.g., Figs. 2 and 3) and produces SCOM values intermediate between the red and blue sides of the NW (∼590 nm).
SCOM-Intensity (S–I) plots of all pixels for (a) radially uniform (RU) and (b) radially asymmetric (RA) image pattern that correspond to the NWs in Figs. 2 and 3, respectively. Insets indicate corresponding NW orientation. The RA S–I plot contains two branches of different SCOM values (LE and HE) that eventually meet at high and low integrated intensity.

Although prominent in SCOM images [e.g., Fig. 2(c)], the halo is not a dominant feature of the data in that the emitted signal from this region is very small compared to the body of the NW. The halo’s origin is not certain, but it may arise from excitation of the NW by the weak airy rings of the laser focus, particularly if the focus is tilted somewhat relative to the optic axis. In addition, the emission might couple into weakly propagating modes along the glass surface, where it could be scattered into far-field field modes and collected. Finally, the halo could result from a submonolayer film of GaN dissolved and later precipitated around the NW structures during the methanol-facilitated transfer of the NWs from the growth substrate to the glass sample slide, but this seems highly improbable. Further experiments and modeling are needed to differentiate between these or other possible origins for the halo.
V. ANALYSIS AND DISCUSSION
Laser excitation at 488-nm (2.54 eV) produced strong fluorescence across the visible spectrum suggesting the presence of optically active states below the conduction-band edge. Visible fluorescence from GaN thin films has been observed previously and has been attributed to various defect states within the bulk. On the other hand, density functional theory calculations for slab-like unit cells corresponding to GaN nonpolar m-plane
 $\left( {1\bar 100} \right)$
, polar c-plane (0001), and semipolar
 $\left( {11\bar 22} \right)$
and
 $\left( {1\bar 101} \right)$
surfaces point to surface states within the gap.
Reference Neaton and Zayak16,Reference Van de Walle and Segev32
The dependence of the total emission intensity on the power of the 488-nm excitation laser was found to be linear (see Supplementary Material), indicating that the emission results from a one-photon process, namely direct excitation into the mid-gap manifold of states.
Reference Schwartzberg, Aloni, Kuykendall, Schuck and Urban8,Reference Lakowicz33
The RU and RA SCOM patterns shown in Figs. 2 and 3, respectively, are representative of measurements on ∼50 total NWs. The difference between these two patterns is explained by the fact that the NW growth process yields two similar (semipolar) and one distinct (polar) crystallographic surface terminations along the three longitudinal facets, corresponding to the triangular cross section (see above). When the NWs are cleaved from the growth substrate and precipitated onto a glass coverslip for optical measurement, they can orient randomly either with the two semipolar facets facing upward (away from the glass coverslip) or with one semipolar and one polar facet facing upward. These two situations correspond to RU and RA image patterns, respectively. The predominance of RU and RA patterns confirms that the emission, and presumably the absorption, of visible (sub-bandgap) light is associated with surfaces, not bulk defects. Furthermore, these measurements demonstrate that polar and semipolar crystallographic terminations yield distinct emission spectra, which can be resolved on the same NW. To our knowledge, this has not been demonstrated previously using optical spectroscopy.
Interestingly, typical SCOM values for an RU pattern are similar to the LE side of an RA pattern [e.g., compare Fig. 4(a) and LE of Fig. 4(b)]. This is consistent with the conclusion that the two distinct patterns correspond to two different orientations of equivalent NWs on the glass coverslip and also suggests that the measurement system is relatively insensitive to emission emanating from the basal facet of the NW. This can be understood by considering that the NW has a larger refractive index (∼2.5) compared to the glass coverslip (∼1.5), so there is an index mismatch at the interface between the NW and the coverslip. It has been shown that emission from such a dielectric interface is predominantly directed toward the higher index material, Reference Novotny and Hecht34–Reference Pennanen and Toppari36 which in our geometry leads to a reduced collection efficiency for emissions emanating from the basal facet since those photons tend to propagate away from the collection lens [see Fig. 1(b)].
The large index of refraction of GaN also leads to interference fringes in the broad emission spectrum collected at the end facets [see Figs. 2(f) and 1(d)] as trapped photons exit the NW after multiple round trips. Reference Schwartzberg, Aloni, Kuykendall, Schuck and Urban8 Emission from the end facets of the NW can couple directly into such longitudinal etalon modes, while photons emitted from the longitudinal facets will be concentrated around the critical angle for total internal reflection, Reference Novotny and Hecht34 and a fraction of these will propagate along the NW axis. When fringes are observed in the emission spectrum, their period is consistent with the free-spectral range of an etalon of appropriate length (see Supplemental Material). Some NWs exhibit weak interference fringes or none at all, illustrating the importance of well-cleaved end facets to create the required reflective surfaces for etalon action.
When etalon fringes are observed, emission from the end facets also tends to be blue-shifted compared to the emission collected from other parts of the NW [see Fig. 2(f)]. Reference Bao, Melli, Caselli, Riboli, Wiersma, Staffaroni, Choo, Ogletree, Aloni, Bokor, Cabrini, Intonti, Salmeron, Yablonovitch, Schuck and Weber-Bargioni30 Photons that contribute to etalon fringes have traveled multiple passes along the NW length and thus have not been absorbed at the NW surface. These photons travel along the NW longitudinal axis and can leak from the end facets, where they might be collected by the high numerical aperture objective lens (NA = 1.4). On the other hand, when photons are absorbed at the surface, the resulting emission will be redshifted due to fast nonradiative relaxation, (see below) and only photons emitted nearly parallel to the NW axis can couple to etalon modes. Thus, we expect that the light collected from the end facets will have a relative deficit of red-shifted emission and will propagate nearly parallel to the glass interface (at large angles relative to the optic axis). To confirm this, we used a diaphragm aperture to block high-angle emission in the collection path and observed a reduction in the blue-shift at the end facets. Another contributing factor to the blue end facets is the general observation of a blue-shift with increasing excitation intensity for all regions of the NW (e.g., see Fig. 6). The collected emission signal is usually highest at the end facets, which suggests that more excitation light is coupled into the NW at the end facts, leading to higher excitation intensity there.
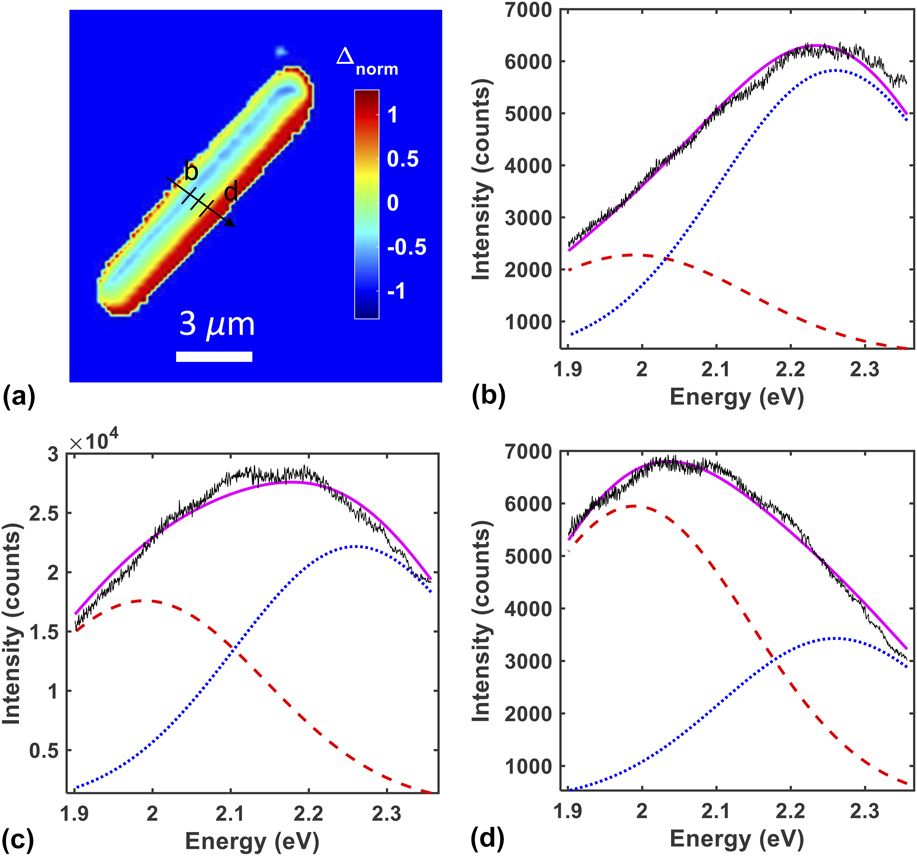
Previous work on GaN thin films has revealed a broad visible emission within several distinct bands, which has been attributed to bulk point defects of various origins. Reference Reshchikov, Demchenko, Usikov, Helava, Makarov, Chyi, Fujioka and Morkoc37 While our results strongly point to surface-associated states as being the dominant cause of visible absorption and emission in GaN NWs, the spectral characteristics are similar to those found in thin films. To demonstrate this, we converted the emission spectra from wavelength to energy units and fit the results to a superposition of two Gaussian functions. Reference Reshchikov, Morkoç, Park and Lee38 The amplitude of each Gaussian was left as a fit parameter while the Gaussian centers and widths were held fixed based on values extracted from the GaN thin-film literature and overall response of the NWs (see Supplementary Material). In particular, excellent fits were generally obtained with Gaussian centers of 1.99 ± 0.01 and 2.26 ± 0.01 eV for the “red” and “blue” surfaces of the NW, respectively, each with a FWHM of 0.365 eV—i.e., the spectral properties agree well with those in the literature.
Figure 5 shows the same NW from Fig. 3 analyzed with this 2-Gaussian fit approach. The spectrum obtained at each pixel was fit to a superposition of two Gaussian functions, one with amplitude A red (centered at 1.99, 0.365 eV FWHM) and one with amplitude A blue (centered at 2.26, 0.365 eV FWHM). To visualize the results of these fits, we then computed the normalized difference between the two Gaussian amplitudes:
 $${\Delta _{{\rm{norm}}}} = {{{A_{{\rm{red}}}}-{A_{{\rm{blue}}}}} \over {{A_{{\rm{red}}}} + {A_{{\rm{blue}}}}}}\quad ,$$
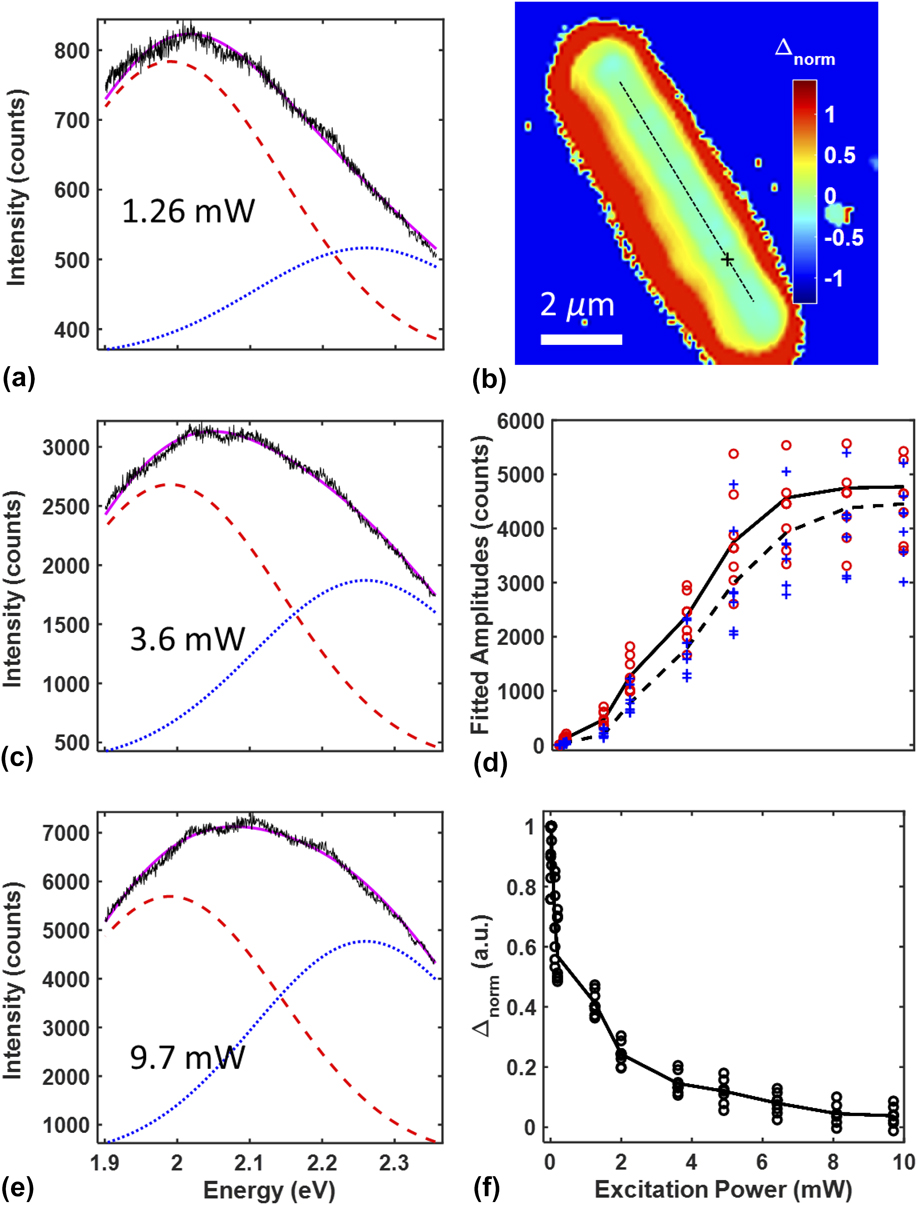
and plotted this value pixel by pixel [Fig. 5(a)]. When the spectrum is dominated by red spectral components, Δnorm > 0 [Fig. 5(d)], while negative values result from relatively blue emission [Fig. 5(b)]. When red and blue components are present in roughly equal measures, Δnorm ≅ 0 [Fig. 5(c)]. As the diffraction-limited focus of the excitation beam scans over the NW, it illuminates the upper facets, which dominate the collected signal, in addition to the basal facet, which contributes relatively little. Thus, an RA image pattern will produce negative values of Δnorm on one side of the NW longitudinal axis and positive values on the other side. For NWs that exhibit RU patterns, Δnorm is fairly consistent across the entire NW with values ≥0 (e.g., see Fig. 6 below and Supplementary Material).
Gaussian amplitude map of the NW shown in Fig. 3. (a) Normalized difference image indicating the value of Δnorm as defined by Eq. (2). (b, c, d). Spectra (black line) from different spatial locations were fit to the superposition of two Gaussian functions (purple fit line) centered at 2.26 eV (blue dotted line) and 1.99 eV (red dashed line). The spectra in panels b–d were extracted from the positions indicated by the line profile and corresponding cross hatches in panel a.

Power dependence of the emission spectrum from the RU NW shown in Fig. 2. (a, c, e) Spectra (black line) obtained from the location indicated by the cross in panel b at 1.26 mW, 3.6 mW, and 9.7 mW excitation powers, respectively. Spectra were fit to a superposition of two Gaussians (purple line) centered at 2.26 eV (blue dotted line) and 1.99 eV (red dashed line). (b) Map of Δnorm for an excitation power of 9.7 mW. (d) Fitted amplitudes of the red (open circles) and blue (crosses) Gaussian functions for multiple points along the ridge of the NW (indicated by the dotted line in panel b) at various excitation powers. The average of these points is shown by the dotted black line and solid black line, respectively. (f) Calculated Δnorm for the points in panel d at various excitation powers. Black line indicates the average of these points.

We hypothesize that the two Gaussian functions used in the superposition represent distinct bands of surface-associated states. It is clear that the red band is strongly associated with the two semipolar
 $\left( {1\bar 101} \right)$
/
 $\left( {\bar 1101} \right)$
facets, and the blue band is strongly associated with the polar (0001) facet. However, since the size of the laser focus is similar to the diameter of the NWs, it is not possible to illuminate (or collect emission from) a single facet, and the spectra collected thus originate from at least two surfaces simultaneously. Furthermore, PL from one surface can readily excite PL on another since the bands are quite broad, and the surfaces are in close proximity. Thus, it is not clear whether both bands coexist on each facet in different ratios or whether each facet is either purely a red band or purely a blue band.
Despite these uncertainties, it is clear that both the red and blue PL must originate on the NW surfaces. Interestingly, the energies of these bands roughly correspond to the often-cited yellow luminescence (YL) and less well known red luminescence (RL) bands. Various bulk defect states in GaN have been thought to be responsible for the YL band such as gallium vacancy complexes,
Reference Reshchikov, Morkoç, Park and Lee24,Reference Reshchikov, Morkoç, Park and Lee38,Reference Lyons, Alkauskas, Janotti and Van de Walle39
a CN–ON complex with PL at 2.25 eV,
Reference Demchenko, Diallo and Reshchikov40
a charged complex of CN at 2.21 eV,
Reference Reshchikov, Demchenko, Usikov, Helava, Makarov, Chyi, Fujioka and Morkoc37,Reference Lyons, Janotti and Van de Walle41
or even VGa–3H or VGa–ON–2H complexes producing PL at 2.05 eV and 1.9 eV, respectively.
Reference Lyons, Alkauskas, Janotti and Van de Walle39
Nevertheless, the YL band at 2.22 eV has been reported in GaN thin films
Reference Singh, Molnar, Ünlü and Moustakas19,Reference Ponce, Bour, Götz and Wright20
and NWs
Reference Li and Wang21–Reference Wang, Talin, Werder, Creighton, Lai, Anderson and Arslan23
and has been suggested to be associated with bulk atoms in the first 1 μm from the surface.
Reference Reshchikov, Morkoç, Park and Lee24
The origin of the RL band (1.5–2.0 eV) is less studied and may be due to the contribution of several different defects.
Reference Reshchikov and Morkoc1
A study by Xu et al. suggested that the polar (0001) c-plane of GaN (specifically the Ga-face) would have a higher carbon concentration while the semipolar
 $\left( {1\bar 101} \right)$
plane would have a lower carbon concentration,
Reference Xu, Hao, Zhang, Jiang, Yang, Lu and Lin28
correlating to the fact that YL is believed to be the result of CN–ON defects
Reference Demchenko, Diallo and Reshchikov40
or CN defects.
Reference Lyons, Janotti and Van de Walle41
This would cause the YL band to be more prevalent on the (0001) planes (2.26 eV band in our observations) and less so on the
 $\left( {1\bar 101} \right)$
/
 $\left( {\bar 1101} \right)$
planes (1.99 eV band in our observations). It should be noted that the chemical dependence of the YL band is believed to be associated with O, C, and/or H atoms from experimental evidence using ion implantation.
Reference Kucheyev, Toth, Phillips, Williams, Jagadish and Li42,Reference Dhara, Datta, Wu, Lan, Chen, Wang, Chen, Hsu, Chen, Lin and Chen43
Thus, it is also possible that certain surfaces have affinities to (i) atom-dependent point defects, (ii) loosely bound adatoms on the surface, or (iii) different concentrations of point defects/adatoms.
To further explore the origin of the red and blue PL bands, we collected hyperspectral images as a function of excitation power. The emission shifts to the blue with increasing the excitation power, in agreement with previous observations for GaN films.
Reference Singh, Molnar, Ünlü and Moustakas19,Reference Reshchikov, Morkoç, Park and Lee24,Reference Reshchikov, Morkoç, Park and Lee38
The NW in Fig. 6, which is the same one shown in Fig. 2 (RU pattern), has a “blue” basal facet and two “red” upper facets, leading to a relatively constant value of Δnorm for a particular laser power [e.g., Fig. 6(b)]. While both the red (1.99 eV) and blue (2.26 eV) gaussian-fitted bands become stronger with increasing the excitation power [Fig. 6(d)], the balance shifts toward the blue band yielding values of Δnorm that approach zero at higher powers [Fig. 6(f)]. If the blue and red bands are localized to the polar (0001) and semipolar
 $\left( {1\bar 101} \right)$
/
 $\left( {\bar 1101} \right)$
surfaces respectively, then the blue shift represents a shift in balance between the blue-band PL collected from the basal facet relative to the red-band PL collected from upper facets. If the blue and red bands are not localized to the polar and semipolar surfaces, but rather occur in different proportions on both, then the blue shift represents a shift in balance between the two bands on each facet. To fully differentiate between these two possibilities, future work will include power-dependent measurements on NWs that exhibit RA patterns (e.g., Fig. 3) and will additionally include the capability to excite and collect PL from separated spatial points to investigate secondary excitation of polar and semipolar facets. Band bending and the interaction between specific defects might also play a role in the observed blue shift.
Reference Reshchikov, Demchenko, Usikov, Helava, Makarov, Chyi, Fujioka and Morkoc37,Reference Reshchikov, Visconti and Morkoc44
Regardless of whether or not the blue and red bands are localized to different facets, the breadth of the PL spectrum suggests that each band consists of a broad manifold of surface-associated states strongly coupled to each other. The intraband coupling leads to a fast nonradiative relaxation of photo-excited charge carriers through the manifold of mid-gap states, which competes with radiative recombination to the valence band.
Time-dependent spectral data (not shown) confirms that nonradiative relaxation is much faster than radiative recombination for this system. At low excitation power, photo-excited electrons percolate down toward the bottom of the manifold of mid-gap states, while recombination leads to emission from the lower states in the manifold yielding a relatively red emission. At high excitation power, electrons are pumped into the mid-gap states more quickly, which can saturate the lower-lying levels in the manifold. Reference Singh, Molnar, Ünlü and Moustakas19,Reference Reshchikov, Morkoç, Park and Lee38 This hinders new photo-excited electrons from relaxing to the lower-lying energy levels before radiative recombination occurs. A similar process should also occur with the residual holes left behind in the valence band after photo-excitation, and these holes will saturate the higher-lying energy levels in the valence band. Since these NWs are n-type, the holes are susceptible to band bending and will be pinned near the surface, further enhancing this effect. These processes should lead to a blue-shift in the emission spectrum at a higher laser power, as observed.
In the context of distinct red and blue bands proposed here, the above explanation also depends on how the two bands couple with each other. This will certainly depend on the nature of the surface-associated states and whether the two bands coexist on each facet or whether they live on different facets. However, given that the two bands seem to have a significant energy overlap, it is reasonable to assume they will couple. Given that the different crystallographic terminations on the NWs yield different emission spectra (see above), we conclude that the polar (0001) and semipolar
 $\left( {1\bar 101} \right)$
/
 $\left( {\bar 1101} \right)$
surfaces have distinct mid-gap manifolds with different energy landscapes, possibly as a result of pure surface states or surface affinities to certain point/adatom defects. While our model captures the important qualitative features of the spectral data for both polar and semipolar surfaces, to understand quantitative details such as the precise density of states and interstate kinetics requires additional measurements and modeling beyond the scope of this work.
VI. CONCLUSIONS
The triangular cross-section GaN NWs reported here provide a unique opportunity to study the PL from two distinct surfaces simultaneously under the same observation conditions and growth methods, which is virtually impossible with bulk GaN samples. In particular, we have shown that the different surfaces of individual GaN NWs grown via MOCVD have characteristic spectral properties. The broad PL resulting from excitation at 488 nm suggests distinct PL bands associated with the
 $\left( {\bar 1101} \right)$
/
 $\left( {1\bar 101} \right)$
surfaces and the (0001) c-plane surfaces of the NWs. These bands are well represented by a superposition of Gaussian functions with centers at 1.99 ± 0.01 and 2.26 ± 0.01 eV. Thus, we conclude that the visible emission from GaN NWs is associated with mid-gap states on the surface, which can be efficiently populated with charge carriers via direct excitation with visible light.
The spectral fringes, blue shifting (relative to the rest of the NW), and directional dependence of the spectral components at the NW end facets show that the NWs function as optical cavities along their longitudinal axis leading to light trapping of both the laser excitation and emitted PL. This might improve the absorption efficiency in solar harvesting applications as trapped solar photons would traverse the NW multiple times thereby increasing the probability of exciting charge carriers at the surface. Future work will characterize the distribution of excitation light within the NW as a function of where and at what angle photons are injected into the NWs. In addition, repeated cycles of PL emission into longitudinal or possibly whispering gallery modes Reference Zhang, Zhang, Xu, Shan, Xu and Yu45 followed by reabsorption at the NW surfaces increases the probability that surface-associated charge carriers can be harvested for optoelectronic processes. Reference Philipps, Müntze, Hille, Wallys, Schörmann, Teubert, Hofmann and Eickhoff2,Reference Kibria, Zhao, Chowdhury, Wang, Nguyen, Trudeau, Guo and Mi46 Additional future work will also utilize time-dependent PL measurements and off-axis collection of PL Reference Tian, Zhao, Leng, Cui and Jin47 (i.e., separated excitation and collection volumes) to determine the lifetime and mobility of photo-excited charge carriers on the NW surfaces and differentiate carrier mobility from the repeated emission and absorption of PL. Additional insight into these NWs will be obtained through PLE measurements, optical modeling of the complex dielectric system, and near-field measurements. Reference Bao, Melli, Caselli, Riboli, Wiersma, Staffaroni, Choo, Ogletree, Aloni, Bokor, Cabrini, Intonti, Salmeron, Yablonovitch, Schuck and Weber-Bargioni30,Reference Shafran, Mangum and Gerton48 The results of this work have implications regarding the use of GaN NWs in light management and light-harvesting applications, such as nano lighting, photovoltaics, and photocatalysis.
Supplementary Material
To view supplementary material for this article, please visit https://doi.org/10.1557/jmr.2017.361.
ACKNOWLEDGMENTS
We would like to thank Anil Ghimire and Yuchen Yang for facilitating data collection and Michael Reshchikov and Michael Scarpulla for insightful discussion. We would also like to thank Michael Palmer for assistance. This work was supported by a Scialog grant awarded to JMG by the Research Corporation for Science Advancement. Work at the Molecular Foundry was supported by the Office of Science, Office of Basic Energy Sciences, of the U.S. Department of Energy under Contract No. DE-AC02-05CH11231.