At a December 2013 press conference, House Speaker John Boehner delivered a vehement public rebuttal to fellow Republicans who had repeatedly charged that his record as party leader demonstrated a lack of proper loyalty to conservative doctrine. “I’m as conservative as anybody around this place,” Boehner declared, “and all the things that we’ve done over the three years that I’ve been speaker have not violated any conservative principle.” Footnote 1 Boehner’s frustration at facing regular accusations of ideological betrayal reflected the internal tensions that have roiled the Republican Party since the emergence of the Tea Party movement in 2009. Tea Party activists have not only mobilized in opposition to Barack Obama and his Democratic supporters in Congress, but have also taken political aim at a Republican “establishment” that they view as insufficiently devoted to party principles. Veteran Republican politicians like Boehner now routinely feel compelled to defend their ideological bona fides, lest they become vulnerable to primary election challengers who attack them for abandoning the conservative cause.
Although elites in both major American parties have become more ideologically polarized over the past generation, only the Republican Party contains a well-publicized, generously-funded, and electorally potent ideological faction capable of determining candidate nominations, directing the legislative behavior of incumbent officeholders, and visibly exasperating the party’s highest-ranking national elected official before a group of assembled reporters. The unique contemporary influence of conservative activists exemplifies a larger and more enduring asymmetry between the parties. Democrats and Republicans are motivated by dissimilar political goals and think about partisanship and party conflict in fundamentally different ways, which in turn stimulates distinct approaches to governing by leaders on each side.
The Republican Party is best viewed as the agent of an ideological movement whose members are united by a common devotion to the principle of limited government. Conservatives maintain an innate skepticism about—or opposition to—the use of government action to address social problems and tend to evaluate candidates and policies on the basis of ideological congeniality. As a result, Republicans face an enduring internal tension between adherence to doctrine and the inevitable concessions or failures inherent in governing—a conflict that is exacerbated by the presence of an influential cadre of movement leaders devoted to publicly policing ideological orthodoxy.
In contrast, the Democratic Party is properly understood as a coalition of social groups whose interests are served by various forms of government activity. Most Democrats are committed less to the abstract cause of liberalism than to specific policies designed to benefit particular groups. Democratic-aligned constituencies make concrete programmatic demands on their representatives and, if the alternative is inaction, are often willing to compromise in order to win partial achievement of their objectives. Unlike the Republican Party, Democrats lack a powerful internal movement designed to impose ideological discipline on elected officials, which gives Democratic officeholders more freedom to maneuver pragmatically but also denies the party a common philosophy to direct its actions and a common cause around which to mobilize its supporters.
We draw upon empirical evidence from a variety of sources to demonstrate the presence of this long-standing, fundamental asymmetry between the major parties in the United States. We begin by placing our argument in the context of current theories of American parties. Next, we examine party affiliation among the mass public, finding that citizens are disproportionately attracted to the Republican Party due to shared ideological affinity and to the Democrats on the basis of social-group identity and specific policy positions. This distinction endures as we move from party identifiers through the activist and donor classes to elected officials. We then consider the implications of this difference for the contemporary governing style of the two parties in Congress and the nature of the American party system.
Party Asymmetry and Party Theory
Most theories of American political parties are designed to apply equally to Democrats and Republicans without recognition of party asymmetry. For example, John Aldrich’s Why Parties? identifies candidates and elected officials as the “central” and “most important” partisan actors, arguing that parties have existed to serve the instrumental goals of ambitious office seekers since the early days of the republic. According to Aldrich, politicians create and maintain parties to regulate ballot access, solve collective-action problems involved in mobilizing voters, and form stable coalitions to avoid cycling in legislatures. Footnote 2 Parties are steered by leaders who pursue policy victories in order to create a “brand name” for use by politicians in elections, while party activists, donors, and public supporters play less influential roles. Footnote 3
Several recent studies of American parties challenge the politician-centered account of party operation by arguing that each party is effectively controlled by an “extended party network” comprised of activists and interest groups as well as elected officials. Footnote 4 These networks are evident in campaign finance, electoral endorsements, and (to a lesser extent) legislative coalitions. Footnote 5 The sizable influence of non-officeholders in party affairs better explains the increasing ideological polarization of the parties over the past forty years than theories premised only on the incentives of election-minded politicians. Footnote 6
In this vein, Kathleen Bawn, Martin Cohen, David Karol, Seth Masket, Hans Noel, and John Zaller have advanced a new theory of political parties as representing coalitions of interest groups who are engaged in politics not merely to seek power for its own sake but also to advance particular government policies. Footnote 7 For these authors, “ideology reflects a coalitional bargain among diverse policy demanders” rather than a shared set of values among citizens or politicians. Footnote 8 Because many voters are relatively uninformed about the parties’ agendas and positions, leaders are able to satisfy the interests of specific attentive constituencies while simultaneously maintaining support within the more moderate, or ideologically indifferent, mass electorate.
Activist-centered theories can account for the acquiescence of candidates and officeholders to the policy preferences of informal networks, but they share with politician-centered theories the implication that the two major parties exhibit comparable internal configurations, approaches to courting voters, and strategies of governing. Recognition of party asymmetry is largely absent from textbook accounts of American parties, prominent theories of Congress and elections, and even comparative theories of party systems. Footnote 9 As Jacob Hacker and Paul Pierson recently noted, Anthony Downs’ model of electoral politics as constituting two equivalent office-seeking parties symmetrically competing for votes on an ideological spectrum has served for decades as a “master theory” of political science. Footnote 10 Yet Downsian theory is unable to explain such empirical phenomena as the unbalanced pattern of partisan polarization in Congress. Since the 1970s, congressional Republicans have collectively moved much further in the conservative direction than congressional Democrats have moved toward the liberal pole; the relatively modest liberalization of the Democratic Party is almost entirely due to the electoral decline of its ideologically atypical southern wing. Footnote 11
Several scholars have acknowledged the asymmetry of the parties by focusing on the central role of ideology in determining the behavior of the contemporary Republican Party, which they view as unique not only in degree but also in kind. Hacker and Pierson argue that Republican leaders are adept at framing public debate and exploiting institutional power in order to enact an ideologically extreme policy agenda over the dissenting preferences of most American voters. Footnote 12 Thomas E. Mann and Norman J. Ornstein have held Republican obstructionism responsible for creating a dysfunctional legislative branch, claiming in a pair of memorable titles that, when it comes to twenty-first-century Washington politics, “It’s Even Worse Than It Looks” and “Let’s Just Say It: The Republicans Are the Problem.” Footnote 13 Even some conservative commentators have been openly dismayed in recent years by such controversial acts as the Republican-initiated government shutdown of October 2013, while liberal critics such as Paul Krugman of the New York Times regularly cite such legislative crises as evidence of pathological Republican misgovernance.
These and similar accounts often compare today’s Republican Party not only with the contemporary Democrats, but also with a supposedly less ideological GOP of the past. According to some analysts, a powerful and uncompromising conservative movement effectively captured the party in 2009, when Obama’s ascendancy precipitated the rise of the Tea Party. Others date this change to 2001 (when George W. Bush became president), 1994 (the Republican Revolution in Congress and subsequent speakership of Newt Gingrich), or even 1980 (the year of Ronald Reagan’s election to the presidency). Regardless of the specific timing, these observers agree that the GOP recently transformed into a fundamentally different kind of party; before that moment, it is assumed, the Republican Party was more or less a mirror image of the Democratic Party.
We perceive a more enduring difference. To be sure, the power of ideologically-motivated activists dedicated to enforcing conservative purity has markedly increased within Republican ranks since the 1970s, and as a result the party has collectively shifted substantially to the right over time. But Republicans have been more ideologically oriented than Democrats for at least the better part of a century, just as Democrats have for generations been more likely than Republicans to view partisan politics through the alternative lens of social identity and group conflict. Footnote 14
This foundational party asymmetry was often recognized by previous generations of scholars. David Nexon declared in his 1971 study of party activists that the two parties “are different not only in name, program, and coalitional components but also in type.” Footnote 15 Explaining the distinctiveness of the American political system, Nelson W. Polsby observed that “Democrats are primarily a mosaic of interests making claims on government; Republicans are bound together much more by ideological agreement.” Footnote 16 In his 1966 analysis of congressional voting patterns, David R. Mayhew noted that the Democratic legislative agenda “was arrived at by adding together the programs of different elements of the party” and was enacted via institutionally-facilitated log-rolling among members representing diverse constituencies. Footnote 17 Congressional Republicans, in contrast, perceived their role as standing for the principles of “free enterprise and economy in government.” Footnote 18
Party asymmetry was more fully articulated by Jo Freeman in her 1986 comparison of Democratic and Republican convention delegates, organizations, and rules. Footnote 19 Freeman argued that each side exhibited a unique “party culture” encompassing its attitudes, organization, and style. The Democratic Party, she observed, was structured as an alliance of component constituencies, with official caucuses representing sub-groups that served as “primary reference groups” for their membership and that often defined the fault lines of intra-party debate. The Republican Party, in contrast, was bound together by a common conservative identity, with internal conflicts representing disagreement over whether or not particular party members were “real” Republicans. Footnote 20 Her conclusion remains apt nearly 30 years after it was written: “The Republican party is not a poor imitation of a normal coalition-building party, but a different type of political organization that does things in different ways.” Footnote 21
Studies in American political development also substantiate the historical asymmetry of the parties. As Daniel Galvin argues, Democrats and Republicans followed unique organizational trajectories, developed distinctive internal norms, and aligned with dissimilar partner networks; these differences were self-reinforcing, causing party leaders to maintain distinct practices over time. Footnote 22 For Hacker and Pierson, who propose a developmental alternative to Downsian political science, a key aim is to “remind us that [the two parties] are not mirror images of each other. Rather than being equivalent loose collections of politicians and voters, they are distinct social coalitions that have quite different internal structures. Different coalitional bases may dictate different trade-offs.” Footnote 23
Over the past several years, scholars have devoted increasing attention to the rise of the ideologically purist Tea Party. While journalists often portray the movement’s rise as a novel development in American politics, academic research suggests deeper historical roots. After interviewing Tea Party activists, Theda Skocpol and Vanessa Williamson observed:
To say that Tea Partiers are part of a long-standing conservative tradition is to agree with many of our interviewees, who celebrate previous generations of conservatives as their political forebears … An extraordinary number dated their first political experiences to the 1964 Goldwater campaign … the Tea Party is fundamentally the latest iteration of long-standing, hard-core conservatism in American politics. Footnote 24
Christopher Parker and Matt Barreto also note this pedigree, arguing that the Tea Party “is simply the latest in a series of national right-wing social movements that have cropped up in America since the nineteenth century.” Footnote 25 Although the two sets of scholars disagree about whether Tea Party members are primarily motivated by small-government doctrine or by anxiety over social and ethnic change, both studies identify key historical antecedents for contemporary conservative populism, raising the question of why the Democratic Party lacks a comparable tradition of mass electoral mobilization around a broad left-wing belief system.
The Specifically Liberal—and Generally Conservative—American Public
Party asymmetry is reinforced by the collective proclivity of the American electorate to endorse liberal positions on most individual political issues while simultaneously holding conservative views on the overall size and role of the state—a durable tendency first noted by Lloyd Free and Hadley Cantril nearly fifty years ago. Footnote 26 Republican politicians appeal to voters both within and outside their loyal electoral base by emphasizing general themes of limited government, while Democratic candidates present themselves as proponents of specific policies and programs that advance the interests of an element of their party’s electoral coalition and provide tangible benefits to the wider citizenry. Because most of the public agrees with each side on its own terms, both parties can claim to represent the views of an electoral majority.
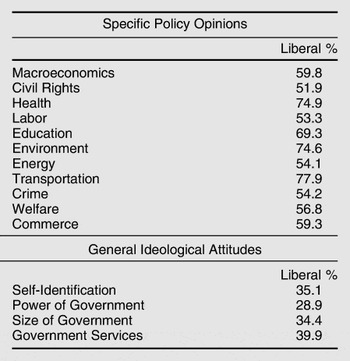
Table 1 provides an overview of the liberal or conservative direction of public opinion in both individual issue areas and broader ideological attitudes. It displays the average percent of liberal responses on public opinion questions (out of all non-centrist responses) asked by pollsters each year since 1981; figures below 50 percent represent a conservative majority and above 50 percent correspond to a liberal majority. Liberal positions are more popular than conservative positions, and sometimes substantially so, on nearly all domestic policy issues, even those—such as crime or welfare—sometimes thought to be “owned” by the Republican Party. Yet conservative responses predominate on items measuring ideological self-identification or attitudes regarding the general size and power of government. Depending on the scope of the questions asked, this summary of American public opinion reveals both a center-right and a center-left nation.
Average percent of liberal responses to survey questions on policy and ideology

Note: The table reports the percent of liberal responses (out of total liberal and conservative responses, not including moderate or unplaced responses) to survey questions regarding policy opinions and general ideological attitudes. We report the average of all years since 1981. James Stimson compiled the dataset and made it available via the Policy Agendas Project. Issue areas are categorized at policyagendas.org. Power of government includes the variables FEDSTATE and GOVPOW. Size of government includes MTOOBIG and THREATFX. Government services includes HEPLNOT, WATEALOT, NTYBIGGV, and SERVSPND.
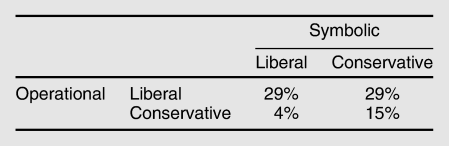
Table 2 demonstrates how these seemingly contradictory opinions within the mass public reflect a gap between symbolic and operational ideology, using measures created by Christopher Ellis and James Stimson from data collected by the General Social Survey. Footnote 27 Ellis and Stimson define operational liberals (or conservatives) as those respondents who give mostly liberal (or conservative) responses to specific policy questions, while symbolic liberals and conservatives are those who explicitly self-identify as such. Though they substantially outnumber operational conservatives in the electorate, operational liberals are no more likely to identify as symbolic liberals than as symbolic conservatives. Ellis and Stimson argue that many citizens simply misunderstand ideological terminology, but their findings are also consistent with the hypothesis that Americans simply prefer conservatism to liberalism in the abstract. Republican elites are therefore on firmer political ground, even among their own party’s supporters, when they emphasize general ideological views over specific issue positions.
Operational and symbolic preferences in the American electorate

Note: The table reports the percentage of Americans who report liberal or conservative self-identification (symbolic) and liberal or conservative opinions on policy issues (operational). Those who self-identify as moderates or do not answer the policy questions are not included in the table. The data originate with the General Social Survey from 1973–2006 and were compiled by Ellis and Stimson for Ideology in America.
Ideology vs. Group Identity: How Democrats and Republicans View the Parties
Democrats and Republicans explain their political orientations in very different ways. For more than six decades, the American National Election Studies (ANES) have asked a sample of Americans what they like and dislike about each major party and presidential candidate in every presidential election, recording their open-ended responses. Political scientists have used these items to assess citizens’ “levels of conceptualization”; Philip Converse argued in 1964 that these categories “provide some indication of the evaluative dimensions that tend to be spontaneously applied.” To Converse, “ideologues” rely “in some active way on a relatively abstract and far-reaching conceptual dimension” while “group benefits” voters evaluate parties “in terms of their expected favorable or unfavorable treatment of different social groupings.” Footnote 28 The other categories—“nature of the times” for those who hold one of the parties or candidates responsible for the overall direction of the nation and “no issue content” for those who mention personality traits or other non-substantive considerations—identify citizens whose preferences are not based on the ideological alignments or social group coalitions of the parties. Footnote 29
Although scholars have traditionally viewed these classifications as a hierarchical scale of political sophistication with ideologues at the top, we treat the “ideological” and “group benefits” categories as types rather than levels of conceptualization. Republican partisans tend to view political conflict as fundamentally ideological in nature, while Democrats perceive it as a clash of competing group interests. For example, the following verbatim responses from Republican activists interviewed in 2012 would prompt their classification as “ideological” voters:
-
Democrats “want the government to run everything and they think the government can fix everything.” Republicans “want people to be personally responsible for their own lives.”
-
The Democratic Party “promotes big government, secularism, elitism, and collectivism.” The Republican Party “pushes for cutting the size of the federal government.”
-
Democrats are “quite socialistic, [giving] way too much power to the government.” Republicans are for “fiscal responsibility and conservatism … less government, more power to the states, encouraging jobs … with less dependency on the federal government.”
In contrast, these Democratic activists would qualify as “group benefits” voters:
-
Democrats “support the poor and middle class.” Republicans “look out for the rich and don’t care about the poor and middle class.”
-
Democrats have “concern for the working class … [and have] always worked to help women.” Republicans’ “concern is for people who have money.”
-
Democrats are “the party of the common man;” Republicans are “for rich, mainly white older folks who tend to be quite judgmental, narrow minded and unconcerned for their fellow Americans.”
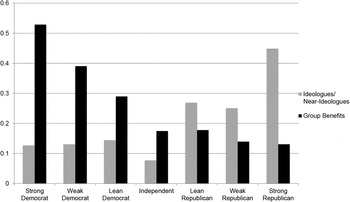
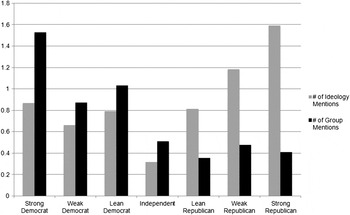
In 2000, the most recent available data coded for level of conceptualization, the proportion of respondents categorized as ideologues was strikingly higher among Republicans—especially those who strongly identified with the party—than among Democrats or independents, as revealed by figure 1. Respondents were classified as ideologues if they cited any ideological label or reference to a general principle in four open-ended responses, yet even this generous definition failed to capture the vast majority of Democrats. Footnote 30 The percentage of respondents categorized as group-oriented voters was even more strongly associated in a linear fashion with the 7-point party identification scale. More than half of strong Democrats expressed their views of the parties and candidates in terms of group benefits, but only about 12 percent of strong Republicans did so.
Proportion in the top levels of conceptualization by party identification
Note: The figure reports the proportion of respondents in each party identification category who were categorized as ideologues or near ideologues and as group benefits voters on the levels of conceptualization scale. The scale is based on open-ended responses regarding likes and dislikes of the two political parties and presidential candidates on the 2000 ANES survey. The coding was carried out by William G. Jacoby and Robert Moore and reported in Lewis-Beck et al. Reference Lewis-Beck, Jacoby, Norpoth and Weisberg2008. These results were provided by William G. Jacoby.

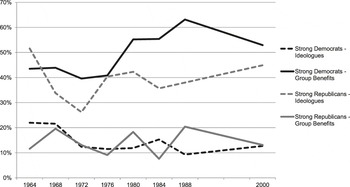
This difference extends beyond the particular context of the 2000 election. Figure 2 displays the relative ideological and group-based orientation of strong Democrats and strong Republicans over the 1964–2000 period. In every year for which data are available, strong Democratic respondents were much more likely to cite group benefits than ideological considerations, with ratios ranging from 2-to-1 (in 1964) to more than 6-to-1 (in 1988), even as ideologues consistently outnumbered group-oriented voters by substantial margins among strong Republicans. While the political conceptualization of some partisans—and many more independents—fell within neither category, the relative Republican preference for ideological conceptualization and relative Democratic preference for the language of group interests remained constant across forty years of electoral history. Footnote 31
Percent of strong party identifiers in top levels of conceptualization
Note: The figure reports the percent of strong party identifiers that were categorized into ideologues and group benefits voters on the levels of conceptualization scale. The scale is based on open-ended responses regarding likes and dislikes of the two political parties and presidential candidates on the ANES survey. The coding up to 1988 was conducted by Paul Hagner, John Pierce, and Kathleen Knight, and is made available through the Inter-university Consortium for Political and Social Research. No levels of conceptualization codes were yet available for 1992, 1996, and 2004–2012.

Figure 3 confirms that this finding is not an artifact of coding procedures, displaying the mean number of mentions of both ideological concepts and social groups for each partisan category in the 2004 ANES. Once again, the Democratic propensity for viewing party conflict as defined by competing group interests contrasts sharply with the Republican tendency to characterize party differences in more abstract terms—a gap that holds after controlling for education, age, income, and other demographic factors. Footnote 32 One might expect that Democrats would frequently connect specific group identities to larger liberal themes, but Democratic respondents’ citations of the social composition of the parties were only infrequently accompanied by appeals to abstract egalitarian, humanistic, compassionate, or democratic ideals. Footnote 33 At the same time, while the ideological language employed by Republicans might plausibly consist of references to conservatives and liberals as social groups rather than a deeper engagement with political ideas, the terms “liberal” or “conservative” or their synonyms constituted only 35 percent of respondents’ ideological mentions.
Number of mentions of ideology and social groups by party identification
Notes: The figure reports the average number of mentions of groups and ideological statements in the open-ended responses regarding likes and dislikes of the two political parties by respondents in each party identification category on the 2004 ANES. The authors analyzed coding conducted by the ANES. The categories are described at <http://www.electionstudies.org/studypages/2004prepost/nes04app.pdf>.

Scholars often assume that ideologically sophisticated citizens are the most likely to vote on the basis of policy considerations, but the concentration of ideologically-minded voters in the Republican Party does not indicate that Republicans are more concerned with the substance of policy than are Democrats. Members of both parties mention policies in their responses to the open-ended questions, but differ in the reasoning behind their stated positions. Democrats tend to explain their views by citing the social groups that would be affected by particular policies, while Republicans link specific issues to more general beliefs about the proper role of government.
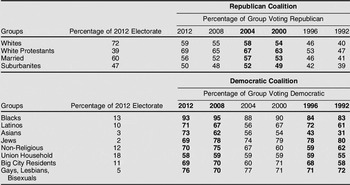
Since the New Deal era, the Democratic Party has served as the electoral vehicle by which discrete social minorities exert political pressure to protect or advance their particular interests (often, the amelioration of perceived disadvantage). In contrast, Republican candidates have traditionally drawn support from populous voting blocs who tend to view themselves less as self-conscious groups than as constituting the default or mainstream American mass public of whom other groups make demands. Footnote 34 (This attitude was memorably expressed by 2012 Republican presidential nominee Mitt Romney, whose controversial description of Democratic supporters as the “47 percent of the people … who are dependent upon government, who believe that they are victims” was captured on video footage secretly recorded at a private fundraiser and leaked during the campaign.) Footnote 35 Although political issues and identities have evolved since the 1930s, there is considerable continuity in the general character of the two parties’ popular coalitions, as summarized in table 3. Republican presidential candidates tend to attract support from social majorities or pluralities such as white voters, Protestants, suburbanites, and (heterosexual) married voters, while the Democratic Party resembles a “rainbow coalition” of racial, religious, economic, and sexual minorities who compensate for their smaller relative numbers by voting for Democratic candidates in lopsided proportions.
Social group coalitions of the parties in the electorate

Note: The table reports the percent of each group voting for each party from national exit polls, 1992–2012. Bold indicates years in which the party won the electoral vote. Exit polls are archived at: http://www.ropercenter.uconn.edu/elections/common/exitpolls.html
The overwhelming margins by which many of these groups routinely support Democratic nominees contrast markedly with the comparatively modest rate at which their members express adherence to symbolic liberalism, thereby illustrating the central role of social identity in shaping the partisanship of Democratic identifiers. According to media exit polls, 95 percent of African-Americans supported Obama in the 2008 presidential election but only 28 percent of black voters identified as liberals. Similarly, just 25 percent of Latino voters in 2008 considered themselves to be liberal even as 67 percent voted for Obama. For many Democrats in the mass electorate, strong and durable party loyalty need not require ideological commitment to flourish in the presence of a highly salient social group membership.
Party Asymmetry among Activists and Donors
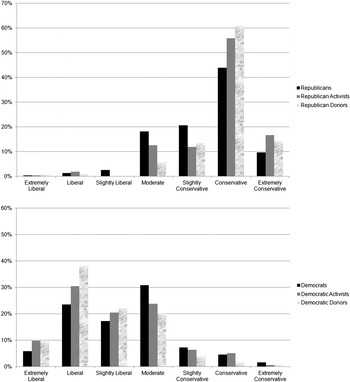
Among highly-engaged citizens as well as average voters, Republicans are united by symbolic conservatism while Democrats array themselves along a wider ideological spectrum. Figure 4 reports the distribution of ideology among all Democratic and Republican identifiers in the 2012 ANES (black lines), among the subset of each constituency that reported engaging in two or more activities in support of a candidate (gray lines), and among those who reported making political donations (marble lines). Among Republicans, 74 percent of voters, 84 percent of activists, and 89 percent of donors classified themselves as conservatives; almost none identified as liberal. Among Democrats, only 47 percent of voters, 61 percent of activists, and 70 percent of donors identified as liberal; 13 percent of Democratic voters and 12 percent of activists identified as a form of conservative. The proportion of self-identified liberals among Democrats still exceeds the proportion of party members who use ideological reasoning in explaining their views of the parties. Footnote 36
Ideology among partisans, activists, and donors
Note: The figure illustrates the percent of Democratic and Republican activists, non-activists, and donors who fit into each ideological category. Activists are those who reported participating in two or more campaign activities. The authors analyzed the information from the 2012 ANES.

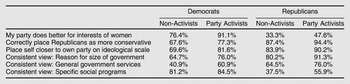
Table 4 draws upon several other questions available on the 2012 ANES to demonstrate the foundational asymmetry of Democrats and Republicans. Respondents were asked which party is best for the interests of women, with “neither party” also offered as a response option. Democrats, especially those who engage in campaign activities, overwhelmingly agreed that their party better served women’s interests, but Republicans were surprisingly reluctant to make similar assertions on behalf of the GOP. Fewer than half of Republican activists and only one-third of identifiers named the Republican Party as better for women, indicating an aversion to rhetoric that legitimizes group-specific interests even when it could simply serve as a symbolic act of partisan cheerleading.
Views of Democratic and Republican partisans and activists, 2012

Note: The table reports the percent of Democratic and Republican activists and non-activists who conform to their party’s expected view on six questions: whether their party best represents the interests of women, whether they correctly place the Republican Party as more conservative than the Democratic Party, whether they place themselves as closer to their own political party, their view of the reason for the size of government (“involved in things people should handle themselves” for Republicans and “because problems have become bigger” for Democrats), their general view of government services (“provide more services” for Democrats and “provide fewer services” for Republicans), and their specific views of spending on government social programs (should increase in more categories than decrease for Democrats and should decrease in more categories than increase for Republicans). Activists are those who reported participating in two or more campaign activities. The authors analyzed these data from the 2012 ANES.
The relative ideological orientation of Republican identifiers is also reflected in distinct partisan responses to ANES items asking interviewees to place themselves and both parties on a seven-point ideological spectrum. The vast majority of Republicans identified their own party as located to the right of the Democratic Party, while 13 percent of Democratic activists and one-third of other Democrats were unable to answer correctly. Footnote 37 Almost all Republican activists placed themselves closer to their own party than the opposition, but nearly 20 percent of Democratic activists and 30 percent of non-activists placed themselves closer to the Republican Party or equidistant between the parties.
Respondents were also asked two general questions about the size and scope of government: (1) whether government was large because it interferes with private decisions or because it addresses social problems, and (2) whether government should provide more or fewer services. Republicans, especially activists, chose the ideologically conservative response to both questions by wide margins. Democrats were less likely to give liberal answers, although the proportion rose substantially among activists. But Republican consistency on broad ideological predispositions did not extend to specific policy questions, reflecting the enduring gap between symbolic and operational conservatism. For 81 percent of non-activist Democrats, the number of issue areas on which they supported an increase in spending exceeded the number of areas on which they supported spending cuts, but only 38 percent of non-activist Republicans identified more items to cut than items for which they favored spending growth. Democrats exhibit much stronger support for particular forms of government activity than for activist government as such, while Republicans are more united around broad principles of limited government than around the need for reductions in specific programs.
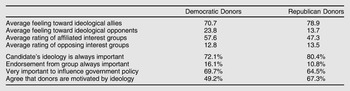
The difference between ideologically-motivated Republicans and group-identified Democrats extends to the donor class. Table 5 summarizes several political attitudes held by campaign donors (of at least $200 during the 1990s) in each party. As measured by feeling thermometers, Republican donors expressed very positive evaluations of conservatives and very negative evaluations of liberals; Democrats had the reverse view, of course, but did not hold it as strongly in either case. Democratic donors felt more positively than did Republican donors about the interest groups affiliated with their party, though both expressed negative evaluations of the groups associated with the opposition. In choosing which candidates to support with their contributions, Republican donors were more likely to say that (conservative) ideology is always important; they were also much more likely to agree that donors are motivated by ideological goals. Democratic donors were more likely to view an interest group’s endorsement as critical.
Feelings of Democratic and Republican donors in Congressional elections

Note: The top section of the table reports the average feeling thermometer ratings of Republican and Democratic donors toward their ideological allies and opponents (liberals and conservatives) and their average ratings across three interest groups on each side (Chamber of Commerce, National Rifle Association, Christian Coalition, Sierra Club, National Organization for Women, and AFL-CIO) on a scale of 0 (most negative) to 100 (most positive). The bottom section reports the share of Democratic and Republican donors who rated factors always or very important and the percent that agree that donors are motivated by ideology. The results are from a survey of donors that contributed $200 or more to congressional candidates in 1996. The survey was reported in The Financiers of Congressional Elections and analyzed by Peter Francia, who provided us with these data.
The difference in focus between the left and the right is also apparent among another population of elites: columnists in the nation’s major newspapers and opinion journals. Using data from a content analysis of liberal and conservative opinion columns, Footnote 38 table 6 reports the share of columns dedicated to general discussion of political ideology and specific domestic policy issues by writers on each ideological side (in the two most recent years of the dataset). Conservative columnists devoted more than three times as many columns to political ideology as left-leaning writers in 1970 and seven times as many in 1990. There was no consistent difference in the percent of columns dedicated to domestic policy issues, but liberal writers supported about three times as many specific policy proposals. Footnote 39
Ideology and policy positions in liberal and conservative opinion columns

Note: The table reports the number of policy positions favored by newspaper and journal opinion columnists and the percent of their columns that primarily cover domestic policy issues or the size and scope of government (ideology). The data originates from Hans Noel, Political Ideologies and Political Parties in America. He supplied the raw data to the authors, who recoded it to create these aggregate categories.
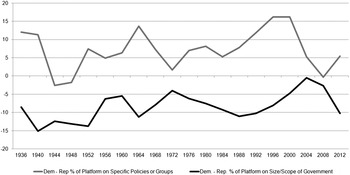
Finally, the official platforms of the national parties also reflect this perennial asymmetry, suggesting a contrast in the priorities of convention delegates and party organization leaders. Figure 5 illustrates the differences in the share of each party’s platform between 1936 and 2012 that was devoted to (1) general ideological rhetoric and (2) particular social group constituencies or public policies. We use a smoothed line (a weighted average with 25 percent based on the previous platform and 25 percent based on the next platform) to compensate for erratic short-term shifts. On average, 20 percent of the Republican platform was dedicated to discussing the size and scope of government, whereas Democrats allocated just 11 percent. Policy positions and proposals for specific constituencies represented 43 percent of the total language in the typical Democratic platform. This coding scheme only allowed differentiation between some constituency-focused appeals and general policy positions, but other analysis shows that Democratic platforms and nomination speeches were more focused on policies oriented toward minority social groups. Footnote 40
Differences in platform discussion of ideology and specific policies and groups
Note: The figure reports a three-year weighted mean (with the previous and succeeding years each receiving a weight of .25) of the percent of the Democratic and Republican party platforms that were dedicated to discussions of ideology (the size and scope of government) or specific social groups and public policies in all presidential elections since 1936. Some discussions fit into neither of these aggregate categories. These data were compiled from sentence-level hand coding of party platforms by the Comparative Manifestos Project (Volkens et al. Reference Volkens, Lehmann, Merz, Regel and Werner2013). The ideological indicator includes categories 203, 204, 301–305, 401, and 412–414. The social group and public policies indicator includes categories 402–404, 401, 504–507, 605, 606, 701, and 703–706. More information is available at: https://manifesto-project.wzb.eu/.

Party Asymmetry in the Twenty-first Century Congress
The behavior of the two parties in government reflects the distinctive natures of their popular bases of support among activists and voters. For Democratic officeholders, the demands of party constituencies encourage them to deliver concrete policy change, though this objective can be complicated by the lack of a strong ideological consensus as well as skepticism within a symbolically conservative public of initiatives characterized by critics as “big government schemes.” Republicans maintain relative philosophical unity, but serious internal disagreements have recently emerged over the proper application of conservative principles to the practice of policy-making, while intense pressure from party activists to engage in frequent demonstrations of fidelity to movement conservatism risks alienating an operationally liberal national electorate. Footnote 41
Accounts of the two congressional parties’ dissimilar governing styles have traditionally characterized the Democratic Party as internally conflicted and disorganized due to its status as a loose confederation of discrete, jostling groups, while Republican officials have been historically portrayed as maintaining relative unity in pursuing shared policy goals. Footnote 42 The events of the past several years necessitate a serious reconsideration of these long-lived reputations. Although challenges emerged en route, congressional Democrats remained sufficiently united to enact an ambitious legislative program in 2009–2010, while the divided, and at times chaotic, Republican House majority in power since 2011 has demonstrated that Republicans do not always march in lockstep behind their party leaders. Though scholars once viewed the multiplicity of interests on the Democratic side as a serious impediment to governance, Democratic groups have better accommodated each other over time while the formerly “disciplined” Republican Party has splintered into purist and pragmatist factions. The rising influence of conservative activists over elected Republicans in recent years contradicts the previous assumption that ideological movements are inherently easier to manage than social group coalitions; the parties differ more over the basis of internal disagreements than over their relative depth or frequency.
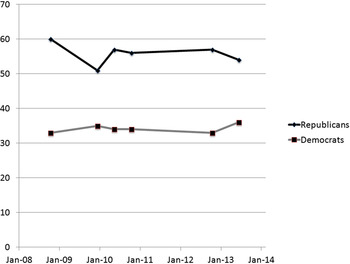
The decisive collective rightward shift of congressional Republicans in both chambers since the 1970s, a trend that accelerated after 1994 and rendered the party’s moderate bloc essentially extinct, Footnote 43 has not satisfied the preferences of Republican identifiers in the electorate for an even more conservative national party. As figure 6 illustrates, most Republicans consistently voice a desire for their party to become more conservative while a majority of Democrats prefer that the Democratic Party become more moderate; this difference predates the Obama presidency. Asymmetric polarization of the parties in government thus reflects the unequal pressure placed on officeholders by their respective popular bases.
Percent preferring ideological purity to moderation by party
Note: The figure reports the share of each party’s identifiers who say that they want their party’s leaders to “move in a more liberal/conservative direction” (as opposed to “a more moderate direction”). These data are from Pew Research Center surveys in 2008, 2010, 2012, and 2013.

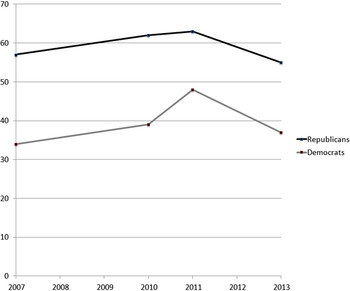
Democratic and Republican identifiers also differ with respect to favored governing style, as revealed by figure 7. Republicans in the electorate consistently express more admiration for politicians who “stick to their principles,” while Democrats favor those who “make compromises.” This discrepancy held even during the later George W. Bush administration, when many liberal commentators openly favored confrontation with Bush and his partisan allies in Congress. Footnote 44 Though they voiced strong disapproval of the Bush presidency, rank-and-file Democrats still expressed a preference for compromise in government—a tendency that has carried over to the Obama era. Likewise, Republicans have consistently valued doctrinal purity over pragmatic deal-making regardless of which party is in power.
Percent preferring principles over compromise by party
Note: The figure reports the share of each party’s identifiers who say that they admire politicians “who stick to their principles” (as opposed to “who make compromises”). These data are from Pew Research Center surveys in 2007, 2010, 2011, and 2013.

Criticism from media figures, interest group leaders, or financial donors that elected officials have betrayed the ideological commitments of their party via excessive compromise thus perennially finds a more sympathetic reception on the right than the left. Although some liberal elites complained that congressional Democrats failed to provide effective opposition to George W. Bush, especially on foreign policy, no coordinated effort arose to expel perceived moderates and apostates from the ranks of party officeholders, suggesting the limited appeal of this argument even within the Democratic base. In contrast, the 2008 election of Barack Obama immediately provoked a national mobilization of conservative activists motivated by the twin beliefs that Obama’s policies endangered the health of the nation and that the Republican Party had drifted unacceptably from its foundational principles.
The activist right has attained considerable influence over congressional politics in the Obama years by applying intense electoral pressure to Republican incumbents. An increasingly well-funded set of national conservative organizations, including the Club for Growth, Heritage Action, the Tea Party Patriots, the Madison Project, and the Senate Conservatives Fund, has emerged as a significant force in Republican primary elections, leading to the defeat of three sitting senators for renomination in 2010 and 2012 as well as the nomination in open-seat races of outsider candidates such as Rand Paul and Ted Cruz over establishment Republicans. The language of abstract ideology suffuses the rhetorical arguments made on behalf of this internal partisan revolt. Matt Kibbe, president of the conservative activist organization FreedomWorks, wrote in 2013 that he perceived “a hostile takeover happening within the Republican Party. The senior management of the GOP has failed its key shareholders, abandoning the founding vision of individual freedom, fiscal responsibility, and constitutionally limited government… The GOP is freedom’s party, and we’re taking it back.” Footnote 45 “With each vote cast in Congress, freedom either advances or recedes,” announced Heritage Action CEO Michael A. Needham in 2011 upon the introduction of a legislative scorecard designed to “empower Americans to hold their Members of Congress accountable to conservative principles.” Footnote 46 The willingness of Republican primary voters to support Tea Party-backed candidates over more experienced and familiar politicians reflects their relative openness to purist ideological appeals, benefiting candidates who cultivate a reputation as a “true” or “principled” conservative.
The growing strength of the mobilized conservative movement complicates Republican congressional leaders’ approach to governing. Rebellious blocs of members have repeatedly frustrated the efforts of party leaders to unite behind legislation, especially if it is the result of compromise with Democrats. During the George W. Bush presidency, a conservative revolt nearly blocked Bush’s Medicare Part D initiative and successfully prevented the passage of comprehensive immigration reform. House conservatives also helped to defeat Bush’s Troubled Asset Relief Program when it was first brought to a vote in September 2008 as an emergency response to a crisis in the financial industry; the bill passed on a revote days later after a precipitous drop in financial markets. More recently, Boehner negotiated a deficit reduction agreement with Obama in the summer of 2011 only to discover that conservative opposition doomed its prospects in the House.
From the perspective of many Republican officeholders, exacerbating procedural confrontation with Democrats serves as an intentional strategy to inspire support (or relieve pressure) from an otherwise suspicious party base. In January 2013, a House leadership aide told Politico that Republicans “may need a [government] shutdown just to get it out of their system. We might need to do that for member management purposes, so they have an endgame and can show their constituents they’re fighting.” Footnote 47 The following October, a standoff with Obama and Senate Democrats over appropriations and the federal debt ceiling—an exercise in brinkmanship demanded by conservative purists but supported by more pragmatic Republicans who, despite amply-documented private misgivings, feared that public opposition would invite retribution from the party base—indeed resulted in a 16-day partial government shutdown and came within days of triggering a default on federal debt repayments. Republican leaders ultimately relented, bringing a bill to the House floor that reopened the government and raised the debt ceiling without conditions; even so, a majority of House Republicans voted against the legislation in order to appease party activists.
This was not the first time that the House leadership had allowed a bill to pass over the opposition of most party members. Formerly a rare phenomenon—the “Hastert Rule,” named after a former Republican speaker, dictated that the floor should only be open to legislation backed by a majority of the ruling party—this practice became more frequent during the Boehner speakership, when at least six major bills passed the House despite lacking majority support in the Republican Conference. Footnote 48 As a group, House Republicans did not wish to risk their party’s standing with the general electorate by causing a default on the national debt, preventing disaster relief for the victims of Hurricane Sandy, or blocking reauthorization of the Violence Against Women Act, yet most individual party members opposed these measures in floor votes in order to maintain an acceptably conservative personal voting record—a maneuver occasionally described as “Vote No, Hope Yes.”
Despite a rhetorical commitment to achieving major reductions in the size and role of the federal government, the Boehner-led House has been distinguished in practice by its unusual lack of legislative productivity. Only 561 bills passed the House during the 2011–2012 session of Congress—the lowest figure since the pre-World War II era—and just 217 passed in 2013. Instead, congressional Republicans have devoted substantial attention to symbolic position-taking designed to assuage party activists—for example, voting more than 50 times to repeal all or part of the Affordable Care Act (ACA), also known as “Obamacare.” The limited substantive agenda of the contemporary House suggests that party leaders are wary of alienating the operationally liberal American public by advancing a large number of specific conservative proposals, while more moderate policy-making would likely provoke opposition from the conservative base. Footnote 49
This modest legislative output notably differs from the record of Boehner’s Democratic predecessor, Nancy Pelosi, who served as speaker between 2007 and 2010. House Democrats pursued an ambitious programmatic agenda during this period, attempting to satisfy various party constituencies favoring specific policy initiatives: an equal-pay bill for women’s rights organizations, a raise in the minimum wage for labor unions, a climate change bill for environmentalists, repeal of the military’s “don’t ask, don’t tell” policy for gay rights groups, financial services regulation for consumer advocates, and so forth. The relative lack of ideological unity within the congressional Democratic Party often made passage challenging (some proposals favored by liberals, such as union “card check” legislation, were ultimately blocked by party moderates, while others, such as the ACA, passed narrowly due to significant moderate defection), but the widespread engagement in policy details and the willingness to compromise in order to improve the prospects of enactment—such as the concessions made during the ACA’s year-long journey though the legislative process—reflected the preferences of constituencies seeking substantive achievements. This governing approach was also evident in the Democratic-controlled Senate of 2013–2014, in which party leaders brokered agreements with members of the Republican minority in order to pass agenda items such as extended unemployment insurance and comprehensive immigration reform legislation.
Yet congressional Democrats faced challenges of their own. Several of the biggest legislative achievements of the Pelosi-led Congress, including the 2009 economic stimulus package, the Dodd–Frank financial reform bill, and (especially) the ACA, proved controversial—and in some cases decidedly unpopular—due to Republicans’ effective characterizations of these initiatives as “out-of-control spending,” “government takeovers,” “job killers,” and even “socialism,” thus contributing to the dramatic losses suffered by Democratic candidates in the 2010 midterm elections. Legislative opponents sounded rhetorical themes designed to prime the symbolic conservatism of the electorate, while defenders attempted (often less successfully) to publicize specific benefits that might appeal to operationally liberal voters. Since its passage in 2010, surveys have consistently found that the ACA as a whole inspires more opposition than support from Americans even as nearly all of its individual provisions win majority approval—another example of the fundamental divide between symbolic and operational ideology that has long characterized public opinion in the United States. Footnote 50
Party Asymmetry in a Polarized Era
While the growth of ideological polarization in Congress has been driven principally by the collective rightward shift of the national Republican Party, the increasingly intransigent governing style of Republican officeholders is not merely a reflection of the widening substantive distance between the parties. A party primarily united by ideology will always remain particularly vulnerable to charges from within its ranks that elected leaders, faced with the constraints of a separation-of-powers system and the need to maintain popular appeal beyond the party base, have strayed from principle and must be forced back into line. Though the ability of purist activists to enforce obedience on officeholders has increased in recent years, adherence to conservative ideals has long served as a definitional attribute of Republicanism. Democratic politicians face their own share of problems in governing—they must provide concrete benefits to a diverse set of constituents without activating public opposition to “big government”—but they are comparatively free from pressure to exhibit unyielding fidelity to party doctrine.
The portrayal of most Republican identifiers in the mass public as symbolically conservative might seem to contradict the widespread scholarly view of the American electorate as largely non-ideological and thus increasingly disconnected from the rapidly polarizing elite class—a characterization traditionally associated with Converse but more recently advanced by Morris P. Fiorina. Fiorina’s studies demonstrate that many voters identify as moderates and hold centrist or ideologically incoherent beliefs; he argues that evidence of partisan polarization in the mass public is explained by an increasing association between policy preferences and party identification rather than a growth in the aggregate extremity of citizens’ issue positions. Footnote 51 While many voters fail to exhibit ideological consistency across a range of specific issue areas—what Converse dubbed “constraint”—abstract reasoning still remains critical to structuring Republicans’ conception of the political world and their place within it.
To be sure, many symbolic conservatives are not operational conservatives; some are even operational liberals. For example, self-identified members of the Tea Party movement often favor generous public entitlement programs despite their stated dedication to small-government principles, a contradiction which they may not consciously recognize (one participant in a South Carolina town hall meeting even reportedly warned his congressman to “keep your government hands off my Medicare”). Footnote 52 Yet such inconsistencies in the application of general ideological commitments to particular issues have clearly not prevented many of these activists from exerting intense electoral pressure on Republican politicians to demonstrate highly visible symbolic loyalty to the conservative cause, thus accounting for intemperate rhetoric and confrontational behavior among Republican elites that otherwise appear politically risky given an ostensibly “moderate” public. The growing casualty list of prominent political careers threatened or ended by Republican primary voters represents a powerful illustration of symbolic conservatism’s considerable electoral power.
If we do not overstate the importance of ideology on the right, do we instead understate its prevalence on the left? A decline over the past few decades in the proportion of Democrats who identify as conservatives has helped to strengthen the overall association between partisanship and ideological self-identification. Footnote 53 Symbolic liberals represent one important element of the larger Democratic coalition (especially among elites and highly-engaged citizens), but abstract ideology does not serve as a fundamental bond unifying the party membership as it does for Republicans. The centrality of social identity in cementing the Democratic loyalties of many groups constituting a large share of the party’s mass electoral base—racial minorities, the poor, non-Christians—is apparent from these voters’ strong devotion to Democratic candidates despite relatively modest levels of liberal self-classification and infrequent use of ideological reasoning in justifying their views of the parties.
Among some ideologically-oriented elites, the “liberal” or “progressive” ethos includes a broader devotion to the principle of egalitarianism, which may be articulated by referring to the specific groups perceived to be underprivileged in American society and therefore in need of salutary public policy. Footnote 54 Although these egalitarian ideals provide politically sophisticated individuals with a means of bringing intellectual coherence to the Democratic social coalition, our findings indicate that they are not highly prevalent in the mass electorate. Footnote 55 Ideologically innocent citizens voting on the basis of social identity and ideologically-motivated activists devoted to the cause of combating systematic social discrimination are united under the big tent of the Democratic Party by their mutual perception of politics as an arena of intergroup conflict. Challenges to party officeholders on the basis of insufficient devotion to ideological principle are limited by the relatively small proportion of abstract liberal thinkers even within the loyal Democratic base.
The behavior of strategic office-seekers attempting to win favor from party activists, financial donors, and primary voters can be expected to reinforce these existing differences between the electoral supporters of the two parties. Of course, influence can and does move in the other direction as well, with elites retaining an ability to shape the opinions of the party’s mass membership, but an individual politician serving in a particular era may feel much more like a captive than a leader of the party faithful. Footnote 56 Though the evidence presented here cannot settle the tangled causal question of whether the ideological polarization of party elites was initiated by elected officials, activists, or voters, it demonstrates that the particular prevalence of, and receptiveness to, ideological appeals in Republican politics long predates the current trend of partisan divergence. The rise of the Tea Party merely represents the most recent manifestation of popular mobilization around the cause of symbolic conservatism. Footnote 57 A historically-informed perspective suggests that there is little reason to expect a reversal of this trajectory in the near future.
Further Implications of Asymmetric Politics
The fundamental asymmetry of America’s two political parties in organization and governance was recognized by prior generations of scholars, even though recent theory-building has sought to generalize across party lines. Though Bawn et al. argue persuasively that parties are better understood as networks with influential activist bases than as alliances of politicians merely responsive to the median voter, the Democratic Party comes much closer than the Republican Party to matching the ideal type of “coalitions of groups with intense preferences on particular policies.” Footnote 58 Our view is more consistent with classic studies of party culture, although they tended to focus on the comparative operations of party organizations and demonstrated less concern with the relationship between the nature of party affinity in the mass public and the governing styles of party elites. Footnote 59
We recognize the recent proliferation of studies emphasizing the unique characteristics of contemporary Republican governance, but note that attempts to explain the distinctive behavior of Republican officeholders can be strengthened by accounting for the particular demands of their party base. Hacker and Pierson have recently argued that American parties should not be treated as equivalent vote-maximizing agents; they call for a renewed focus on the relationship between interest groups and party policy. Footnote 60 Our findings indicate that differences in kind between the parties may render traditional models of policy-making much more applicable to the practical, group-based approach of the Democratic Party than the symbolic, ideological character of the Republicans. But we concede that the complexity of the interrelationships at play and the limitations of available data sometimes restrict our ability to draw more than tentative conclusions. Footnote 61
The scope and impact of the Tea Party within contemporary Republican politics draws attention to the lack of a comparable movement on the left. Historically, many social movements have gained influence in the Democratic Party—including civil rights, feminism, and environmentalism—but their members have simply integrated as additional elements within the party’s existing coalition of constituent groups. Footnote 62 Broader liberal or leftist movements have faced greater difficulties in winning political power. Occupy Wall Street, the most recent example, did not mimic the Tea Party by fielding electoral challengers or seeking control of party organizations; some leaders dismissed partisan politics altogether. Footnote 63 In any event, the relatively small population of symbolic liberals within the American electorate would not have augured well for the success of such an effort. Even this consciously principled movement of the left expressed political conflict in group-based terms, claiming to represent the interests of the bottom “99%” of Americans against the perceived economic exploitation of the richest “1%.”
The findings presented here also provide context to the recent debate over Republican “reinvention.” After Romney lost to Obama in the 2012 presidential election despite carrying the white vote by a margin of 59 percent to 39 percent (according to exit polls), conventional wisdom decreed that Republican leaders needed to increase their party’s popularity among racial minorities by taking more liberal positions on issues such as immigration or else forfeit the ability to compete effectively for the presidency—a conclusion that was promptly rejected by many conservative activists. Historically, Republicans have attempted to court minority voters on the basis of shared values, while Democrats offer an appeal based on social identity and issues of special group concern. We would expect minority voters to be more attracted to the coalitional nature of the Democratic Party as long as they perceive themselves as belonging to a discrete social group with distinctive political interests, complicating Republican efforts to win a significantly greater share of their support. Footnote 64 The partisan realignment of southern whites offers an instructive example: while a member of the Democratic coalition, this voting bloc was a self-conscious constituency with separable concerns from the perceived national mainstream; in the Republican Party, it has become part of the undifferentiated conservative base.
Finally, our analysis offers a novel view on the place of the American parties in a comparative context. Scholars of party systems emphasize the small number of competitive parties in the US, but also note that the Republican Party is ideologically positioned well to the right of most other major center-right parties, especially those in Europe. Footnote 65 Unique features of the American system might help explain the bifurcation we identify. Because the two-party system presented limited channels for the expression of multiple social identities, the Democratic Party became a big tent for constituencies that might remain separate in multiparty systems while the Republican Party incorporated nationalist elements, which become far-right parties elsewhere, under a banner of conservative ideology. The relative absence of symbolic liberalism among Democrats may address the perennial question, central to claims of American exceptionalism, of why socialism failed to gain political power in the United States. One common answer—that social diversity undermined class-based political conflict—might be further amended by the findings presented here: perhaps the Democratic Party did not become a socialist party because it instead retained the arrangement of a diverse group coalition.
Due to its consequences for elite governance, party asymmetry is likely to interest observers beyond the borders of the United States. The ferocity of contemporary partisan conflict in Washington has been noted with increasing alarm overseas, given the worldwide implications of a potential credit default or other serious governing crisis stemming from the confrontational approach of conservative leaders in Congress. International observers may view these developments as reflecting the relative conservatism of the American public as a whole, but their true source remains the unique political character and mass appeal of the Republican Party.