


1. INTRODUCTION
The intensity distribution of laser beam in its propagation region is important because it determines the laser–plasma interaction process. Intensity varying two regimes defines the electron energy gain from laser fields during the laser–electron interaction (Hartemann et al., Reference Hartemann, Fochs, Sage, Luhmann, Woodworth, Perry, Chen and Kerman1995). First, the lower intensity where laser field is weak and net kinetic energy gain by electron remains lower. Second, the higher intensity where laser field is stronger and electron energy gain as well as acceleration is higher. Accordingly the electron trapped in a laser field gets accelerated to high energy due to strong laser field. The laser beam parametric variations have been investigated theoretically and several experimental models have been presented for high energy gain by electrons during the interaction with the laser pulse (Erikson & Singh, Reference Erikson and Singh1994; Sprangle et al., Reference Sprangle, Hafizi, Penano, Hubbard, Ting, Zigler and Antonsen2000; Geddes et al. Reference Geddes, Toth, Tilborg, Esarey, Schroeder, Bruhwiler, Nieter, Cary and Leemans2004; Leemans et al., Reference Leemans, Nagler, Gonsalves, Toth, Nakamura, Geddes, Esarey, Schroeder and Hooker2006; York & Milchberg, Reference York and Milchberg2008; Esarey et al., Reference Esarey, Schroeder and Leemans2009; Hooker, Reference Hooker2013). In an experiment with a laser-driven plasma accelerator, the acceleration gradient of about 10 GeV/m was reported with emergence of a mono-energetic and low divergence electron beams in 100 MeV–1 GeV range (Erikson & Singh, Reference Erikson and Singh1994). Fortin et al. (Reference Fortin, Piche and Varin2010) studied the dependence of energy gained by the electron on the power of laser, laser beam waist, and duration of laser pulse for electron acceleration. Gaussian profile of laser pulse proves its suitability for electron acceleration because of its ability to generate high energy, narrow divergence electron beams of constricts energy spread (Fortin et al. Reference Fortin, Piche and Varin2010; Ghotra & Kant, Reference Ghotra and Kant2016a
). The fields of lowest order radially polarized Gaussian laser beam were employed to accelerate electrons to energy range of GeV (Salamin, Reference Salamin2006; Gupta et al., Reference Gupta, Kant, Kim and Suk2007). The Gaussian beam fields are determined by laser beam frequency ω, radius of beam waist r
0 at the focus, and Rayleigh length
 ${Z_{\rm R}} = kr_0^2 /2$
. Feng et al. (Reference Feng, Wei, Peixiang and Han2004) studied the vacuum acceleration of electron with a Gaussian laser pulse. They proposed that the evolution of the laser beam waist cannot be ignored when the electron-drifting distance is of the order of Rayleigh length. Thus, the electron can efficiently be accelerated and drawn out by the longitudinal ponderomotive force due to Gaussian laser beam. The electron energy gain of few MeV was realized with a Gaussian laser beam of intensity above 1019 W/cm2. Propagation properties of Gaussian laser beams directly influence the electron acceleration. The presence of external magnetic field, polarization characteristics of laser pulse and frequency variations of laser pulse enhance the electron dynamics and energy gain during laser–electron interaction (Ghotra & Kant, Reference Ghotra and Kant2015a
, Reference Ghotra and Kant
b
). The mode index-influenced intensity variations were investigated and reported (Belafhal & Ibnchaikh, Reference Belafhal and Ibnchaikh2000; Nanda & Kant, Reference Nanda and Kant2014; Alpmann et al., Reference Alpmann, Scholer and Denz2015). A Gaussian beam when involves a product of Hermite and Gaussian functions forms Hermite–Gaussian (HG) beam. The field distribution of such beam in its lowest mode comprises TEM00 mode and represented as a Gaussian beam. In another study, we presented the polarization effect of a Gaussian laser beam on electron acceleration in vacuum (Ghotra & Kant, Reference Ghotra and Kant2016b
). We reported a higher energy gain by electrons with a circularly polarized (CP) laser beam than that with a linearly polarized (LP) laser beam. The higher-order modes of the HG beam are designated as TEM
mn
HG modes, where m and n are the mode indices. Recently, Flacco et al. (Reference Flacco, Vieira, Lifschitz, Sylla, Kahaly, Veltcheva, Silva and Malka2015) conducted an experiment using the HG laser beam with distinct modes such as (0, 0), (0, 1), (0, 2), (0, 3), and (0, 4). They reported MG ordered persisting magnetic field driven by the relativistic electrons in a plasma. Gaussian TEM00 mode has an intensity peak at the propagation axis, so the electron scatters away with low energy due to a strong ponderomotive force in the transverse direction. A static inhomogeneous magnetic field controls the trapping of electron at the focus of TEM00 mode of Gaussian laser pulse for effective acceleration (Saberi & Maraghechi, Reference Saberi and Maraghechi2015). However, the higher-order TEM modes of HG beam posseses the characteristics intensity distributions, which enforce a better trapping of electron at the focus than that with TEM00 mode even in the absence of an external magnetic field.
In this paper, we present the influence of different mode indices of Hermite polynomial on electron acceleration by using a relativistic three-dimensional (3D) single-particle code with CP-HG laser beam in the plasma. We investigate the effect of a laser beam width parameter and mode indices of HG laser beam on electron acceleration with variation of laser intensity. High-energy gain is realized in the presence of high-intensity laser pulse. We compare the acceleration distance in term of Rayleigh length for different values of the laser beam spot size. The greater count of Rayleigh length in terms of propagation distance is observed for a smaller beam spot size and vice versa. The laser's beam width parameter increases with propagation distance. The electron gains high energy with a small beam width parameter due to strong laser field and losses its energy with a large beam width parameter due to weak field at the large propagation distance. We plot the electron energy gain variation for the distinct transverse electromagnetic (TEM) mode indices (0, 1), (0, 2), (0, 3), and (0, 4) with a propagation distance. With a lower-order HG laser beam, small electron acceleration has been observed for longer distance and vice versa. The content of the remaining part of this paper is arranged as follows. Section 2 explains the electromagnetic fields of a HG laser beam, Section 3 explains the distinct modes with intensity of HG laser beam, and Section 4 presents the electron dynamics required to study electron acceleration. Outcomes are discussed in Section 5. Finally, conclusion is drawn in Section 6.
2. FIELD DISTRIBUTION FOR A CP-HG BEAM
The transverse electric field components for a CP-HG laser beam propagating in the z-direction, under a paraxial approximation can be written as (Belafhal & Ibnchaikh, Reference Belafhal and Ibnchaikh2000; Nanda & Kant, Reference Nanda and Kant2014; Alpmann et al., Reference Alpmann, Scholer and Denz2015):
 $$\eqalign{{E_x}(r,z,t) & = \displaystyle{{{E_0}} \over {\,f\,({\rm \xi} )}}\exp {\kern 1pt} (i{\rm \varphi} ){H_{\rm m}}\left( {\displaystyle{{\sqrt 2} \over {{r_0}f\,({\rm \xi} )}}x} \right) \cr & \quad \exp \left( { - \displaystyle{{{{(t - (z - {z_{\rm L}}/c))}^2}} \over {{{\rm \tau} ^2}}} - \displaystyle{{{r^2}} \over {r_0^2 {\,f^2}}}} \right),} $$
 $$\eqalign{{E_y}(r,z,t) & = \displaystyle{{{E_0}} \over {\,f\,({\rm \xi} )}}\exp \left[ {i\left( {{\rm \varphi} + \displaystyle{{\rm \pi} \over 2}} \right)} \right]{H_n}\left( {\displaystyle{{\sqrt 2} \over {{r_0}f\,({\rm \xi} )}}y} \right) \cr & \quad \exp \left( { - \displaystyle{{{{(t - (z - {z_{\rm L}}/c))}^2}} \over {{{\rm \tau} ^2}}} - \displaystyle{{{r^2}} \over {r_0^2 {\,f^2}}}} \right),} $$
where E 0 is the amplitude of an electric field of the HG laser beam; ϕ is the HG beam phase; H m,n is the Hermite-polynomial function; m, n are the mode indices associated with Hermite-polynomial; τ is the laser pulse duration; Z L is the initial position of the pulse peak, r 2 = x 2 + y 2; r 0 is the minimum laser spot size, and c is the velocity of light in vacuum; f(ξ) is the laser beam width parameter and can be expressed as:
 $$f\,({\rm \xi} ) = \sqrt {1 + {{\rm \xi} ^2}}, $$
where ξ = z/Z
R is the normalized propagation distance,
 ${Z_{\rm R}} = kr_0^2 /2$
is the Rayleigh length, k is the laser wave number,
 ${\rm \varphi} = {{\rm \omega} _0}t - kz + {\rm (}m + n + {\rm 1)}{\tan ^{ - 1}}({\rm \xi} ) - z{r^2}/({Z_{\rm R}}r_0^2 {\,f^2}) + {{\rm \varphi} _0}$
, ω0 is the laser frequency, (m + n + 1)tan −1(ξ) is the Guoy phase (Flacco et al., Reference Flacco, Vieira, Lifschitz, Sylla, Kahaly, Veltcheva, Silva and Malka2015), and ϕ0 is the initial phase.
To express the laser fields correctly, in addition to the transverse electric components, the longitudinal electric and magnetic components are express by paraxial ray approximation as:
 $${E_z}(r,z,t) = - \left( {\displaystyle{i \over k}} \right)\left( {\displaystyle{{\partial {E_x}} \over {\partial x}} + \displaystyle{{\partial {E_y}} \over {\partial y}}} \right),$$
 $$\vec B(r,z,t) = - \left( {\displaystyle{i \over {\rm \omega}}} \right)\left( {\vec \nabla \times \vec E} \right).$$
We consider a plasma with a density about 1023 m−3, and a laser pulse of the wavelength λ = 1.054 µm. Therefore, the plasma frequency and the frequency of laser pulse are ωp = 1.8 × 10¹³ rad/s and ω0 = 1.8 × 10¹⁵ rad/s, respectively. Hence,
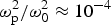 ${\rm \omega} _{\rm p}^2 /{\rm \omega} _0^2 \approx {10^{ - 4}}$
. It has been experimentally proved that at this plasma density (with pressure ≈1 Torr), plasma effects such as wake-fields, plasma instabilities, and modification of the amplitude can be neglected (Moore et al., Reference Moore, Ting, Jones, Briscoe, Hafizi, Hubbard and Sprangle2001).
3. INTENSITY DISTRIBUTION FOR DIFFERENT TEM MODES OF A CP-HG LASER BEAM
For a Hermite polynomial
 ${H_{m{\rm,} n}}(\sqrt 2 r/{r_0}f\,({\rm \xi} ))$
, the intensity of the CP-HG laser beam is expressed as:
 $$I(r,z,t) = {I_0}{\left[ \matrix{\displaystyle{{{E_0}} \over {\,f\,({\rm \xi} )}}{H_m}\left( {\displaystyle{{\sqrt 2} \over {{r_0}f\,({\rm \xi} )}}x} \right){H_n}\left( {\displaystyle{{\sqrt 2} \over {{r_0}f\,({\rm \xi} )}}y} \right) \hfill \cr \exp \left( { - \displaystyle{{{{(t - (z - {z_{\rm L}}/c))}^2}} \over {{{\rm \tau} ^2}}} - \displaystyle{{{r^2}} \over {r_0^2 {\,f^2}}}} \right) \hfill} \right]^2}.$$
The intensity of a CP-HG laser beam for different mode indices has been obtained using Eq. (6). We write the Hermite polynomial (Nanda & Kant, Reference Nanda and Kant2014) and intensity proportionality with different mode indices for a CP-HG laser beam in Table 1.
Hermite polynomials (H m , Hn ) and intensity factor I ∝ (H m H n )2 with different mode indices (m, n) for the CP-HG laser beam

HG modes are designated as transverse electromagnetic modes, that is, TEM mn . The lowest order HG mode is TEM00. This mode represents a Gaussian beam. The Guoy phase of a TEM mn mode is stronger than that of the TEM00 mode by a factor m + n + 1.
4. ELECTRON DYNAMICS AND RELATIVISTIC ANALYSIS
The momentum and energy of electron are expressed in terms of the following equations:
 $$\displaystyle{{d{p_x}} \over {dt}} = - e{E_x} + e{{\rm \beta} _z}{B_y} - e{{\rm \beta} _y}({B_z}),$$
 $$\displaystyle{{d{p_y}} \over {dt}} = - e{E_y} - e{{\rm \beta} _z}{B_x} + e{{\rm \beta} _x}({B_z}),$$
 $$\displaystyle{{d{p_z}} \over {dt}} = - e{E_z} - e({{\rm \beta} _x}{B_y} - {{\rm \beta} _y}{B_x})$$
 $$\displaystyle{{d{\rm \gamma}} \over {dt}} = - e({{\rm \beta} _x}{E_x} + {{\rm \beta} _y}{E_y} + {{\rm \beta} _z}{E_z}),$$
where (p
x
, py, p
z) are the (x, y, z) coordinates of the momentum
 $\vec p = {\rm \gamma} {m_0}\vec v$
; (β
x
, β
y
, β
z
) are the (x, y, z) coordinates of the normalized velocity
 ${\rm \vec {\rm \beta}} = \vec v/c$
;
 ${{\rm \gamma} ^2} = 1 + (\,p_x^2 + p_y^2 + p_z^2 )/{({m_0}c)^2}$
is the Lorentz factor, −e and m
0 are the charge and rest mass of electron, respectively. The dimensionless variables are expressed as follows:
 $$\eqalign{& {a_0} \to \displaystyle{{e{E_0}} \over {{m_0}{{\rm \omega} _0}c}},\quad {\rm \tau} ^{\prime} \to {{\rm \omega} _0}{\rm \tau}, \quad {r_0}^{\prime} \to \displaystyle{{{{\rm \omega} _0}{r_0}} \over c},\quad {z_{\rm L}}^{\!\!\prime} \to \displaystyle{{{{\rm \omega} _0}{z_{\rm L}}} \over c}, \cr & \quad \quad x^{\prime} \to \displaystyle{{{{\rm \omega} _0}x} \over c},\quad y^{\prime} \to \displaystyle{{{{\rm \omega} _0}y} \over c},\quad z^{\prime} \to \displaystyle{{{{\rm \omega} _0}z} \over c},} $$
 $$\eqalign{& {{\rm \beta} _x} \to \displaystyle{{{v_x}} \over c},\quad {{\rm \beta} _y} \to \displaystyle{{{v_y}} \over c},\quad {{\rm \beta} _z} \to \displaystyle{{{v_z}} \over c},\quad t^{\prime} \to {{\rm \omega} _0}t,\quad {\,p_0}^{\!\!\prime} \to \displaystyle{{{\,p_0}} \over {{m_0}c}}, \cr & \quad \quad {\,p_x}^{\!\!\prime} \to \displaystyle{{{\,p_{\rm x}}} \over {{m_0}c}},\quad {\,p_y}^{\!\!\prime} \to \displaystyle{{{\,p_y}} \over {{m_0}c}},} $$
 $${\,p_{\rm z}}^{\!\!\prime} \to \displaystyle{{{\,p_{\rm z}}} \over {{m_0}c}},\quad {\rm and}\quad k' \to \displaystyle{{ck} \over {{{\rm \omega} _0}}}.$$
Equations (7)–(10) are the coupled differential equations. These equations have been solved numerically with a computer simulation code for electron energy.
5. RESULTS AND DISCUSSION
We have chosen the following dimensionless parameters for numerical analysis: a 0 = 5 (represents laser intensity I ~ 6.92 × 10¹⁹ W/cm2), a 0 = 25 (represents the laser intensity I ~ 8.5 × 10²⁰ W/cm2), a 0 = 50 (represents the laser intensity I ~ 6.8 × 10²¹ W/cm2); r 0′ = 150 (represents the laser spot size r 0 ~ 25 µm), r 0′ = 300 (represents the laser spot size r 0 ~ 50 µm), r 0′ = 450 (represents the laser spot size r 0 ~ 75 µm), τL′ = 70 (corresponding to laser pulse duration of 200 fs); initial position of pulse peak z L′ = 0; initial electron position x i′ = 0, y i′ = 0, and z i′ = 0; initial phase ϕ0 = 0, normalized initial momentum of electron p 0′ = 1. The peak power of the laser pulse corresponds to intensity parameter a 0 = 5 with r 0′ = 150 is about 0.67 PW.
Figure 1 represents the normalized intensity I(ξ)/I 0 distribution plots with normalized longitudinal distance ξ and normalized radial distance r′/f(ξ) at a 0 = 5 and r 0′ = 300 for distinct TEM modes (m, n). This corresponds to a peak power of about 2.7 PW of laser pulse. These days the laser pulse power in PW range is feasible experimentally (Dabu, Reference Dabu2015; Turcu et al., Reference Turcu, Balascuta, Negoita, Jaroszynski and Mckenna2015).
Normalized intensity I(ξ)/I 0 distribution plots with normalized longitudinal distance ξ and normalized radial distance r′/f(ξ) at a 0 = 5 and r 0′ = 300 for TEM modes (m, n) as: (a) (0, 1), (b) (0, 2), (c) (0, 3), and (d) (0, 4).

As depicted the intensity goes on decreasing with propagation distance. A strong intensity distribution close to the radial center appears with the lower mode, which becomes irregular with higher modes. This indicates the strong field near the center with lower modes. The presence of strong field keeps the electron close to the axis for longer distance. Hence, it plays a significant role in maintaining the resonance for longer distance.
Figure 2 represents the variation of electron energy gain with respect to normalized propagation distance ξ for the mode (m, n) = (0, 1). This gain has been examined for the distinct values of laser spot size, r 0′ with intensity parameters, a 0 = 5, 25, and 50. Higher-energy gain appears with higher intensity for same spot size.
Variation plots for electron energy gain for the mode (m, n) = (0, 1) with normalized propagation distance ξ and beam width parameter f(ξ) for the distinct values of laser spot size r 0′ and intensity parameters a 0 = 5, 25, and 50. (a) r 0′ = 75, (b) r 0′ = 150, (c) r 0′ = 300, and (d) r 0′ = 450. The other parameters are τL′ = 70, ϕ0 = 0, p 0′ = 1, z L′ = 0, x i ′ = 0, y i ′ = 0, and z i ′ = 0.

Figure 2(b) depicts the electron energy gain of about 600 MeV with a 0 = 50 and r 0′ = 150. Hartemann et al. (Reference Hartemann, Fochs, Sage, Luhmann, Woodworth, Perry, Chen and Kerman1995) reported the role of the beam focusing for achieving the high-energy accelerating particle. The beam width parameter plays a vital role in determining the accelerating distance by influencing the order of Rayleigh length with a focused Gaussian beam. We have plotted the variation of laser beam width parameter f(ξ) with respect to normalized propagation distance and observe an increase in the beam width parameter with the distance of propagation of laser pulse in the plasma. Smaller the value of beam width parameter, stronger is the electron acceleration and vice versa. Hence, high acceleration is observed with a small beam width parameter. We observe the acceleration and deceleration of electron while interaction with a HG laser pulse in the plasma.
It is due to the asymmetry in the intensity of the CP-HG laser beam, which enforces the trapping and acceleration of the electron for longer distance. The electron first gains high-energy during interaction with the leading part of the pulse. The gain saturates till reaching to the trailing part of the pulse. The electron acceleration distance calculated is about three times the Rayleigh length with a LP chirped laser pulse of a large spot size r 0′ = 900 in vacuum (Ghotra & Kant, Reference Ghotra and Kant2015c ). One can observe the acceleration distance with a CP-HG laser pulse, which is about six times the Rayleigh length for a smaller initial laser spot size, r 0′ = 300 in the plasma as depicted from Figure 2(c).
Betatron resonance, which is set up between accelerating electron and laser pulse during laser–electron interaction in the plasma, enforces electron acceleration for longer distance of propagation. Figure 2(d) presents the electron energy gain with a large beam spot size. In such case, the electron initially gains high energy while interaction with the laser pulse and soon decelerated due to weakening of the laser field with the increase of the propagation distance. The electron is accelerated where the laser field strength is high in the vicinity of sharp focus, and decelerated where laser field strength is weak. This makes an effective acceleration of electron in the plasma.
Figure 3 represents the variation plots for electron energy gain as a function of ξ for distinct intensity parameters and normalized laser spot size for the mode index, (m, n) = (0, 2). The variation has been expressed graphically for different intensity parameters a 0 = 5, 25, and 50. After reaching to the maximum energy gain, the electron is decelerated slightly due to weakening of field with increasing beam width parameter. The electron energy gain then saturates. The electron retains significant amount of energy even in the weak laser field. One can observe from Figures 3(a), 3(b), and 3(c) that the accelerated electron retains high energy for larger distance.
Variation plots for electron energy gain for the mode (m, n) = (0, 2) with normalized propagation distance ξ for distinct values of intensity parameter a 0 = 5, 25 and 50 with laser spot size: (a) r 0′ = 150, (b) r 0′ = 300, and (c) r 0′ = 450. Rests of the parameters are as referred in Figure 2.

Figures 4 and 5 represent the variation plots for electron energy gain with respect to the normalized propagation distance ξ for distinct intensity parameters and normalized laser spot size for the mode indices (m, n) = (0, 3) and (0, 4). In Figures 4(b) and 4(c), we see the variation for two different values of r 0′ = 300 and 450. The electron energy gain first increases while interaction with the laser pulse. After attaining the maximum energy gain, the electron is decelerated due to increasing laser beam width parameter, and then energy gain is saturated for larger distances. An energy gain of the order of 1 GeV is achieved with laser intensity a 0 = 50 (corresponding to I ~ 6.8 × 10²¹ W/cm2) and spot size r 0′ = 300. The electron energy gain greater than 1 GeV is achieved with the same intensity, and larger spot size r 0′ = 450. We have calculated the accelerating distance of the electron, which is about three times of the Rayleigh length.We find that with higher modes the electron gains higher energy quickly. However, retains a smaller portion of energy for larger distance. This is due to the variation of intensity with higher modes, which results a weak field at larger distance. Hence, the electron losses its gained energy with higher modes at larger distance.
Variation plots for electron energy gain for the mode (m, n) = (0, 3) with normalized propagation distance ξ for distinct values of intensity parameter a 0 = 5, 25, and 50 with laser spot size: (a) r 0′ = 150, (b) r 0′ = 300, and (c) r 0′ = 450. Rests of the parameters are as referred in Figure 2.

Variation plots for electron energy gain for the mode (m, n) = (0, 4) with normalized propagation distance ξ for distinct values of intensity parameter a 0 = 5, 25, and 50 with laser spot size: (a) r 0′ = 150, (b) r 0′ = 300, and (c) r 0′ = 450. Rests of the parameters are as referred in Figure 2.

Figure 6 represents the variation plots for electron energy gain with respect to the peak power of laser pulse for modes (m, n) = (0, 1) and (0, 4). The electron energy gain increases with laser power. As depicted the electron energy gain is above 1.5 GeV with mode index (0, 4) at peak power of 10 PW, whereas it is about 0.5 GeV with mode index (0, 1). It is clear that the electron energy gain is high with the higher mode index for the same power of laser pulse. Niu et al. (Reference Niu, He, Qiao and Zhou2008) observed an electron energy gain of about 262 MeV with a CP Gaussian laser pulse of peak intensity ~1020 W/cm2. We have observed higher energy gain with higher mode index at the same intensity with the CP-HG laser pulse. Our results show higher electron energy gain of about 650 and 1350 MeV with mode indices (0, 1) and (0, 4), respectively, for a CP-HG laser beam of peak intensity 8.5 × 10²⁰ W/cm2. Magnetic field was employed with a CP Gaussian laser beam to achieve energy gain of above 100 MeV (Gupta & Ryu, Reference Gupta and Ryu2005; Sharma & Tripathi, Reference Sharma and Tripathi2009). However, we have observed electron energy gain of the order of GeV with the higher mode indices with a CP-HG laser beam in the absence of any external magnetic field.
Variation plots for electron energy gain with peak power of laser pulse for the modes (m,n) = (0, 1) and (0, 4). Rests of the parameters are as referred in Figure 2.

6. CONCLUSION
In this study, we have highlighted the importance of intensity distribution of TEM modes and laser beam width parameter of a CP-HG laser beam on electron acceleration in the plasma. We have noticed an enhanced electron energy gain above 1 GeV for the laser intensity a 0 = 50 (corresponding to I ~ 6.8 × 10²¹ W/cm2) with laser spot size r 0′ = 450(~75 µm) for mode (0, 2). We have observed the role of different modes on the electron energy gain. It is the intensity variation in different TEM modes, which influences the electron energy gain during a laser–electron interaction. Although, the energy gain with higher modes remains high, but the electron de-phased at shorter distance. With an appropriate selection of laser beam spot size, and mode index, the electron can be accelerated upto the order of GeVenergy.



