


Introduction
Interpreting past environmental change from snow, firn and ice-core records depends in large part upon accurate construction of depth/age relationships. Several different physical and chemical techniques (visible stratigraphy, stable isotopes, ion chemistry, H202, electrical conductivity, laser light scattering from dust) have been developed to identify seasonal layering in polar ice sheets (e.g. Reference DansgaardDansgaard, 1964; Reference Murozumi, Chow and PattersonMurozumi and others, 1969; Reference Hammer, Clausen, Dansgaard, Gundestrup, Johnsen and ReehHammer and others, 1978; Reference Herron and LangwayHerron and Langway, 1979; Reference HammerHammer, 1980; Reference Warburton and YoungWarburton and Young, 1981; Reference Mumford and PeelMumford and Peel, 1982; Reference Legrand and DelmasLegrand and Delmas, 1984; Reference Whitlow, Mayewski and DibbWhitlow and others, 1992; Reference Minikin, Wagenbach, Graf and KipfstuhlMinikin and others, 1994). Each of these techniques, used independently, has an associated error (identifying a year where one does not exist, or omitting a year where one does exist), which increases with depth or age (Reference Alley, Saltzman, Cuffey and FitzpatrickAlley and others, 1990). Therefore, combining several of these techniques in a multi-parameter dating approach provides a more accurate means for reconstructing accumulation histories and interpreting chemical variability through time. The advantage of such an approach has been demonstrated in the Greenland Ice Core Project (GRIP) and Greenland Ice Sheet Project II (GISP2) ice-core records, which currently provide the longest, most continuously dated records of annual layer accumulation available (Reference Dahl-Jensen, Johnsen, Hammer, Clausen, Jouzel and PeltierDahl-Jensen and others, 1993; Reference MeeseMeese and others, 1994).
A deep ice-coring project at Siple Dome, West Antarctica (81.65° S, 148.81° W; Fig. 1), intends to produce a new Southern Hemisphere paleoclimatic record similar in length and resolution to the GISP2 and GRIP records. As with the Summit (Greenland) records, a full suite of chemical and physical parameters will be measured on the Siple Dome core which can be used for core-dating, assuming seasonal signals can be identified. Several of these parameters were measured in snow-pit samples collected at Siple Dome during the 1994-95 reconnaissance field season (Reference Mayewski, Twickler and WhitlowMayewski and others, 1995; Reference Raymond, Nereson, Gades, Conway, Jacobel and ScambosRaymond and others, 1995). Here we present chemical, isotopic and stratigraphic results from the upper 2 m of the 1994 snow pits, and evaluate the seasonal signal represented by each parameter. Our goal is to estimate snow-pit annual layer thicknesses based on these parameters, and hence provide information on recent accumulation rates and aid future snow-pit and ice-core interpretations at Siple Dome.
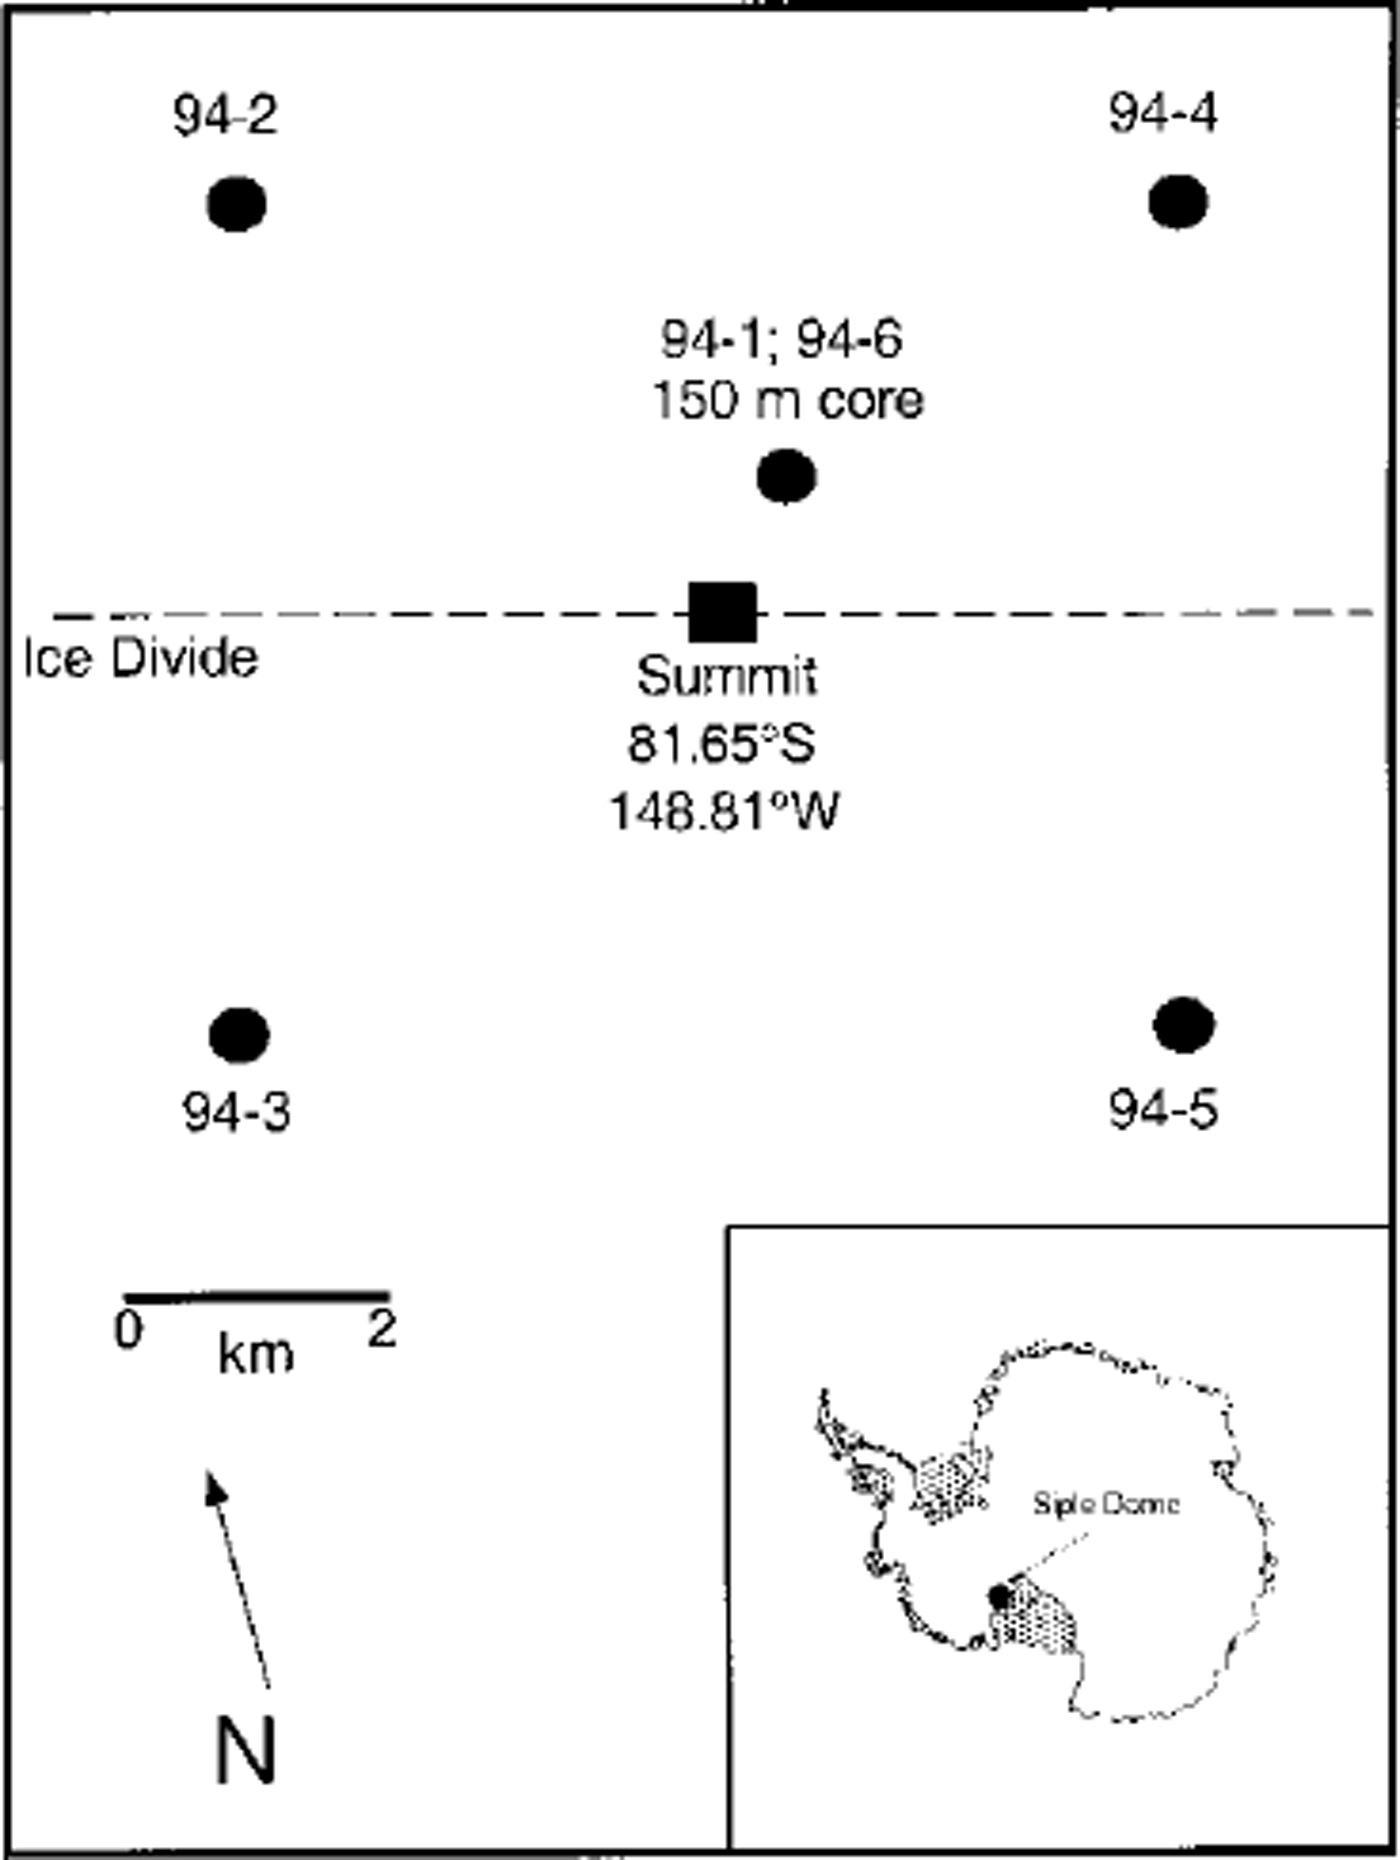
Location map for 1994 Siple Dome snow pits. Pit 94-6 is located -300 m northeast of pit 94 -1, and hence is not represented as a separate point at this scale.
Methods
Six snow pits were sampled at Siple Dome (621ma.s.l. (Reference Raymond, Nereson, Gades, Conway, Jacobel and ScambosRaymond and others, 1995); 25°C 10m temperature (Reference Mayewski, Twickler and WhitlowMayewski and others, 1995)) during the 1994-95 field season (Fig. 1). Four 2m pits (94-2, 94-3, 94-4 and 94-5) are located on the corners of a 10 km2 grid centered on the Siple Dome summit (Reference Raymond, Nereson, Gades, Conway, Jacobel and ScambosRaymond and others, 1995); one 4m deep pit (94-1) is located at the site of a 150m ice core (Reference Kreutz, Mayewski, Meeker, Twickler, Whitlow and PittalwalaKreutz and others, 1997a); and one l m pit (94-6) is located ∼ 300 m northeast of the 1994 drill site (Reference Mayewski, Twickler and WhitlowMayewski and others, 1995). The sampling interval is 2 cm for all pits except pit 94-6, where it is 1 cm. Snow-pit sampling was performed by workers wearing non-particulating suits, polyethylene gloves and particle masks. Samples were collected into pre-cleaned polyethylene containers for frozen shipment and stored below -15°G until melting, immediately prior to chemical analysis. Analysis of major cations (Na+, K+, NH4 + , Mg2 + , Ga2+), anions (Cl, NO3 –, S04 2- ) and methanesulfonate (MSA) in all samples was performed at the University of New Hampshire using Dionex 4000 series instruments. Cations were analyzed via suppressed chromatography with a Dionex GS12 column, 0.125 mL loop and 20 mM MSA eluent. Anions were analyzed with a Dionex ASH column, 0.75mL loop and 6.0mM NaOH eluent. MSA measurements were made with an ASH column, 1.5mL loop and 0.5mM NaOH eluent. Mean ion concentrations for the 1994 pits are given in Reference Kreutz and MayewskiKreutz and Mayewski (1999). Partitioning of sea-salt (ss) and non-sea-salt (nss) fractions is based upon the model described in Reference O’Brien, Mayewski, Meeker, Meese, Twickler and WhitlowO’Brien and others (1995). Snow-pit samples were analyzed for isotopic (SD) composition at the University of Colorado with uncertainties of ±0.5‰ (Reference Vaughn, White, Delmotte, Trolier, Cattani and StievenardVaughn and others, 1998), and are reported in % per mil relative to standard mean ocean water (SMOW). H202 concentration was determined using the peroxidase-based fluorescence method (Reference Sigg, Staffelbach and NeftelSigg and others, 1992) at the University of Arizona. Physical properties measured in the 1994 pits include density, texture, strength and temperature (Reference Raymond, Nereson, Gades, Conway, Jacobel and ScambosRaymond and others, 1995).
Physical Stratigraphy
The use of visible strata in the analysis and dating of snow pits, firn and ice cores is a common glaciological tool, and has been documented on the Siple Coast, West Antarctica (Reference AlleyAlley, 1988; Reference Alley and BentleyAlley and Bentley, 1988). Low-density layers are formed at or near the surface when intense insolation warms snow 1 cm below the surface by as much as 5°C above the ambient air temperature (Reference Alley, Saltzman, Cuffey and FitzpatrickAlley and others, 1990). Vapor diffusion down this steep temperature gradient causes near-surface mass loss accompanied by rapid grain growth, yielding a hoar layer. Subsequent snowfalls that bury a surface hoar layer typically are finer-grained, denser and have a smoother upper surface than the hoar. Hoar layers are rare or absent in winter snow, and therefore their presence provides a method for identifying buried summer layers (Reference AlleyAlley, 1988; Reference ShumanShuman and others, 1998).
Stratigraphic layers (hoar and melt layers) identified in the Siple Dome snowpack are presented in Figure 2. The principal feature of the stratigraphy is the pervasive presence of faceted crystals in the snow and firn. In each pit, there are approximately 8-10 prominent soft layers of very strongly faceted, coarse, poorly bonded grains spread over the 2m sampling. Certain of these low-density layers possess a distinctive appearance, with large, symmetrical grains extending from underlying and overlying strata. One possible explanation for this phenomenon is vapor-gradient reversal during formation, causing transport both to the surface and down to the snowpack. As noted by Reference AlleyAlley (1988) at a nearby location (ridge BC), such low-density layers are generally indicative of summer processes, and therefore allow a first approximation of time-depth relationships in the 1994 snow pits. Variability in hoar-layer thickness and number in each pit, however, makes unambiguous identification of annual layers difficult. Unfortunately, surface observations of the timing, extent, preservation and frequency of hoar formation at Siple Dome are not yet available, and therefore a detailed understanding of hoar formation and preservation is currently lacking. Although the counting of hoar complexes has been shown to be accurate to 1% at century-length timescales in Greenland (Reference Alley, Saltzman, Cuffey and FitzpatrickAlley and others, 1990), we may assume that some years in West Antarctica lack an identifiable hoar event or that other years have two or more events.
Stratigraphic, isotopic and glaciochemical measurements in 2m Siple Dome snow fit samples during 1994. Snow pits are arranged according to geographic position on Siple Dome: pits 94-4 and94-2 are located 5 km north of the east-west-trending Siple Dome ice divide (Reference Raymond, Nereson, Gades, Conway, Jacobel and ScambosRaymond and others, 1995); pit 94-lis -0.7 km north of the ice divide; and pits 94-3 and 94-5 are 5 km south of the ice divide. H202 concentration was not measured in pits 94-4, 94-3 and 94-5, and sample volume did not permit MSA measurement in pit 94-4 and the upper 15 cm of pit 94-5 Hoar layers in stratigraphic profiles are represented by dark bands, and the locations of observed melt layers (2-5 mm thick) are marked(M) to the right of the stratigraphic profiles.
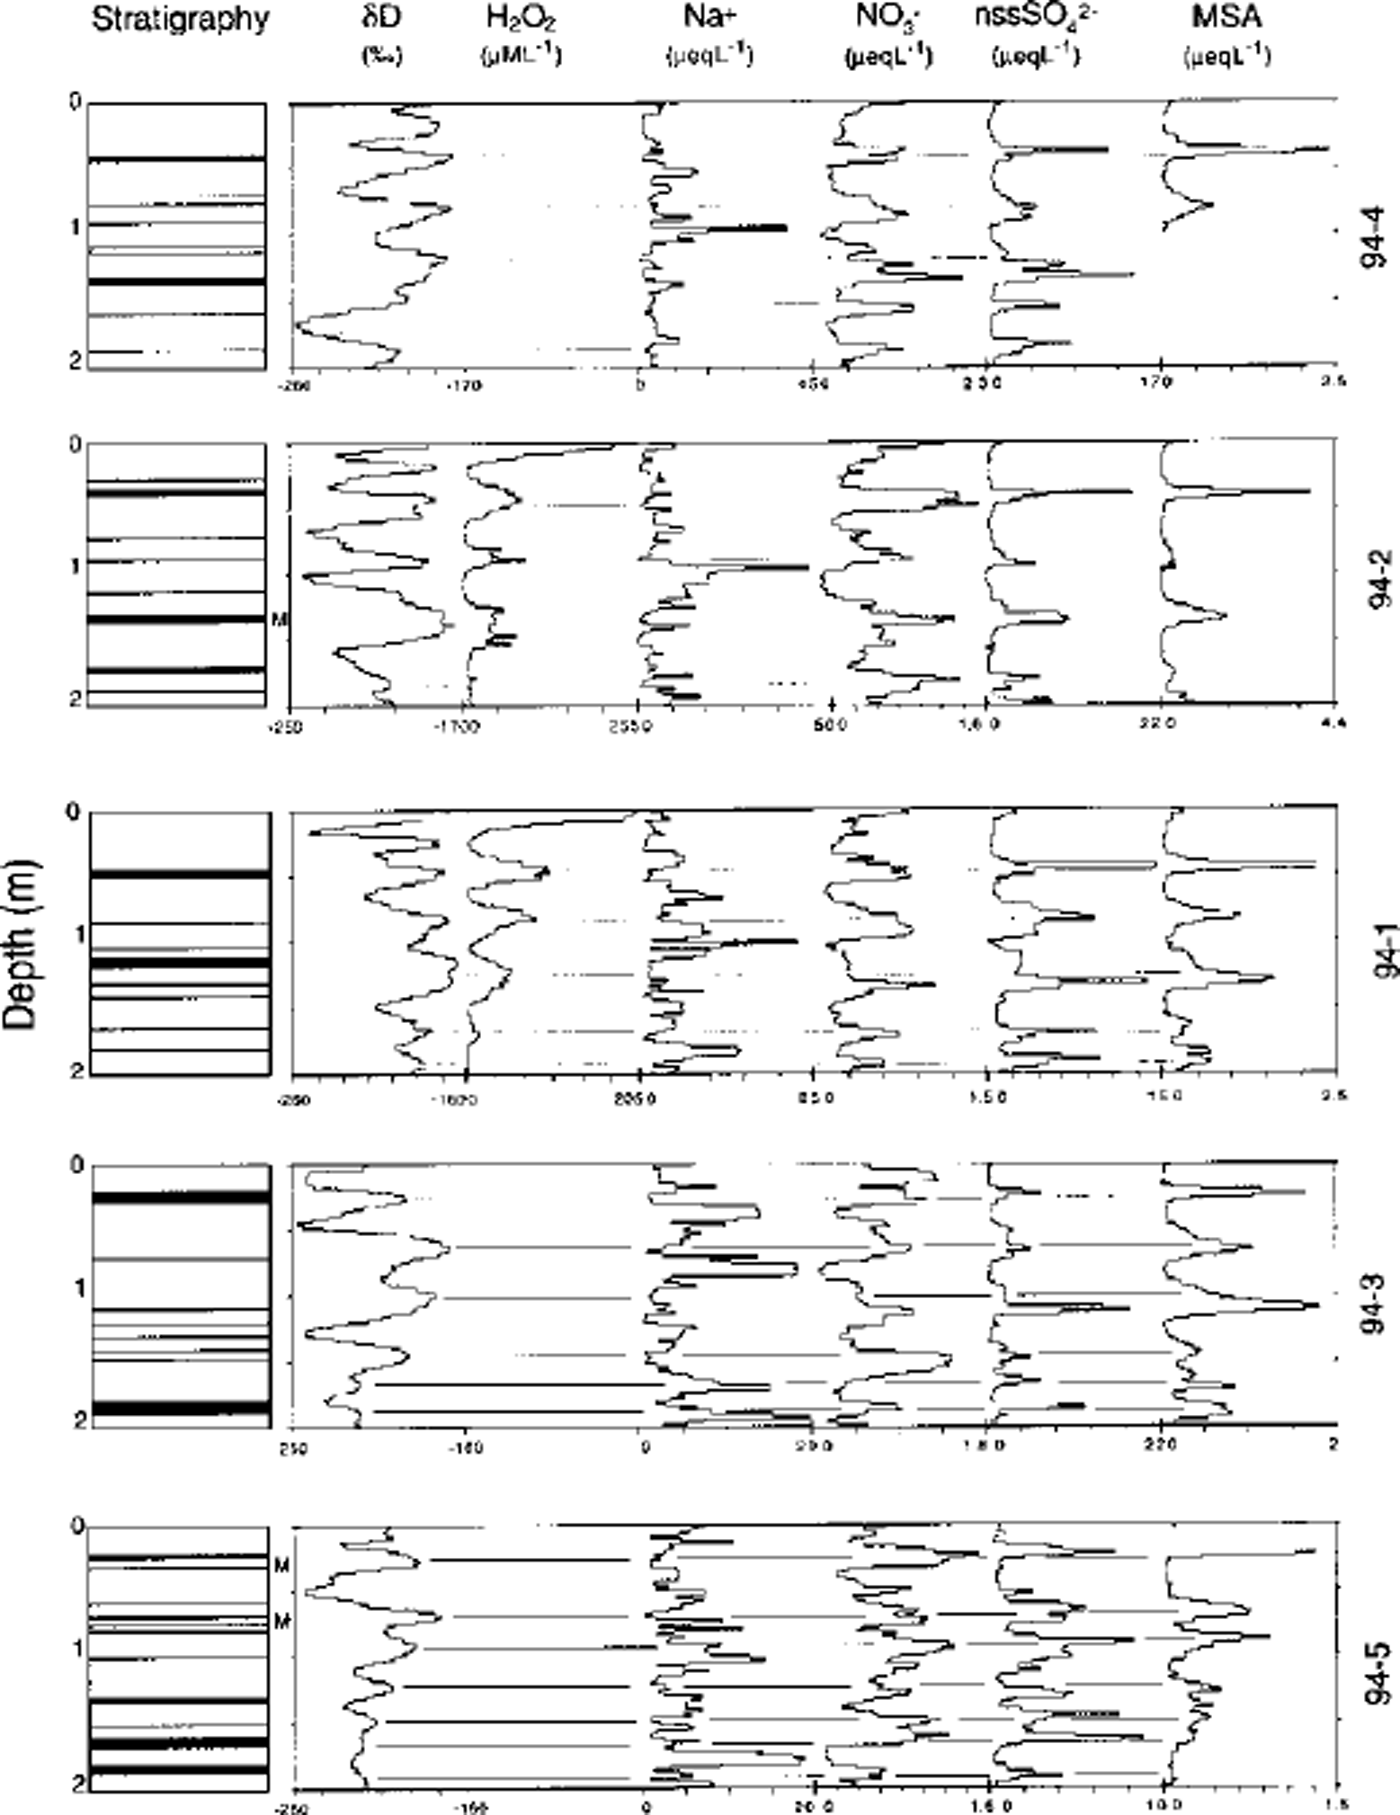
In addition to low-density layers, a small number (3-5 per 2 m pit) of thin (1-2 mm), hard crusts were identified in all pits. The majority of these crusts are not associated with significant depth-hoar layers, suggesting that their formation is not related to summer temperatures. Release of latent heat from katabatic winds descending from the West Antarctic polar plateau may provide sufficiently warm temperatures to produce these crusts. Occasional melt layers (2-5 mm) were also noted, but stratigraphy and temperature profiles indicate that melting is not an important metamorphic and transfer process in comparison to vapor diffusion caused by strong temperature gradients. As discussed below, these apparent melt layers produce no noticeable redistribution of water-soluble constituents in the snowpack.
Stable Isotopes
Like visual stratigraphy, the use of seasonal variations in snow, firn and ice stable-isotope ratios to identify annual layering is an established technique (Reference Hammer, Clausen, Dansgaard, Gundestrup, Johnsen and ReehHammer and others, 1978). Although several factors affect isotopic ratios, numerous studies in polar regions have demonstrated the relationship between increased summer surface temperatures and more positive isotopic ratios (e.g. Reference DansgaardDansgaard, 1964; Reference JouzelJouzel and others, 1997). δD profiles in 1994 Siple Dome snow pits (Fig. 2) display significant (∼100‰) amplitude oscillations, which are assumed to represent winter/summer temperature variability. To investigate SD timing, high-resolution (1cm sampling) measurements from pit 94-6 were compared to satellite-derived passive microwave brightness temperatures (Fig. 3). This technique is based on the theory that the relationship between brightness temperature and physical temperature is a function of the physical temperature of the near-snow surface multiplied by its emissivity (Reference Shuman, Alley, Anandakrishnan, White, Grootes and StearnsShuman and others, 1995).
Comparison of deuterium (δD) ratios in pit 94-6 and brightness temperature derived from Special Sensor Microwave/lmager (SSM/I) data in pit 94-6. The satellite data used are from daily-averaged, 37 GHz, vertical polarization; brightness temperatures are from SSM/I (sensor F11) for the 25 km2 grid covering pit 94-6. Hoar layers (H) identified in pit 94-6 are noted.
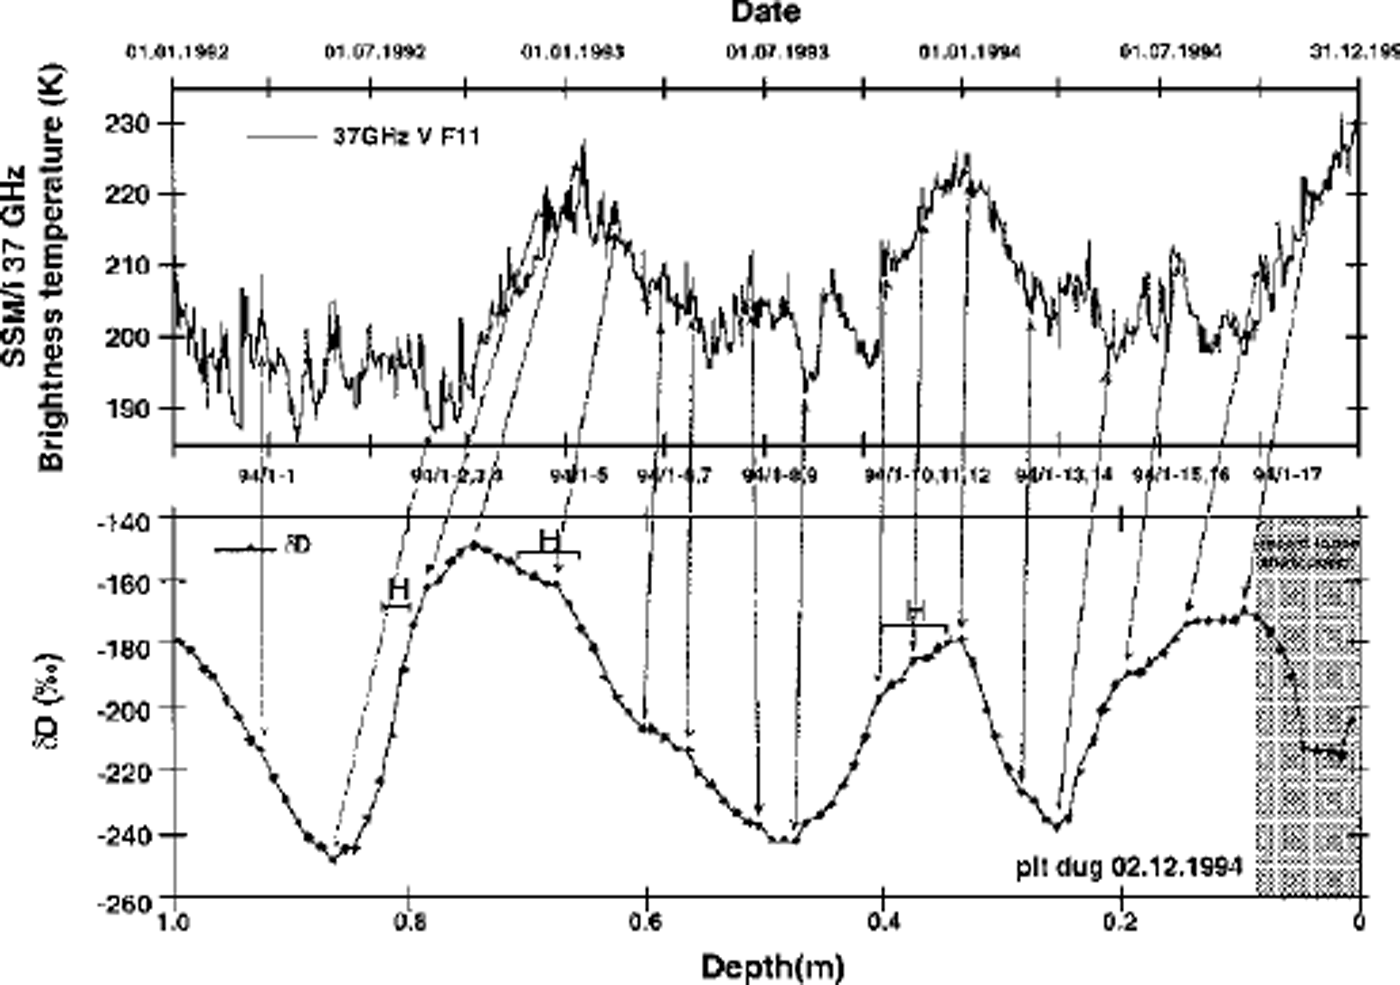
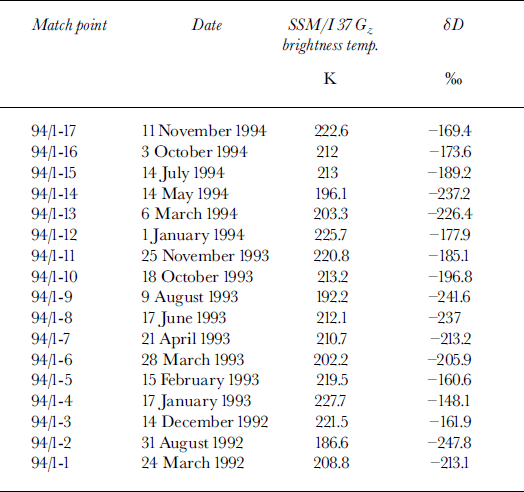
The brightness-temperature record at Siple Dome contains distinct maxima during the 1992-93, 1993-94 and 1994-95 austral summers, and also shows peaks of lesser amplitude during corresponding winter periods (Fig. 3; Table 1). Such winter peaks may be related to intrusion of warm, moisture-laden marine air during periods of intense cyclonic activity, causing increased surface temperatures and reduced emissivity (due to fresh snow deposition). The uppermost isotope peak (∼0.080-0.25 m) corresponds to the onset of summer 1994-95 conditions, based on the sampling date for this snow pit, 94-6 (2 December 1994). Decreased SD in the upper 10 cm is likely related to fresh surface snow present during sampling (pit 94-6 was the last one sampled during the 1994-95 field season, so the -10 cm of fresh snow at the surface is not present in other pit profiles). We match the next obvious SD peak and hoar event (∼0.25-0.45 m) with summer 1993-94. A broad peak in isotope values occurs between 0.6 and 0.85 m, corresponding to summer 1992-93 deposition. Two hoar events are identified in this depth interval, and it therefore appears that grouping these two hoar events together as a summer complex is necessary for correct identification of a specific single summer season. Regardless, these results from pit 94-6 suggest that hoar formation and the SD signal are recording summer intervals. Determining the exact timing of the SD peak preserved in the snowpack is difficult without snow-depth data; however, based on the above results and those of other studies in coastal Antarctic regions (Reference Van Ommen and MorganVan Ommen and Morgan, 1997), SD peaks likely occur within ±4 weeks of 1 January.
Summary of information derived from δD/brightness-temperature comparison
Using the relationships observed between hoar formation and isotopic composition in pit 94-6, we examine the remaining 1994 snow pits for hoar-formation timing (Fig. 2). In all pits, substantial (> 5 cm) hoar layers correspond to summer SD maxima. Hoar events thinner than 5 cm are not always associated with summer layers based on comparison with SD profiles. No relation is noted between SD peak amplitude and hoar thickness. Indeed, predicting a SD profile based on hoar layers alone proves to be difficult, at least in this set of snow pits. Melt layers and thin crusts do not appear to have any definite relationship with SD, as these stratigraphic features occur during both SD maxima and minima.
Hydrogen Peroxide
H2O2 is produced in the atmosphere by photochemical reactions involving hydroxyl radicals, so its atmospheric concentration reflects local atmospheric chemistry and ultraviolet intensity (Reference BeerBeer and others, 1991). H2O2 is a so-called "reversibly deposited species" in snow (Reference Bales, Choi, Wolff and BalesBales and Choi, 1996), and therefore exhibits strong gas-phase exchange and post-depositional signal modification. Surface concentrations in central Greenland and South Pole snow pits exceed those in previously buried summer layers, with losses being greater at the lower-accumulation-rate site (South Pole; Reference Sigg and NeftelSigg and Neftel, 1988; Reference Whitlow, Mayewski and DibbWhitlow and others, 1992; Reference McConnell, Bales, Stewart, Thompson, Albert and RamosMcConnell and others, 1998). Nevertheless, peak H2O2 concentrations in surface snow can provide an important indication of summer layers in the snowpack.
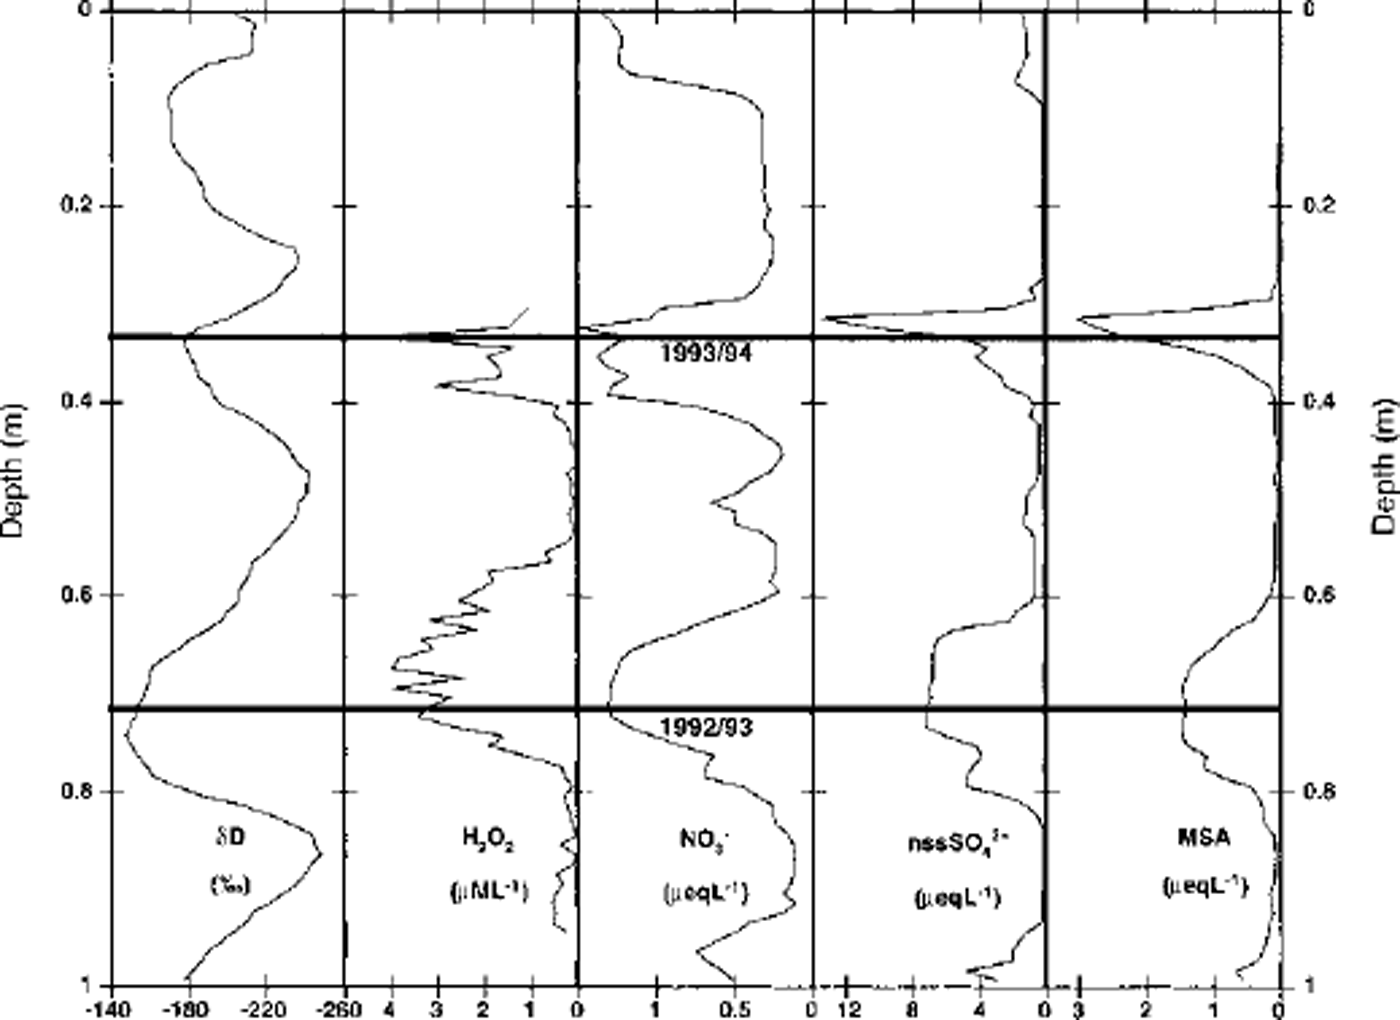
H2O2 concentrations in 1994 Siple Dome snow pits are presented in Figures 2 and 4. Comparison of H2O2 and SD profiles suggests that H2O2 peaks during or slightly after SD maxima. This finding is consistent with physically based modeling results using measured parameters (temperature, accumulation rate) at Siple Dome, which also suggest a late-summer peak for H2O2 (Reference McConnellMcConnell, 1997). Further examination identifies a SD peak in the upper 40 cm of pits 94-1 and 94-2 which does not have an associated H2O2 maximum. As noted below, this apparently anomalous SD maximum also occurs in pit 94-4, based on comparison with major-ion profiles. A possible explanation for this event may be related to two positive excursions in the brightness-temperature record seen during winter (April-October) 1994 (Fig. 3). Such events may indicate intrusion of warm, marine air during intense cyclonic activity, accounting for deposition of isotopically heavy snow. This anomalous SD event appears to be confined to pits on the north side of the Siple Dome ice divide.
Comparison of deuterium (δD), physical stratigraphy, H202 and major-ion concentrations (NO3 –, nssSO4 2– and MSA) inpit 94-6.
Major Ions
On seasonal time-scales, a correlation likely exists between aerosol and snow ion concentrations, enabling ion concentration profiles in snow to be used as a dating tool (e.g. Reference Herron and LangwayHerron and Langway, 1979; Reference Warburton and YoungWarburton and Young, 1981; Reference Mumford and PeelMumford and Peel, 1982; Reference Legrand and DelmasLegrand and Delmas, 1984; Reference Mayewski and LegrandMayewski and Legrand, 1990; Reference Mosley-Thompson, Dai, Thompson, Grootes, Arbogast and PaskievitchMosley-Thompson and others, 1991; Reference Whitlow, Mayewski and DibbWhitlow and others, 1992; Reference Minikin, Wagenbach, Graf and KipfstuhlMinikin and others, 1994). Sulfur species (S04 2- and MSA) dominate the ion content of summer Antarctic aerosol and snowpack, and are primarily of marine origin (oxidation of dimethylsulfide; Reference Wagenbach, Wolff and BalesWagenbach, 1996). Although the sources of nitrogen species (NO3- and NH4 +) in the Antarctic atmosphere are not well understood, NO3 – has been shown to peak during the late-spring/summer season in aerosol measurements (Reference Wagenbach, Gorlach, Moser and MunnichWagenbach and others, 1988; Reference Savoie, Prospero, Larsen and SaltzmanSavoie and others, 1992) and in snow (Reference Mayewski and LegrandMayewski and Legrand, 1990; Reference Whitlow, Mayewski and DibbWhitlow and others, 1992; Reference Dibb and WhitlowDibb and Whitlow, 1996). Sea-salt-derived species (Na+, CF and Mg2+), which dominate the total ion burden of Siple Dome surface snow, generally peak during the winter and spring (July-November) months in coastal and polar-plateau aerosols and snow (Reference Tuncel, Aras and ZollerTuncel and others, 1989; Reference Savoie, Prospero, Larsen and SaltzmanSavoie and others, 1992; Reference Wagenbach, Wolff and BalesWagenbach, 1996). Because this peak occurs when sea-ice extent is at a maximum, increased meridional transport during winter is most likely responsible for the sea-salt maxima (Reference Kreutz, Mayewski, Meeker, Twickler, Whitlow and PittalwalaKreutz and others, 1997a).
Comparison of Siple Dome surface snow major-ion concentrations with isotopic, H2O2 and stratigraphic measurements reveals seasonal signals in several species (Figs 2 and 4). Non-sea-salt S04 2- and MSA profiles display maxima generally coincident with SD and H2O2 peaks. Timing of both nssS04 2- and MSA peaks appears consistent with observations of a peak in Southern Ocean productivity in early/mid-summer (Reference Gibson, Garrick, Burton and McTaggartGibson and others, 1989). A recent comparison of continuous aerosol measurements and firn-core nssSO42- concentrations at South Pole (Reference Bergin, Meyerson, Dibb and MayewskiBergin and others, 1998) demonstrates a consistent summer peak in sulfate aerosol and firn concentration. Therefore, based on observed nssS04 2- profiles at Siple Dome and elsewhere, it appears that nssSO42 - concentrations provide a consistent and accurate method for annual-layer dating, particularly at coastal sites such as Siple Dome. NC3- concentrations at Siple Dome peak are generally in phase with nssS04 2-, δD and H202. The timing of the summer NO3- peak may be related to increased stratosphere/troposphere exchange as the polar stratospheric vortex breaks down with the onset of sunlit conditions (Reference Mayewski and LegrandMayewski and Legrand, 1990; Reference Mulvaney and WolffMulvaney and Wolff, 1993).
Sea-salt concentrations (represented in Figure 2 by Na+) generally peak during winter (indicated by nssSO4 2–, SB and H2O2 minima). Whereas South Pole snow-pit profiles usually show one Na+ peak per year (Reference Whitlow, Mayewski and DibbWhitlow and others, 1992), Siple Dome Na+ profiles contain more than one. This is likely due to the relatively coastal location of Siple Dome and its lower elevation (621m). Thus, sea-salt input is episodic, and depends on synoptic-scale marine cyclogenesis, which occurs throughout the year in the high southern latitudes (Reference HoganHogan, 1997). The majority of sea-salt input, however, likely occurs during winter (August-November), based on atmospheric-aerosol composition data from South Pole (Reference Bodhaine, Deluisi, Harris, Houmere and BaumanBodhaine and others, 1986). Frequent intrusions of marine air were also identified as the cause of significant sea-salt peaks in Ross Ice Shelf snow pits (Reference Warburton and YoungWarburton and Young, 1981). Using sea-salt species as a primary dating tool at Siple Dome is not viable; however, sea-salt profiles can be used to verify winter troughs in other species.
Peaks in the Cl-/Na+ ratio (Fig. 5), which are thought to reflect input of HC1 in the summer from the interaction of H2S04 and long-traveled sea-salt aerosols (Reference Legrand and DelmasLegrand and Delmas, 1988; Reference Whitlow, Mayewski and DibbWhitlow and others, 1992), peak prior to nssSO4 2–. The high sea-salt concentrations at Siple Dome cause the CI"/ Na+ ratio, unlike that at South Pole, to be close to sea-water values (1.5) for the majority of samples, and therefore Cr/Na+ ratios do not appear to be an accurate dating tool.
Comparison of nssSO4 2–, nssCa2+, nss K+ and nssMg2+ concentrations, Cl/Na ratios and. NH4 + concentrations in Pit94-1. Pit 94 -1 is presented here because it is located at the site of a 150 m ice core (Reference Kreutz, Mayewski, Meeker, Twickler, Whitlow and PittalwalaKreutz and others, 1997a). The temporal pattern of variability demonstrated for these species in pit 94-1 is consistent in all other pits.
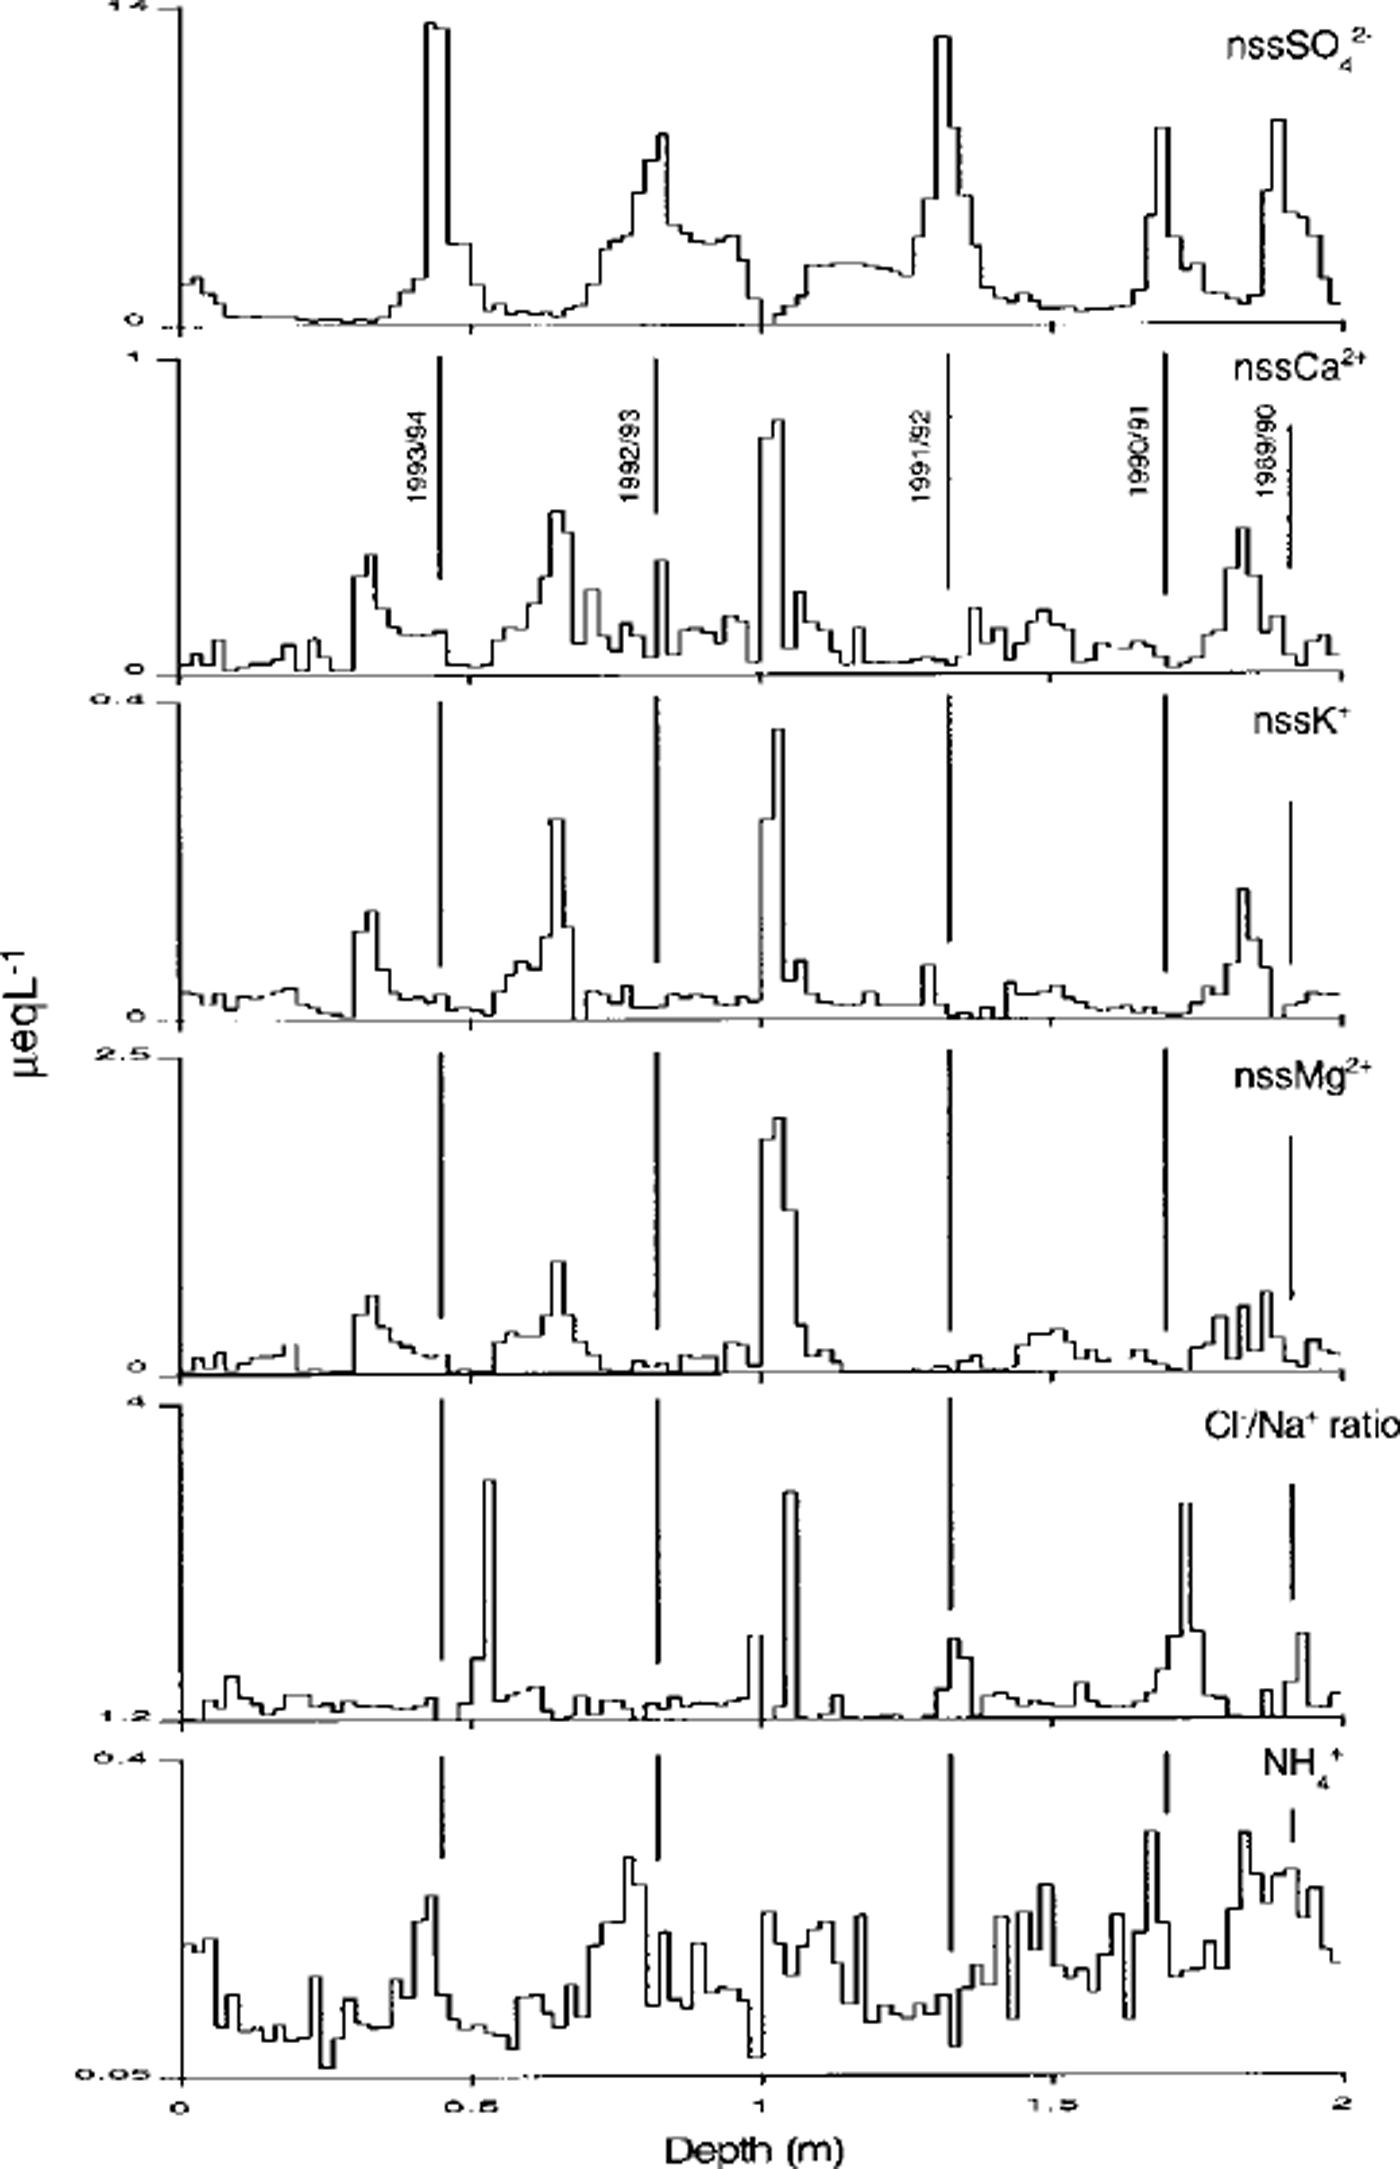
Although NH4 + shows a weak summer maximum in three out of five snow-pit years (Fig. 5), low NH4 + concentrations and potential for contamination preclude using NH4 + as a reliable seasonal indicator at Siple Dome. Non-sea-salt fractions of Ca2+, K+ and Mg2+, which are likely related to longtraveled, continentally derived crustal salts (Reference Whitlow, Mayewski and DibbWhitlow and others, 1992), consistently peak during winter (Fig. 5). Peak concentrations, however, may be due to high sea-salt concentrations and subsequent partitioning artifacts. Therefore, nssCa2+, nssK+ and nssMg2+ concentration profiles are not likely to be an accurate means of identifying annual layers.
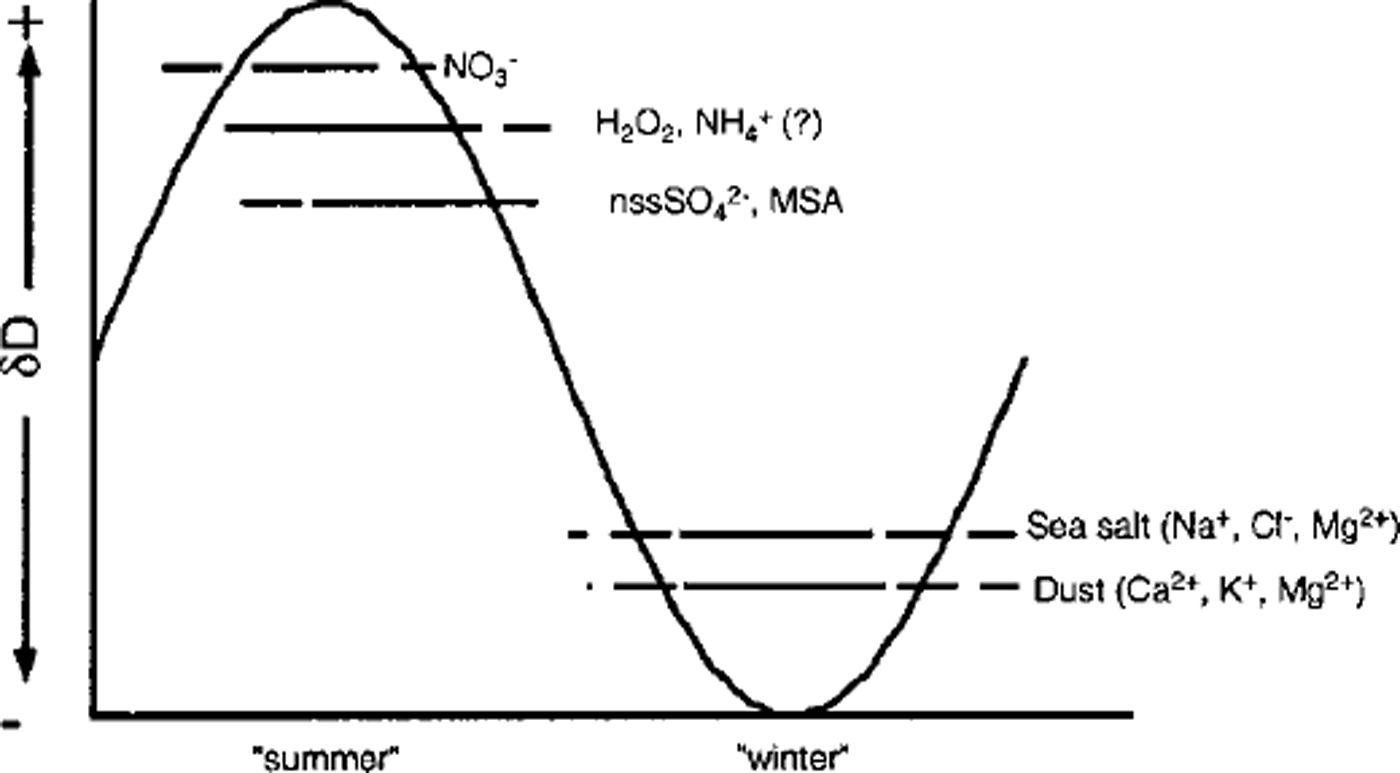
Figure 6 provides a schematic summary of chemical input timing relative to an idealized isotopic profile at Siple Dome. In general, results from these Siple Dome snow pits are consistent with seasonal variations in snow and aerosol chemistry reported from other Antarctic locations (South Pole (Reference Whitlow, Mayewski and DibbWhitlow and others, 1992), G.V. Neumayer (Reference Wagenbach, Gorlach, Moser and MunnichWagenbach and others, 1988), Mawson (Reference Savoie, Prospero, Larsen and SaltzmanSavoie and others, 1992), Berkner Island (Reference WagenbachWagenbach and others, 1994), Ross Ice Shelf (Reference Warburton and YoungWarburton and Young, 1981), Dyer Plateau (Reference Cole-Dai, Thompson and Mosley-ThompsonCole-Dai and others, 1995), Filchner-Ronne Ice Shelf (Reference Minikin, Wagenbach, Graf and KipfstuhlMinikin and others, 1994)), and with seasonal ion variations noted in the 1994 Siple Dome 150 m core (Reference Kreutz, Mayewski, Whitlow and TwicklerKreutz and others, 1998). Of the limited set of parameters investigated here, the most reliable summer indicators in the 1994 Siple Dome snow pits appear to be nssSO 42-, SD, H2O2, MSA and NC3-. Where large hoar layers can be identified, they are also useful, but thin layers do not provide unique annual associations. Sea-salt species peaks can be used to estimate winter deposition, but caution must be used since sea-salt peaks are shown to occur throughout the year on an event basis. Thus, a multiparameter approach is beneficial for accurately dating Siple Dome snow-pit, firn and ice-core records.
Summary of seasonal input timing at Siple Dome, relative to an idealized δD curve (after Reference Whitlow, Mayewski and DibbWhitlow and others, 1992). Solid lines indicate when maximum concentrations frequently occur, and dashed extensions represent the range where peaks are sometimes noted.
Results of Annual-Layer Counting in 1994 Snow Pits
Applying the above dating scheme to the 1994 Siple Dome snow pits results in the mean annual accumulation rates presented in Figure 7. Although it appears that a slight gradient in accumulation rate exists (increasing to the north), the short (5-7 year) snow-pit records and large interannual accumulation variability preclude a statistical difference for all but two pits (94-2 and 94-5). Major-ion profiles from an expanded array of snow pits (±30 km of the divide) on Siple Dome (collected during the 1996-97 season), however, indicate that this gradient is significant in terms of accumulation and ion flux (Reference Kreutz, Mayewski, Twickler, Whitlow and MeekerKreutz and others, 1997b). Such a gradient in accumulation rate is consistent with modeled moisture flux into the Ross Sea/West Antarctic region (Reference Cullather, Bromwich and van WoertCullather and others, 1996) and hence across the roughly east-west-trending Siple Dome ice divide.
Mean annual accumulation-rate estimates from snow pits and a 150 mice core ( denoted as 94-C; Reference Kreutz, Mayewski, Meeker, Twickler, Whitlow and PittalwalaKreutz and others, 1997a) collected at Siple Dome during 1994. Pits 94-1, 94-2 and 94-4 and the 1994 core which are north of the ice divide are to the right, while pits to the south of the divide (94-3 and 94-5) are to the left. Average values represent slightly different time periods, based on the number of years of accumulation present in the upper 2 m at each site (5years (1990-94) for pits 94-2 and 94-4; 6 years (1989-94) for pit 94-3; 7 years (1988-94) for pits 94-1 and 94-5; and 7 years (1988-94) for the core record). Error bars represent ±1 standard error unit.
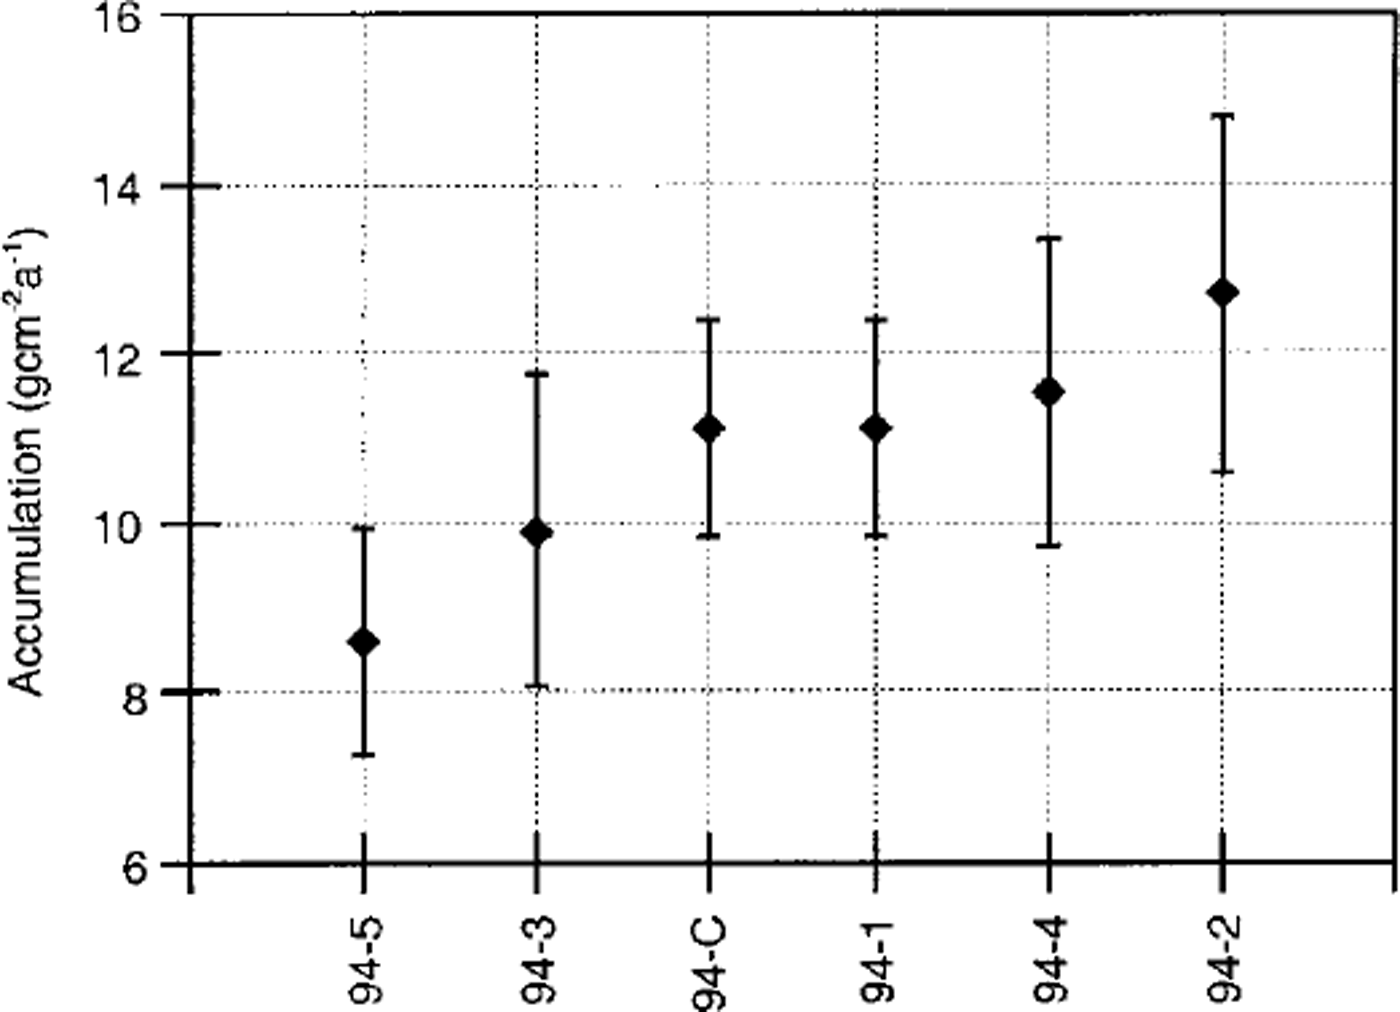
Comparison of accumulation rates in the 1994 snow pits with results from the 150 m core drilled at Siple Dome is also presented in Figure 7 for the 7 year period (1988-94) of overlap. Values for the 1988-94 period in both pit 94-1 and the 1994 core are roughly equal, as would be expected due to the small spatial offset between the two records (∼1 m). Accumulation estimates for 1988-94 from the two drill-site records (11.1 gem"2 a−1) are also similar to the 1150 year mean accumulation (11.9 gcm−2 a−1, density 0.9 gem−3; Reference Kreutz, Mayewski, Meeker, Twickler, Whitlow and PittalwalaKreutz and others, 1997a). Despite the significant interannual and decadal-scale variability present in the core accumulation record, there is no appreciable change prior to the onset of or during the Little Ice Age (Reference Kreutz, Mayewski, Meeker, Twickler, Whitlow and PittalwalaKreutz and others, 1997a). Therefore, the recent accumulation regime at Siple Dome, at least near the flow divide, may be representative of conditions present during the last millennium.
Conclusions
Results presented here, while only in the top 2 m of the Siple Dome snowpack, suggest that seasonal signals in several parameters do exist and will enable construction of an accurate depth/age scale in deeper cores recovered from Siple Dome. Discrete and continuous ion measurements in the 1994 Siple Dome 150 m core (Reference Kreutz, Mayewski, Meeker, Twickler, Whitlow and PittalwalaKreutz and others, 1997a) provide evidence of this, at least for 15% of the Siple Dome ice thickness (Reference Raymond, Nereson, Gades, Conway, Jacobel and ScambosRaymond and others, 1995). Modeling results from Siple Dome suggest that annual layers will reach sub-centimeter thickness at about 600-700 m depth, which is below the predicted depth of the Wisconsin/Holocene transition (-550-650 m; Reference Nereson, Waddington, Raymond and JacobsonNereson and others, 1996). In their study, Reference Nereson, Waddington, Raymond and JacobsonNereson and others (1996) suggest that if annual stratigraphic or chemical signals exist and have been preserved in the ice, they may be resolved throughout the Holocene. Post-depositional processes are known to affect ionic (Reference Steffensen, Clausen, Hammer, Legrand and de AngelisSteffensen and others, 1997; Reference Kreutz, Mayewski, Whitlow and TwicklerKreutz and others, 1998), H2O2 (Reference McConnellMcConnell, 1997) and isotopic (Reference Hammer, Clausen, Dansgaard, Gundestrup, Johnsen and ReehHammer and others, 1978) records at depth in various ice-core records, and therefore interpretation of the various seasonal chemical variations (Kreutz and others, in press) may become more difficult. Despite this, a multi-parameter approach using both chemical and visible-stratigraphic techniques may still be expected to provide accurate dating of a long time-series ice-core record from Siple Dome.
Acknowledgements
We thank colleagues in the field (QYang, A. Gades, R. Jacobel and T. Scambos), the Siple Dome Science Coordination Office (Desert Research Institute, University of Nevada), the Polar Ice Coring Office (University of Nebraska, Lincoln), Antarctic Support Associates, Navy Squadron VXE-6 and the 109th Air National Guard. S. Johnsen and K. Goto-Azuma made helpful comments on the manuscript. Financial support for this project was provided by the U. S. National Science Foundation Office of Polar Programs (OPP 9316564 (UNH),OPP 9420648 (UW)).



