I. INTRODUCTION
Epitaxial growth of thin crystalline silicon films on crystalline silicon (c-Si) has been extensively studied using a variety of techniques.Reference Campbell, Leighton, Case and Knutson1–Reference Kitagawa, Kondo and Matsuda11 The most used techniques to produce epitaxial silicon (epi-Si) films reported are: rapid thermal vapor phase epitaxy, using substrate temperatures (T S) of above 850 °C,Reference Campbell, Leighton, Case and Knutson1 solid phase epitaxy (SPE) using T S of 400 °C,Reference Civale, Nanver and Schellevis2 ion beam epitaxy using T S of above 500 °C,Reference Khan and Frey3 high-vacuum electron cyclotron resonance plasma deposition epitaxy with T S in the range of 450–525 °C,Reference DeBoer, Dalal, Chumanov and Bartels4 ultrahigh vacuum low pressure chemical vapor deposition (UHV-LPCVD) with T S in the range of 700–960 °C,Reference Meyerson, Ganin, Smith and Nguyen5–Reference Zhang, Lloyd, Osman, Bonar, Hamel and Bagnall7 electron cyclotron resonance plasma CVD (ECR-CVD) using T S as low as 285 °CReference Sasaki, Tomoda and Takada8 and plasma-enhanced chemical vapor deposition (PECVD) using T S in the range of 150–700 °C.Reference Kambara, Yagi, Sawayanagi and Yoshida9–Reference Kitagawa, Kondo and Matsuda11
Among the techniques mentioned, PECVD offers several advantages, as the possibility to produce epi-Si films at very low T S (as low as 150 °C), without the requirement of ultrahigh vacuum (UHV) systems. In fact, the base pressures used in PECVD reactors are in the range of 10−6 mbar, which are of above three orders of magnitude higher than those used in UHV systems. Coupled with the above, PECVD has become the standard semiconductor deposition system of choice for large substrate areas (>1 m2) in microelectronics and photovoltaic industries. Even tough high-quality epi-Si films have been produced by PECVD technique using SiH4-H2 mixtures,Reference Kambara, Yagi, Sawayanagi and Yoshida9–Reference Kitagawa, Kondo and Matsuda11 there is no information related to this kind of films produced by SiF4-H2 mixtures. Moreover, the c-Si/epitaxial interface has not been studied systematically.
In previous works,Reference Moreno, Boubekri and Roca i Cabarrocas12–Reference Abramov, Daineka, Djeridane and Roca i Cabarrocas15 we studied fluorine-based microcrystalline silicon films (μc-Si:H:F), and demonstrated that μc-Si:H:F can be deposited with a higher crystalline fraction (and larger grains size) than μc-Si:H films produced from SiH4-H2 gas mixtures. Taking advantage of the above, we have studied a process to produce epi-Si films on (100) crystalline silicon (c-Si) substrates, using optimized μc-Si:H:F deposition conditions. A dry process has been developed to etch the native oxide from a c-Si wafer using a SiF4 plasma in a standard PECVD reactor,Reference Moreno, Labrune and Roca i Cabarrocas16 and immediately without breaking the vacuum, an epi-Si film is grown at low temperature (200 °C) from a H2, SiF4, and Ar gas mixture.
We have performed a systematic study on the effect of H2/SiF4 flow rate ratio on the quality of the epi-Si films and as well on the quality of the interface with the c-Si wafer. We found that by optimizing the H2/SiF4 ratio it is possible not only to produce films with very high crystallinity, but also to control the interface quality ranging from a smooth one to a highly defective interface, mainly composed of hydrogen-rich microcavities. The microcavities formed in the epi-Si/c-Si interface are very similar to those created in the smart cut process.Reference Bruel17–Reference Moriceau, Fournel, Aspar, Bataillou, Beaumont, Morales, Cartier, Pocas, Lagahe, Jalaguier, Soubie, Biasse, Sousbie, Sartori, Michaud, Letertre, Rayssac, Cayrefourcq, Richtarch, Daval, Aulentte, Akatsu, Osternaud, Ghyselen and Mazuré19
II. EXPERIMENTS
The system used for the epi-Si growth is a standard capacitively coupled RF glow discharge PECVD reactor, and the substrates used were <100> FZ n-type double-side-polished c-Si wafers of resistivity 1–5 Ω cm. The processes were performed at substrate temperature of 200 °C.
Without resorting to any particular cleaning process, the c-Si wafers were loaded in the reactor and after a base pressure of 1 × 10⁻⁶ mbar was achieved, the native oxide on the c-Si wafers was removed through an optimized etching process consisting of exposure to a SiF4 plasma for 5 min, with an RF power of 0.1 W/cm2 and pressure of 30 mTorr. Immediately, and without breaking the vacuum, the growth epi-Si film ensued from a condition of SiF4, Ar and H2 gas mixture for 10 min, with a RF power density of 0.5 W/cm2 and pressure of 2.2 Torr. The H2/SiF4 gas ratio was varied from 0.3 to 3.3 (SiF4 = 3 sccm, while H2 = 1–11 sccm), while high Ar dilution (Ar = 80 sccm) was used to increase the SiF4 gas dissociation. It has been shown in our previous studiesReference Djeridane, Abramov and Roca i Cabarrocas14,Reference Abramov, Daineka, Djeridane and Roca i Cabarrocas15 that Ar improves the dissociation on SiF4 and SiH4 plasmas and therefore stimulates the nanocrystals growth, improving the crystalline structure of the films.
Spectroscopic UV-Visible ellipsometry is an excellent tool to characterize the structural composition of thin films such as microcrystalline silicon.Reference Moreno, Boubekri and Roca i Cabarrocas12,Reference Djeridane, Abramov and Roca i Cabarrocas14,Reference Abramov, Daineka, Djeridane and Roca i Cabarrocas15,Reference Roca i Cabarrocas, Hamma, Hadjadj, Bertomeu and Andreu20 An in situ UV-Visible spectroscopic ellipsometer (Jobin Yvon—MWR UVISEL, Palaiseau Cedex, France) was used to measure the imaginary part of the pseudodielectric function [Im(ε)] of epi-Si films deposited on c-Si at different stages of the process. We used this technique to optimize the plasma cleaning conditions and as well the epi-Si film growth. The thickness of the layers and their structural composition was determined by modeling the Im(ε) spectra using the Bruggemann effective medium approximation (BEMA).Reference Djeridane, Abramov and Roca i Cabarrocas14,Reference Abramov, Daineka, Djeridane and Roca i Cabarrocas15,Reference Roca i Cabarrocas, Hamma, Hadjadj, Bertomeu and Andreu20,Reference Irene21
To study the chemical composition of the films, with special attention to the epi-Si/c-Si interface, we performed secondary ion mass spectroscopy (SIMS) analysis on the samples. Fourier transform infrared (FTIR) spectroscopic characterization was also performed to study the chemical bonding.
Aberration-corrected scanning electron microscopy (STEM; model No. JEOL JEM 2200FS, Tachikawa, Tokyo, Japan) was used to analyze the bulk cross section of the epi-Si/c-Si interface. The preparation of the epi-Si films for TEM characterization was done using a focused ion beam (FIB).Reference Giannuzzi, Drown, Brown, Irwin and Stevie22
III. RESULTS AND DISCUSSION
The imaginary part of the pseudodielectric function [Im(ε)] of c-Si in the energy range of 1.5–4.7 eV was measured in situ at different stages: (i) before plasma cleaning, (ii) during native SiO2 removing, and (iii) after the growth of the epi-Si films using different H2/SiF4 flow rate ratios.
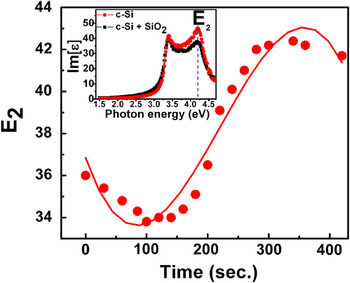
We monitored the value of [Im(ε)] at 4.2 eV, where the E2 peak is located, and whose amplitude is related to the c-Si surface quality and to the presence of native SiO2 on the Si surface.Reference Moreno, Labrune and Roca i Cabarrocas16Figure 1 shows the amplitude of E2 as a function of SiF4 plasma exposure duration on <100> FZ n-type c-Si substrate of resistivity 1–5 Ω cm, at a substrate temperature of 200 °C. In that process we observe that at the beginning of the plasma exposure, the amplitude of E2 decreases, because at this stage the plasma creates roughness as the SiO2 is etched away from the c-Si surface. However, after certain plasma exposure duration, the E2 amplitude increases and reaches a maximum, which is related to the complete removal of SiO2. For longer plasma exposure durations, the E2 peak decreases as a result of the roughening of the c-Si surface induced by the etching of c-Si by the SiF4 plasma. In Fig. 1, it is also observed that the optimal time for etching silicon is 300 s. The inset of Fig. 1 shows the [Im(ε)] for a c-Si wafer with its native oxide and the [Im(ε)] of the same wafer right after the removal of the native oxide by SiF4 plasma. When native oxide is present on the c-Si wafer surface the amplitude of E2 is 37, but it increases to above 43, when the c-Si surface is free of native oxide.
In situ real-time measurements of the evolution of the intensity of E2 peak on a FZ <100> n type c-Si substrate exposed to a SiF4 plasma at 200 °C.

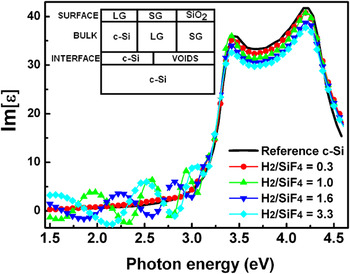
Figure 2 shows the Im(ε) spectra of five selected samples: (i) c-Si wafer after the native SiO2 plasma etching, (ii) epi-Si film growth with H2/SiF4 = 0.3 (H2 = 1 sccm, SiF4 = 3 sccm, Ar = 80 sccm), (iii) epi-Si film growth with H2/SiF4 = 1 (H2 = 3 sccm, SiF4 = 3 sccm, Ar = 80 sccm), (iv) epi-Si film growth with H2/SiF4 = 1.6 (H2 = 5 sccm, SiF4 = 3 sccm, Ar = 80 sccm), and (v) epi-Si film growth with H2/SiF4 = 3.3 (H2 = 10 sccm, SiF4 = 3 sccm, Ar = 80 sccm). The intensity of Im(ε) at 4.2 eV (E2) has a value of E2 ≈ 43. After the deposition of an epi-Si film at low H2/SiF4 flow rate ratio, the Im(ε) spectra has the same shape as that of the bare c-Si wafer, suggesting that the deposited film has the same structural composition and quality of the c-Si wafer [this was corroborated from modeling the Im(ε) spectrum].
Im(ε) spectra of various epitaxial films deposited with H2/SiF4 gas ratios of 0.3, 1, 1.6 and 3.3. As reference is included the Im(ε) spectra of a bare c-Si substrate.

When the H2/SiF4 flow rate ratio is increased up to 1 and 3.3, interference fringes appear in the Im(ε) spectra. These interference fringes, in the energy range from 1.5 to 3 eV, provide information of the formation of microcavities at the epi-Si/c-Si interface. The reduction on Im(ε) at 4.2 eV (E2) from 43 to 38 is an indication of a rougher surface of the epi-Si film.
The inset in Fig. 2 shows the optical model used to fit the ellipsometry data. The BEMA combined with the optical model was used to determine the structure of the epi-Si films in terms of composition, roughness and thickness.Reference Moreno, Boubekri and Roca i Cabarrocas12,Reference Djeridane, Abramov and Roca i Cabarrocas14,Reference Abramov, Daineka, Djeridane and Roca i Cabarrocas15,Reference Hamma and Roca i Cabarrocas23,Reference Jellison, Chisholm and Gorbatkin24 In the optical model used to fit the experimental data we considered the film as a three-layer structure consisting of: (i) an interface layer (ii) a bulk layer, and (iii) a surface roughness layer. Each layer is described as a mixture of crystalline silicon, voids, small grain (SG) and/or large grain (LG) polycrystalline silicon. The structural composition of each layer is described below:
(i) A thin interface layer between the epi-Si film and the c-Si substrate composed of monocrystalline silicon (c-Si) and voids, of thickness in the range of 0–90 Ǻ (depending on the H2/SiF4 flow rate ratio used for deposition).
(ii) A bulk layer composed of monocrystalline silicon (c-Si) and SG. The thickness of this layer depends of the deposition time.
(iii) A surface rough thin layer composed of LGs, SGs and SiO2. The thickness of the surface roughness layer is in the range of 0–50 Ǻ (depending on H2/SiF4 flow rate ratio used). The SiO2 fraction in the surface layer is related to oxidation of the film after the deposition.
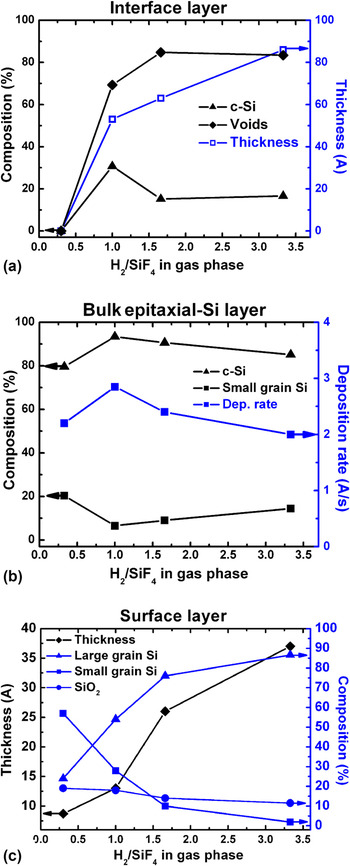
Figure 3 shows the results of modeling the Im(ε) spectra of growth of a series of films with a H2/SiF4 flow rate ratio in the range of 0.3–3.3. Figure 3(a) shows the thickness of the interface layer as a function of H2/SiF4 flow rate ratio. At low H2/SiF4 flow rate ratio (H2/SiF4 = 0.3) the interface is abrupt. However, when the H2/SiF4 flow rate ratio increases, an interface layer appears and reaches a maximum in thickness (∼85 Å) when H2/SiF4 = 3.3. The above behavior may result from a trade off between the hydrogen desorption from the growing film and the velocity of deposition of the material (deposition rate). Moreover, the composition of the interface layer is a strong function of the H2/SiF4 flow rate ratio. For H2/SiF4 ≥ 1, the interface layer is mainly composed of voids (around 80%) and a small amount of c-Si (around 20%).
Results of modeling the Im(ε) of epitaxial silicon films, composed of three layers: (a) interface layer, (b) bulk layer and (c) surface layer.

Figure 3(b) shows the structural composition and deposition rate of the bulk epi-Si layers as a function of the H2/SiF4 flow rate ratio. The bulk layer has a high monocrystalline fraction (c-Si) in the range of 80–95% and a SG fraction in the range of 5–20%. At low H2/SiF4 flow rate ratio (H2/SiF4 = 0.3) the deposition rate is above 2 Ǻ/s, while at larger H2/SiF4 flow rate ratios, the deposition rate increases, up to 3 Ǻ/s (when H2/SiF4 = 1). A further increase in the H2/SiF4 flow rate ratio resulted in a decrease of the deposition rate. Notice that the largest monocrystalline fraction (c-Si ∼ 95%) was obtained for the film deposited at the highest deposition rate, which is possibly related to the fact that at larger deposition rate, oxygen incorporation in the film is reduced [see Fig. 4(b)], and the film crystallinity improved.
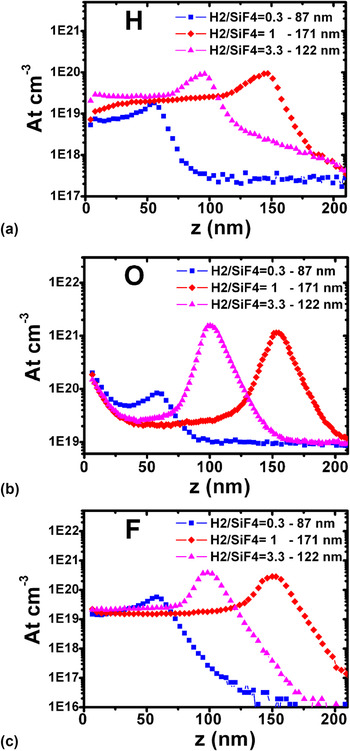
H, O, and F depth profiles measured by SIMS of epitaxial silicon films grown with different H2/SiF4 flow rates.

Figure 3(c) shows the surface roughness of the epitaxial films as a function of the H2/SiF4 flow rate ratio. The roughness of the films increases with the H2/SiF4 flow rate ratio, which is possibly related to an enhanced etching process due to a larger hydrogen flow. Figure 3(c) also shows the structural composition of the surface rough layer. For low H2/SiF4 flow rate ratios, the layer is mainly composed of a SG fraction, while for large flow rate ratios, the layer is mainly composed of a LG fraction. Notice that the SiO2 fraction is almost independent of the H2/SiF4 flow rate ratio.
SIMS analysis was performed on the silicon epitaxial films to study the relationship between the H2/SiF4 flow rate ratios used for the films deposition and the films chemical composition. Figures 4(a)–4(c) show the hydrogen, oxygen and fluorine depth profiles, respectively, of the films deposited with H2/SiF4 flow rate ratios of 0.3, 1, and 3.3.
Figure 4(a) shows that an increment of the H2/SiF4 flow rate ratio results in an increase of hydrogen incorporation into the film, from 7 × 1018 cm−3 for the film deposited with H2/SiF4 = 0.3, to 3 × 1019 cm−3 and 1.5 × 1019 cm−3, for the films deposited with H2/SiF4 = 1 and H2/SiF4 = 3.3, respectively.
On the other hand, Fig. 4(b) shows that an increment of the H2/SiF4 flow rate ratio results on a decrease of oxygen incorporation to the film, from above 4 × 1019 cm−3 for the film deposited with H2/SiF4 = 0.3, to 2 × 1019 cm−3 and above 3 × 1019 cm−3, for the films deposited with H2/SiF4 = 1 and H2/SiF4 = 3.3, respectively.
The above results are in agreement with those deduced by ellipsometry, which suggested that an optimized H2/SiF4 flow rate ratio (H2/SiF4 = 1), resulted on larger deposition rates and as well on larger crystalline fraction of the epitaxial films, due to a lower oxygen incorporation in the films.
Figure 4(c) shows that an increment of the H2/SiF4 flow rate ratio does not have a strong influence on fluorine incorporation into the films, as all the films show similar fluorine atoms densities, of above 2 × 1019 cm−3.
Notice that all epitaxial silicon films were deposited for the same duration (10 min), thus it is clear from Fig. 4 that the thicker film was deposited with H2/SiF4 = 1, with thickness of 171 nm, while the film deposited with H2/SiF4 = 0.3 is 87 nm thick and the film deposited with H2/SiF4 = 3.3, is 122 nm thick. In Fig. 4, it is also observed that there exists a strong accumulation of hydrogen, oxygen and fluorine at the epitaxial film/crystalline substrate interface, with a broader peak in the samples deposited with H2/SiF4 = 1 and H2/SiF4 = 3.3. The above is in agreement with the ellipsometry results, where a thicker interface layer (mainly composed of voids) was observed in the films deposited at H2/SiF4 flow rate ratios of 1–3.3.
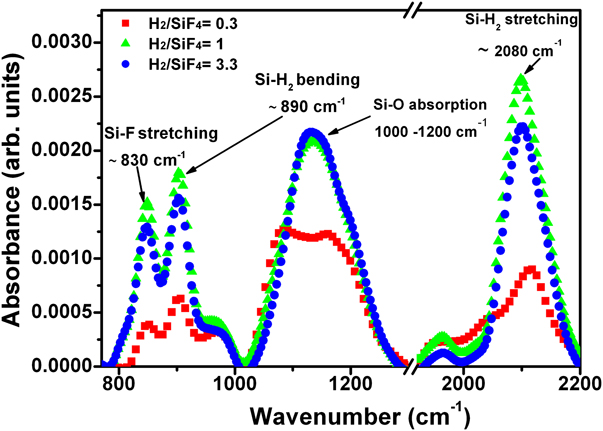
FTIR spectroscopy was used to analyze the hydrogen bonding of silicon in the various epitaxial films. Figure 5 shows the effect of varying the H2/SiF4 flow rate ratio on the films absorbance spectra. We paid special attention to three regions of interest: (i) 800–1000 cm−1, where are present the Si-F stretching modes (∼830 cm−1) and Si-H bending modes (∼890 cm−1), (ii) 1050–1200 cm−1 where are located the Si-O absorption modes, and (iii) 1900–2100 cm−1 where the Si-H stretching modes are present.Reference Langford, Fleet and Nelson25,Reference Langford, Mahan, Fleet and Bender26
FTIR spectra of epitaxial silicon films grown with different H2/SiF4 flow rates.
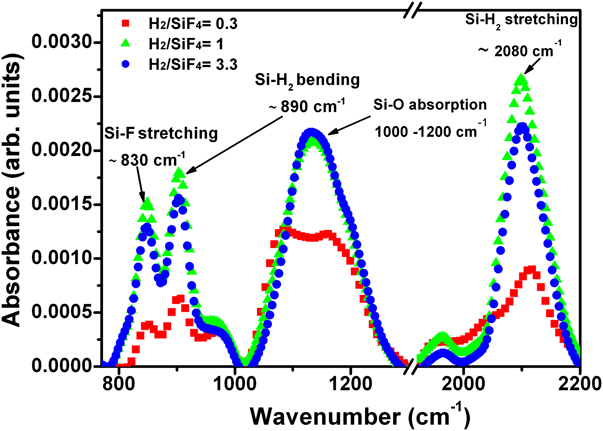
As one can see in the different regions of the FTIR spectra, at low H2/SiF4 flow rate ratio (H2/SiF4 = 0.3) the intensity of the Si–H bending, Si–F stretching, Si–H stretching and Si–O absorbing modes is low, however when the H2/SiF4 flow rate ratio increases (H2/SiF4 = 1–3.3), the intensity also increases. This behavior is in agreement with those results obtained by SIMS, as for large H2/SiF4 flow rate ratios (1–3.3) there is a significantly higher amount of H, O, and F in the film.
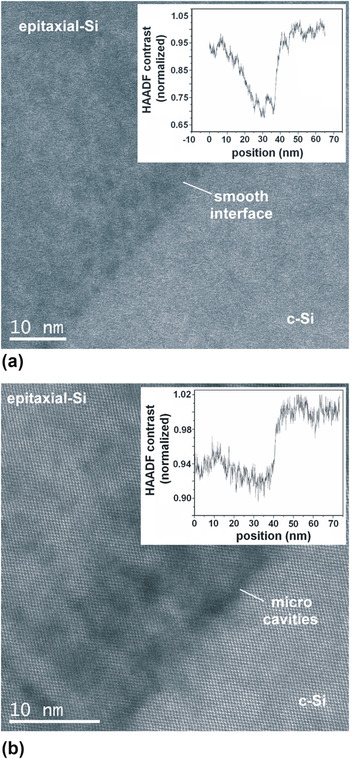
Finally, we used atomically resolved STEM to analyze the c-Si/epitaxial films interface. The selected films were those deposited with low and high H2/SiF4 flow rate ratios (0.3 and 1, respectively). By ellipsometry and SIMS characterization, we observed that low H2/SiF4 ratios resulted on a smooth interface, while large H2/SiF4 ratios resulted on a hydrogen-rich microcavities interface.
Figure 6(a) shows a c-Si/epitaxial film interface deposited with H2/SiF4 = 0.3, while Fig. 6(b) shows a c-Si/epitaxial film interface deposited with H2/SiF4 = 1. As one can see, the interface of the film deposited with a low gas ratio is nearly perfect, while the film deposited with a large gas ratio has large microcavities (black holes) at the interface. As the TEM thin foils are prepared by FIB, their thicknesses are homogeneous. The variations of contrast observed in the high-angle annular dark-field STEM (HAADF-STEM) images are associated with changes of the material density between the c-Si film and the silicon substrate.
HRTEM images of two selected epitaxial silicon films. (a) Smooth Interface. (b) hydrogen-rich microcavities interface. Insets show the HAADF-STEM (high-angle annular dark field) profiles, associated with changes of the material density between the epitaxially grown c-Si film and the silicon substrate.

Therefore the HAADF-STEM profiles of contrast shown in the inset reveal the density deficit at interface in both cases. One can see that the porous interface results in a density deficit of about 30% over a thickness of 20 nm, while for the abrupt interface the density deficit is constant in the epitaxial film as compared with the crystalline silicon wafer.
The above results are consistent with those obtained by ellipsometry, SIMS and FTIR, and demonstrate that UV/Vis ellipsometry is a very powerful technique to study not only thin films compositions in terms of crystallinity, but the quality of the film interface with the substrate. Moreover our results demonstrate that we can grow epitaxial films at low substrate temperature (∼200 °C) in a standard RF glow discharge reactor and a tuning of the H2/SiF4 flow rate ratio allows to produce films with a thin (9 nm) and highly porous interface layer (∼80% of microcavities), which is very similar to the hydrogen-rich layer produced by ion implantation in the SmartCut process.
IV. CONCLUSIONS
Epitaxial silicon films have been deposited on <100> c-Si wafers at low substrate temperature (200 °C) using a dry process to etch the native SiO2, and without breaking the vacuum, the films have been grown from SiF4/H2/Ar mixtures. We observed that by optimizing the H2/SiF4 flow rate ratio, it is possible to deposit epitaxial silicon films with c-Si fraction as high as 95% and having an interface layer of thickness up to 90 Ǻ, mainly composed of hydrogen-rich microcavities (∼80%). Finally, it is important to point out that UV-Vis spectroscopic ellipsometry is a powerful tool to characterize not only the crystallinity composition of the epitaxial silicon films, but also the quality/composition of the film interface with the substrate.
ACKNOWLEDGMENT
The authors thank D. Troadec from IEMN for FIB samples preparation.