1. Introduction
‘Individual behavior change when taken up by billions of people makes a decisive difference’ (Williamson et al., Reference Williamson, Satre-Meloy, Velasco and Green2018: 5) to solve environmental threats, climate change in the first place. Newspapers, think tanks and international institutions suggest ‘practical steps you can take to help avoid climate breakdown’ (Taylor and Vaughan, Reference Taylor and Vaughan2018), ‘simple ways to act on climate change’ (Arguedas Ortiz, Reference Arguedas Ortiz2018) because ‘when it comes to fighting climate change, citizen action matters’ (Global Environment Facility, 2016) and ‘lifestyle choices lowering energy demand and the land (…) can further support achievement’ to limit global warming to 1.5°C (Rogelj et al., Reference Rogelj, Shindell, Jiang, Fifita, Forster, Ginzburg, Handa, Kheshgi, Kobayashi, Kriegler, Mundaca, Séférian, Vilariño and Masson-Delmotte2018: 97). At the same time, there is a consensus on the need to build resilience to climate change. Even Trump's administration, though denying climate change, recognises the role of ‘response capabilities’, ‘preparedness’ and ‘resilience’ (Green, Reference Green2017; Siciliano, Reference Siciliano2017; and Environmental Data & Governance Initiative at https://envirodatagov.org/). But how risky is entrusting individual behavior change and resilient solutions with protection from environmental problems? Without claiming to be exhaustive, we contribute to the response to this ambitious question by means of a purely theoretical approach. To this purpose, this article analyzes a dynamic model with environmental degradation, defensive strategies and environmental externalities with a focus on the role of maladaptation. Then, it discusses the main motivations and the assumptions used throughout the work.
Most production and consumption processes create pollution, environmental impact and stresses on natural resources. Individuals can address wellbeing costs due to these problems through adaptation and/or mitigation. To a large extent, defensive expenditures and adaptation, namely adjustments to actual or expected impacts produced by environmental threats, are direct and individual solutions. In addition, defensive expenses usually offer immediate protection against environmental damage but they do not tackle its causes. In several cases, adaptation may even cause a negative feedback effect that, in turn, increases environmental degradation. Shogren and Crocker (Reference Shogren and Crocker1991) referred to these strategies as self-protection that transfers the externalities to other agents compared to self-protection that filters or dilutes them. More recently, within the debate on climate change, Adejuwon et al. (Reference Adejuwon, Azar, Baethgen, Hope, Moss, Leary, Richels and van Ypersele2001) and Barnett and O'Neill (Reference Barnett and O'Neill2010) define them as maladaptation.Footnote 1 A clear example of maladaptation is represented by the increase in electricity needs for air conditioning in response to heat waves and global warming, which has been documented by several studies (see, e.g., Auffhammer and Aroonruengsawat, Reference Auffhammer and Aroonruengsawat2011; Deschênes and Greenstone, Reference Deschênes and Greenstone2011; Davis and Gertler, Reference Davis and Gertler2015). Another illustrative example is provided by a recent study on private defensive expenditures against exposure to outdoor air pollution in China (Sun et al., Reference Sun, Kahn and Zheng2017). In that work, the authors find that individuals respond to severe pollution alerts by buying air filters and masks.
Other adaptation initiatives that can require a large amount of energy and cause additional GHG emissions or environmental stress are also snow making (Abegg et al., Reference Abegg, Agrawala, Crick, Montfalcon and Shardul2007), desalination, cross-basin water transfer projects (Barnett and O'Neill, Reference Barnett and O'Neill2010) or water efficiency schemes based on pumping (Beilin et al., Reference Beilin, Sysak and Hill2012). In some coastal villages in Bangladesh, for instance, the combined effect of climate change (sea level rise and storm surges) and of infrastructural and water diversion projects has increased saltwater intrusion, floods and waterlogging. Local farmers, especially the better off, have reacted to these environmental changes by converting crop plots in shrimp ponds. However, shrimp farming has exacerbated and created additional environmental impacts such as salinization and mangrove degradation (Pouliotte et al., Reference Pouliotte, Smit and Westerhoff2009).
The other response to environmental changes is mitigation. Mitigation strategies aim to prevent or limit pollution and harmful environmental changes. As most environmental problems result from the combined impact of multiple sources, the effectiveness of mitigation depends on agents' coordinated choices. In other words, mitigation is a ‘collective’, possibly indirect and uncertain solution. Coordination and expectations are essential ingredients of mitigation solutions which comprise reduction of either the scale of output or its pollution intensity. Although individuals have direct control over output and consumption, policy action – albeit theoretically possible at all levels – relies more on measures for reducing pollution intensity.
Against this background, we model adaptation and mitigation choices caused by (production-induced) environmental externalities in a general equilibrium overlapping generations (OLG) economy inhabited by a continuum of perfectly rational and identical individuals who live for two periods: youth and old age. These individuals consume only in the second period of life and partly use this consumption to defend themselves against the damages arising from environmental degradation (defensive consumption, in the sense of Hirsch, Reference Hirsch1976). More specifically, only the difference between available output and defensive consumption (net consumption) enters their utility function as an argument. The representative individual of generation t chooses material consumption and labor supply in order to maximize the value of his utility function. Labor is offered to a population of perfectly competitive firms producing a homogeneous good.
The first order conditions at the individual level together with the market equilibrium conditions and the environmental damage dynamics give rise to a discrete-time dynamic system in three variables, ℓt, K t, and D t, measuring respectively the labor input, physical capital and environmental degradation at time t. The variables K t and D t are state variables; their initial values K 0 and D 0 are pre-determined by ‘history’ (Krugman, Reference Krugman1991). In contrast, the initial value ℓ0 of the labor supply ℓt is chosen by the representative individual in order to maximize his lifetime utility. Therefore, ℓt is a jump variable and its initial value is chosen by considering the expectations about the future evolution of the state variables. In this context, a reduction in the labor supply, which lowers output and environmental damage, results in a mitigation effect, whereas a rise in the labor supply, allowing higher defensive expenditures in the second period of life, causes an adaptation effect. Maladaptation originates from continuing to produce without any change in production technique (and its environmental impact) but simply diverting a part of income to repair the damages generated by environmental degradation. This behavior leads to an increased vulnerability over larger spatiotemporal scales.
The analysis of the model shows that the initial value of the choice variable ℓt may not be uniquely determined, given the initial values of the pre-determined variables K t and D t, so that phenomena of global indeterminacy may arise. Global indeterminacy is an important result as the economy may converge towards different stationary states (or, more generally, different ω-limit sets such as cycles, closed invariant curves or chaotic sets) depending on the choice of the initial value ℓ0 and given the initial conditions K 0 and D 0. Indeed, different initial choices of the non-predetermined variable ℓt may imply different long-term behaviors and individual wellbeing. In such a context, there may exist coordination failures and the negative effects due to the subsequent self-feeding adoption process of maladaptive choices. Finally, results show that the likelihood of indeterminacy increases as the pollution intensity of output grows. This implicitly suggests that environmental policies promoting green production techniques and processes may help reduce coordination failures in agents' mitigation and adaptation choices.
Although some existing works on indeterminacy focus on global dynamics and pinpoint the importance of the global analysis (see, amongst others, Christiano and Harrison, Reference Christiano and Harrison1999; Pintus et al., Reference Pintus, Sands and de Vilder2000; Raurich-Puigdevall, Reference Raurich-Puigdevall2000; Benhabib and Eusepi, Reference Benhabib and Eusepi2005; Karp and Paul, Reference Karp and Paul2007; Pérez and Ruiz, Reference Pérez and Ruiz2007; Benhabib et al., Reference Benhabib, Nishimura and Shigoka2008; Coury and Wen, Reference Coury and Wen2009; Mattana et al., Reference Mattana, Nishimura and Shigoka2009; Brito and Venditti, Reference Brito and Venditti2010; Antoci et al., Reference Antoci, Galeotti and Russu2011; Antoci et al., Reference Antoci, Gori and Sodini2016; Bella et al., Reference Bella, Mattana and Venturi2017) especially for policy purposes, the related literature is almost exclusively based on local analysis. This is because dynamic models that exhibit indeterminacy are often highly nonlinear and difficult to be handled analytically from a global perspective.
A fortiori, a very small number of articles deal with the issue of global indeterminacy in environmental dynamics. In this regard, Karp and Paul (Reference Karp and Paul2007) study a (two-dimensional) dynamic model of labor migration and environmental change in a two-sector economy, where both sectors generate pollution but only one of them is affected. Pérez and Ruiz (Reference Pérez and Ruiz2007) find that global indeterminacy can occur in a two-dimensional endogenous growth model with pollution and public abatement activities. Antoci et al. (Reference Antoci, Gori and Sodini2016), in an OLG context, discuss the implications for global indeterminacy and chaos of complementarity or substitutability between private goods and free-access environmental goods when environmental quality directly affects agents' utility. Antoci et al. (Reference Antoci, Galeotti and Russu2011) prove the existence of global indeterminacy and poverty traps in a growth model where open-access natural resources are used as productive input.Footnote 2 The present article makes a further contribution to this literature by showing that mitigation and adaptation choices – conditioned by the interplay amongst environmental degradation, production and consumption – can represent an additional source of indeterminacy.
The rest of the article proceeds as follows. Section 2 sets up the model and characterizes the dynamic system generated by individual choices. Sections 3 and 4 deal with local and global indeterminacy, respectively, reporting and discussing the main results. Section 5 outlines the conclusions of the work.
2. The model
Consider an OLG general equilibrium (macro)economy closed to international trade and inhabited by identical competitive firms and finite-lived rational and identical individuals (consumers/workers) of size 1 per generation. The assumption of identical agents allows us to refer to the choices of the representative individual and the representative firm throughout the article. The life of the representative individual is divided into youth (working period) and old age (retirement period). The members of generation t (t = 1, 2, … + ∞ is the time index) overlap for one period (youth) with the old members of generation t−1 and for one period (old age) with the young members of generation t + 1. When young, the individual is endowed with 1 unit of time and chooses how to allocate time endowment between labor (ℓt ∈ (0, 1)) and leisure (1 − ℓt) activities. The labor supply is offered to the competitive representative firm in exchange for wage w t per unit of labor. The (total) labor income w tℓt received during the working period is entirely saved (s t) for old-aged consumption purposes (C t+1). This assumption is usual in the related literature since the work of Reichlin (Reference Reichlin1986) and Galor and Weil (Reference Galor and Weil1996). Therefore, the budget constraint when young is:

When old, the individual retires and his accumulated wealth W t+1 is:

where $R_{t + 1}^{e}$ is the interest factor that an individual of generation t expects will prevail from time t to time t + 1 (it will become the realised interest factor at the beginning of period t + 1). In this model, W t+1 represents the potential consumption that could be achieved in the absence of any environmental damages (Weitzman, Reference Weitzman2010) and it is given by the overall amount of resources available to an individual during his retirement period. We assume that W t+1 is reduced by environmental degradation D t+1, and consumption C t+1 is determined by the constraint:

where the parameter β ≥ 0 weights the importance of environmental degradation in the utility function. The term βD t+1 can be interpreted as a damage function measuring the amount of wealth W t+1 that must be used to repair the damages caused by environmental degradation D t+1. So, the (net) wealth available for consumption purposes is given by W t+1 − βD t+1.Footnote 3
The individual representative of generation t has preferences towards leisure when young and material consumption when old, and his lifetime utility function takes the following form:

where 0 < θ < 1 is the subjective discount factor. The value of D t+1 does not enter the utility function directly, but rather affects the need for the individual to increase his labor effort (and, consequently, the accumulation of wealth W t+1) to keep the net wealth (i.e., consumption) W t+1 − βD t+1 unaltered.
Substituting out the expression of the lifetime budget constraint in (3) into the lifetime utility function (4) gives $U_{t}=\ln (1-\ell _{t})+\theta \ln (R_{t+1}^{e}w_{t}\ell _{t}-\beta D_{t+1})$ so that the individual optimization problem can be reduced to:

We assume that the representative individual has perfect foresight about the value of D t+1 but takes it as exogenously given. The first order condition for an interior solution reads as follows:

Equation (6) implies that an additional increase in the time spent working increases the marginal disutility of labor that should equate the (indirect) marginal utility of consumption coming from the resulting additional increase in net wealth to keep utility unchanged.
The representative firm produces a homogeneous good by means of the amount of labor available at time t (L t) and the amount of saving rent by the representative individual to the firm at time t, which is invested in productive capital that will be installed one period later (K t+1). Production takes place with a standard Cobb-Douglas technology mixing capital and labor inputs in the following way:

where Y t is the output produced, A>0 is a production scaling parameter and 0 < α < 1 represents the elasticity of the production function with respect to the capital input. By assuming that the capital stock fully depreciates at the end of every period and output is sold at unit price, the maximization of profits $\Pi _{t}=AK_{t}^{\alpha }L_{t}^{1-\alpha }-R_{t}K_{t}-w_{t}L_{t}$ with respect to K t and L t implies that capital and labor are remunerated at their marginal products, respectively. Knowing that the temporary equilibrium condition in the labor market implies that labor demand equals labor supply, that is L t = ℓt, marginal products of capital and labor can respectively be written in the following way:

and

The environmental damage at time t + 1 is determined by the following linear rule:

where 0 < γ ≤ 1 is the rate at which the damage decays over time, 1 − γ represents the degree of persistence of the damage in the environment and δ ≥ 0 weights the damage due to the economy-wide average production at time t ($\overline {Y}_{t}$ ). The lower (resp. higher) δ is, the more the technology is clean (resp. dirty).
The capital stock installed at time t + 1 equals aggregate investments by the representative firm, I t, at time t, K t+1 = I t, which in turn are equal to aggregate savings by the representative individual s t. By recalling that the capital stock fully depreciates at the end of each period, the market-clearing condition in the capital market is given by K t+1 = s t = w tℓt. Knowing that individuals have perfect foresight, so that $R_{t+1}^{e}=R_{t+1}=\alpha AK_{t+1}^{\alpha -1}\ell _{t+1}^{1-\alpha }$ , $\overline {Y}_{t}=Y_{t}$
 (i.e., the economy-wide average output coincides, ex post, with the output of the representative firm) and using (6)–(10) one gets the following equations characterizing equilibrium dynamics of the economy:


and

The system formed by (11), (12) and (13) defines a three-dimensional map (M) characterising K t+1 as a function of K t and ℓt, and ℓt+1 and D t+1 as functions of K t, ℓt and D t. Therefore,

where

3. The stationary state
The three equations in M allow us to compute the unique stationary-state solution of the system (K*, ℓ*, D*):


where the inequality αγ − βδ > 0 must hold to guarantee the positivity of all the variables of the model evaluated at the stationary state. In addition, the stationary-state solution of material consumption is the following:

Notice that if either β (the impact of environmental degradation on wealth) or δ (the impact of the economy-wide average production on environmental degradation) increases, then (ceteris paribus) labor input ℓ*, capital accumulation K* and environmental degradation D* increase. The opposite holds if the rate at which the damage decays over time, γ, increases. According to these results, we have that an increase in either β or δ, or a reduction in γ, induces individuals to work harder to counterbalance the increase in the damages caused by environmental degradation. This also explains, as we will show in the following sections, how the economy can follow an endogenous and self-fueling path characterized by growing defensive expenditures, environmental degradation, production growth, and wellbeing reduction.
Now, substituting out the stationary-state values (K*, ℓ*, D*) in (4), we get the stationary-state value of the lifetime utility function:

where J: = (αγ − βδ)/(αγ(1 + θ) − βδ) > 0 and, computing the partial derivatives of U ss with respect to β, δ, and γ, we get:


This implies that an increase in the stationary-state values of labor supply ℓ*, capital accumulation K*, and environmental degradation D* due to an increase in either β or δ, or a reduction in γ, generates a reduction in the utility index evaluated at the stationary state.
Regarding the stability properties of the stationary state, (K*, ℓ*, D*) may be saddle-point stable, locally asymptotically stable or unstable. These cases occur when the Jacobian matrix evaluated at (K*, ℓ*, D*) has, respectively, two stable eigenvalues (i.e., inside the unit circle), three stable eigenvalues or less than one stable eigenvalue.
3.1. Saddle-point stable stationary state (local determinacy)
When the stationary state (K*, ℓ*, D*) is saddle-point stable, then given an initial condition of the state variables K and D possibly close enough to (K*, D*) (history), there exists a unique initial value of the control variable ℓ allowing the economy to lie on the unique trajectory converging towards the stationary state. In this context, the initial values of K and D allow us to predict the whole path converging towards the stationary state. Although neoclassical economic theory considers this almost as if it were the only possible outcome of dynamic models with perfect foresight, this is far from being the sole scenario (as we will see later in this article).
3.2. Locally asymptotically stable stationary state (local indeterminacy)
When the stationary state is locally asymptotically stable, there exists a multiplicity of trajectories converging towards (K*, ℓ*, D*), given an initial condition of the state variables (K, D) possibly close enough to (K*, D*). An interesting consequence of this outcome is that – once one has chosen the initial value of the control variable ℓ – the stationary state can be achieved through trajectories showing different economic performances and degrees of environmental degradation. An important role in the choice of the initial value of control variable is played by the expectations that agents have regarding the evolution of K and D (different expectations define different trajectories). This scenario is defined by the term local indeterminacy (Grandmont et al., Reference Grandmont, Pintus and de Vilder1998).
The stationary-state (K*, ℓ*, D*) may also not be attainable because all or ‘almost all’ trajectories diverge from it, and then converge towards other long-term scenarios. From a mathematical point of view, this case is observed when two or three eigenvalues are outside the unit circle.
It is easy to check that if either β = 0 or δ = 0, then the stationary state (K*, ℓ*, D*) is always saddle-point stable, and therefore it is locally determinate.Footnote 4 For β > 0 and δ > 0, the local stability properties of the stationary state (K*, ℓ*, D*) can be studied by accounting for the following local stability conditions (local indeterminacy):

where a 1, a 2 and a 3 are, respectively, the coefficients related to the first-, second- and third-degree terms of the characteristic polynomial of the Jacobian matrix evaluated at the stationary-state. As the conditions in (21) cannot be dealt with in a neat analytical form, we will use numerical simulations in order to highlight some of the scenarios discussed above. Figure 1 shows, in the (β, δ)-plane, the determinacy/indeterminacy regions. The light-grey area identifies the parametric region where the stationary-state equilibrium is determinate, whereas the dark-grey area represents the region where local indeterminacy arises. The red line at the top of the dark-grey area identifies the boundary under which the stationary state exists (that is, αγ − βδ = 0). According to figure 1, an increase either in β or in δ may give rise to a local indeterminacy scenario, under which the transition dynamics towards (K*, ℓ*, D*) depends on the initial choice of the control variable.
Determinacy/indeterminacy in the (β, δ)-plane. Parameter set: A = 10.6, α = 0.3, γ = 0.64 and θ = 0.2.

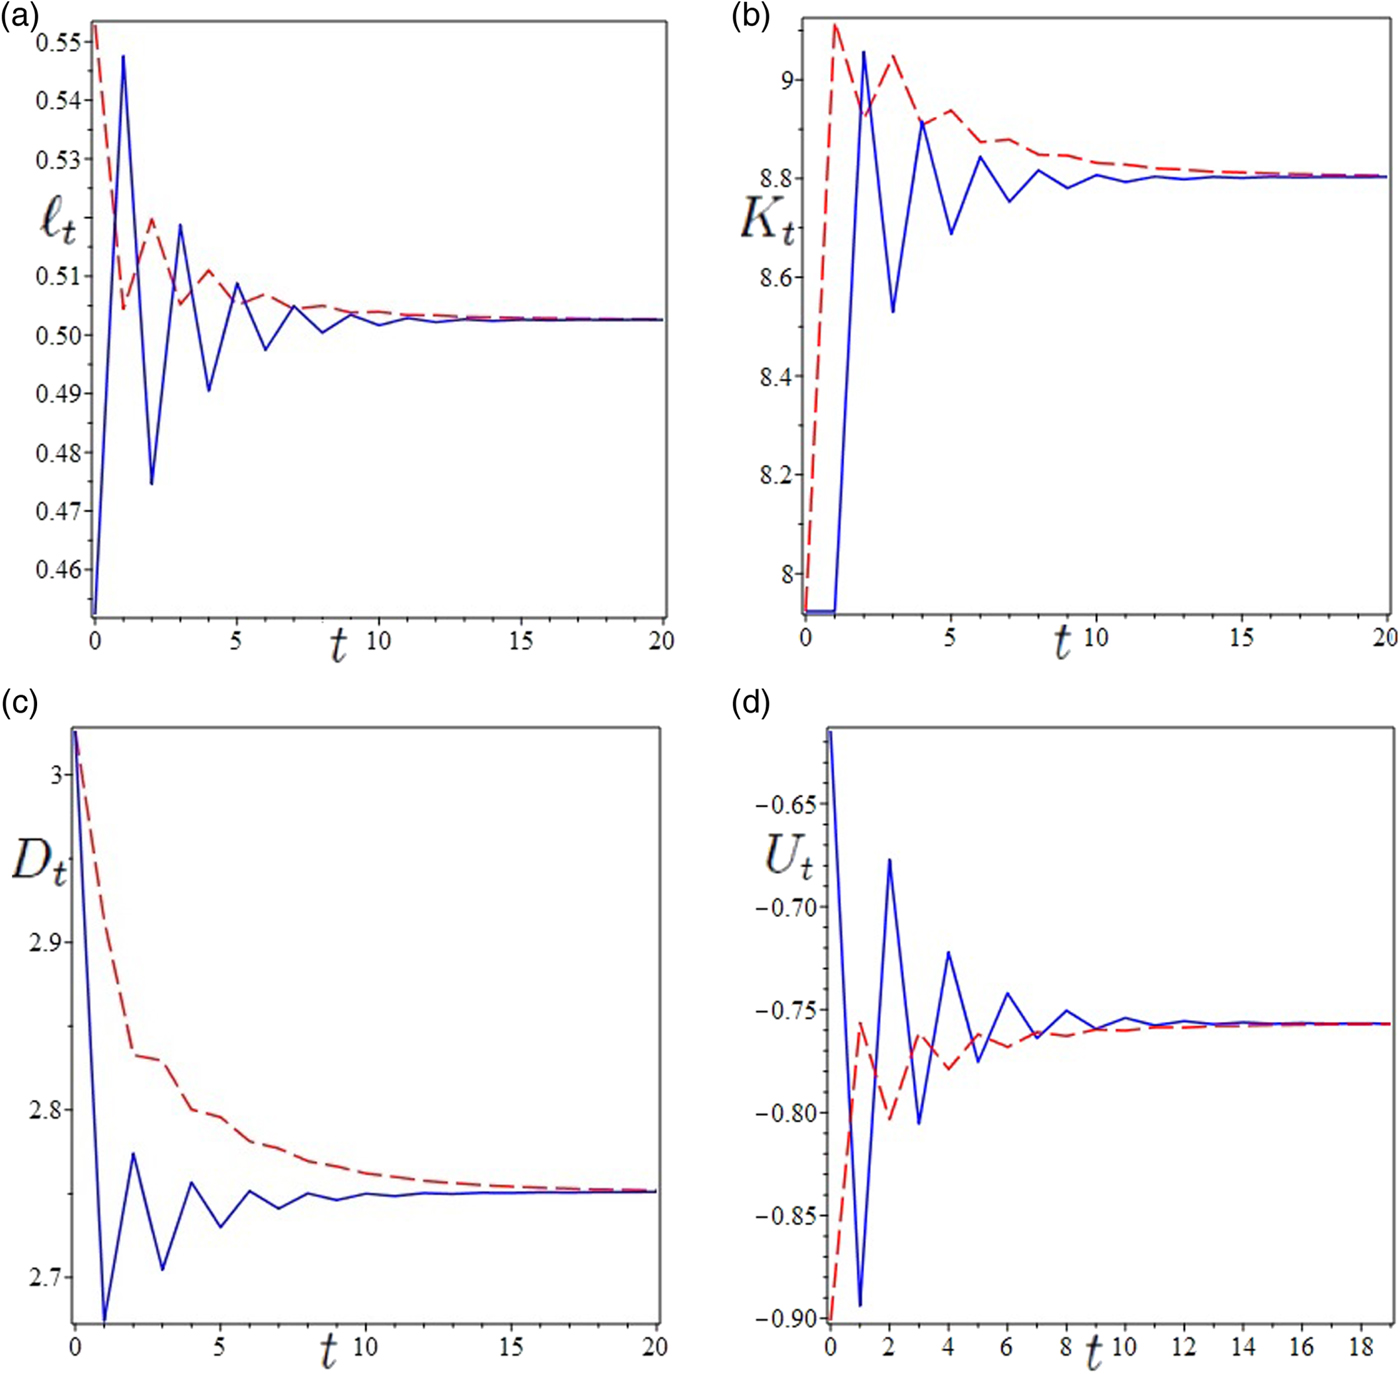
Figure 2 illustrates two trajectories (dashed line and solid line) that start from the same values of the state variables K and D and converge towards the unique stationary state through different paths. The lifetime utility U t of generation t behaves differently along the two trajectories, with some values of t in which U t is higher along one trajectory, and others in which U t is higher along the other trajectory. It may be interesting to observe that the discounted sum of utilities $Z:=\sum_{n=0}^{+\infty }\theta ^{n}U_{n}$ is lower along the dashed trajectory, which starts from a higher initial value of ℓ (Z solid = −0.8282986747 > Z dash = − 1.092149136). The same holds for the non-discounted sum $Q_{t}:=\sum_{n=0}^{t}U_{n}$
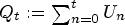 for every value of t (see figure 3). Therefore, if individuals can coordinate themselves by choosing a lower initial value of ℓ, which also implies a lower adaptation effort in the second period of life, then their choices allow the economy to follow a trajectory characterized by a higher wellbeing. Interestingly, the trajectory associated with the highest wellbeing (solid) corresponds to the lowest average value of the labor supply and lowest average value of defensive expenditures.
Local indeterminacy. Parameter set: A = 10.6, α = 0.3, γ = 0.64, θ = 0.2, δ = 0.14 and β = 1.1.
Values of $Q_{t}:=\sum_{n=0}^{t}U_{n}$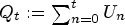 along the dashed and solid trajectories of figure 2. Parameter set: A = 10.6, α = 0.3, γ = 0.64, θ = 0.2, δ = 0.14 and β = 1.1.

In concrete terms, this result suggests that an increase in the degree of vulnerability to environmental degradation (β, i.e., the impact of environmental degradation on wealth) or an increase in the rate of output pollution intensity (δ, i.e., the impact of production on the environment) increases the likelihood of coordination failure. Individuals choose their initial labor supply based on their expectations on K and D but convergence towards the stationary state of the economy may occur through multiple paths. Therefore, the assumption of perfect foresight does not ensure agents' coordination as instead would be under saddle-point stability.
Given the initial conditions (history) and regardless of the initial value of the control variable (expectations), local asymptotic stability implies that the economy will eventually converge to the same long-term values of production, environmental quality, utility and wealth allocation between material consumption and defensive expenditures. However, this does not mean that the initial value of the control variable, the labor supply, is not relevant. As was pinpointed in the wellbeing analysis reported in this section, it may indeed have relevant consequences from a policy perspective.
4. Global indeterminacy
Despite the simplicity of the model, and the existence of only one stationary state, the interplay between production and consumption choices on the one hand and environmental degradation on the other may give rise to scenarios characterized by a high degree of complexity. If we do not concentrate only on the local properties of the dynamics around the stationary state but consider also the global properties of the system, it is possible to observe global indeterminacy. Global indeterminacy implies that two economies starting from the same initial conditions on the state variables K and D (history) can experience completely different development trajectories and long-term outcomes if they start from different initial values of the control variable ℓ. As was mentioned above, the initial choice of ℓ is determined by individual expectations about the future evolution of K and D (expectations matter). From a mathematical point of view, global indeterminacy implies a peculiar form of multistability for which there exists at least a pair $(\bar {K},\bar {D})$ such that two or more basins of attraction of the different attractors of the model are simultaneously cut by a plane defined by the conditions $K= \bar {K}$
 and $D=\bar {D}$
 at the same time.
An interesting scenario is the one in which global indeterminacy coexists with local determinacy. In this regard, an example is illustrated in figure 4, which depicts the time evolution of ℓ along two different trajectories. One of them approaches the stationary state (the dashed trajectory), which is saddle-point stable, and the other one approaches an attractive two-period cycle (the solid trajectory). These limit sets are achieved starting from the same value of the state variables (K 0 = 1.67233424156157, D 0 = 3.47754228557942) and fixing the initial conditions of the control variable at the values $\ell _{0}=\ell _{0}^{s}:=0.465776499615603$ and $\ell _{0}=\ell _{0}^{s}+0.1$
 , respectively. Though the stationary state is saddle-point stable, in this case the local analysis can be misleading as the economy may converge towards an attractor around the stationary state for infinite initial values ℓ0 different from $\ell _{0}^{s}$
 .
Parameter set: A = 10.6, α = 0.3, $\beta = 0.89$ , γ = 0.64, δ = 0.14 and θ = 0.2. Time series of two distinct trajectories of ℓt: one approaches the stationary state (dashed), which is saddle-point stable; the other approaches an attractive two-period cycle (solid).

Another scenario of global indeterminacy is illustrated in the bifurcation diagram depicted in figure 5 (panel a), showing the possible ω-limit sets for β ∈ (0.25, 0.45). The dashed line represents the stationary state, when it is saddle-point stable (local determinacy). The stationary state becomes attractive (local indeterminacy) for values of β approximately higher than 0.40 (the curve drawn in black). Starting from β = 0.25, the (locally determinate) stationary state is the unique existing ω-limit set. In this context, there is no global indeterminacy. For higher values of β (approximately β > 0.28) we can observe the rise of a chaotic attractor (the points in black), which coexists with the locally determinate stationary state. When β further increases, the chaotic attractor exhibits a sequence of reversed flip-bifurcations (period halving) leading to the scenario in which the (locally determinate) stationary state coexists with an attractive two-period cycle and eventually to the existence of a unique attractive stationary state (local indeterminacy). In addition, for β ranging approximately in the interval (0.302, 0.306) there exists another chaotic attractor (depicted in red). Therefore, for β ∈ (0.302, 0.306) we observe the coexistence amongst the locally determinate stationary state (dashed), an attractive two-period cycle (black) and the chaotic attractor (red). In this context of global indeterminacy, we have that starting from the same initial conditions of the state variables, three different long-term outcomes can be achieved depending on the initial choice of the control variable (ℓ).
(a) Bifurcation diagram for β. Parameter set: A = 0.3, α = 0.33, γ = 0.9, θ = 0.03 and δ = 0.4. (b) Bifurcation diagram for δ. Parameter set: A = 0.3, α = 0.33, γ = 0.9, θ = 0.03 and β = 0.28131. Multiple coexisting ω-limit sets.
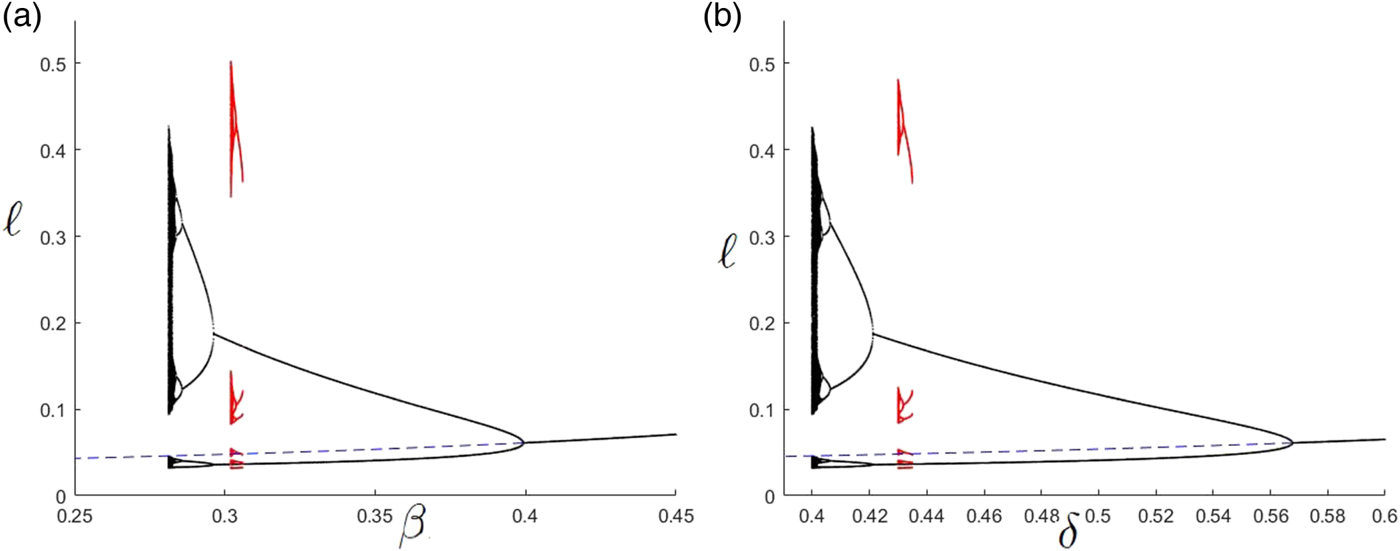
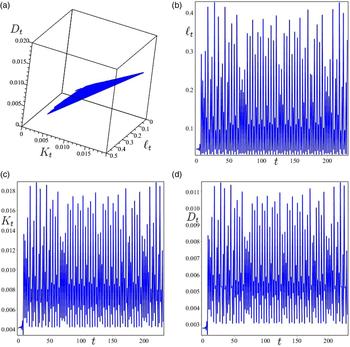
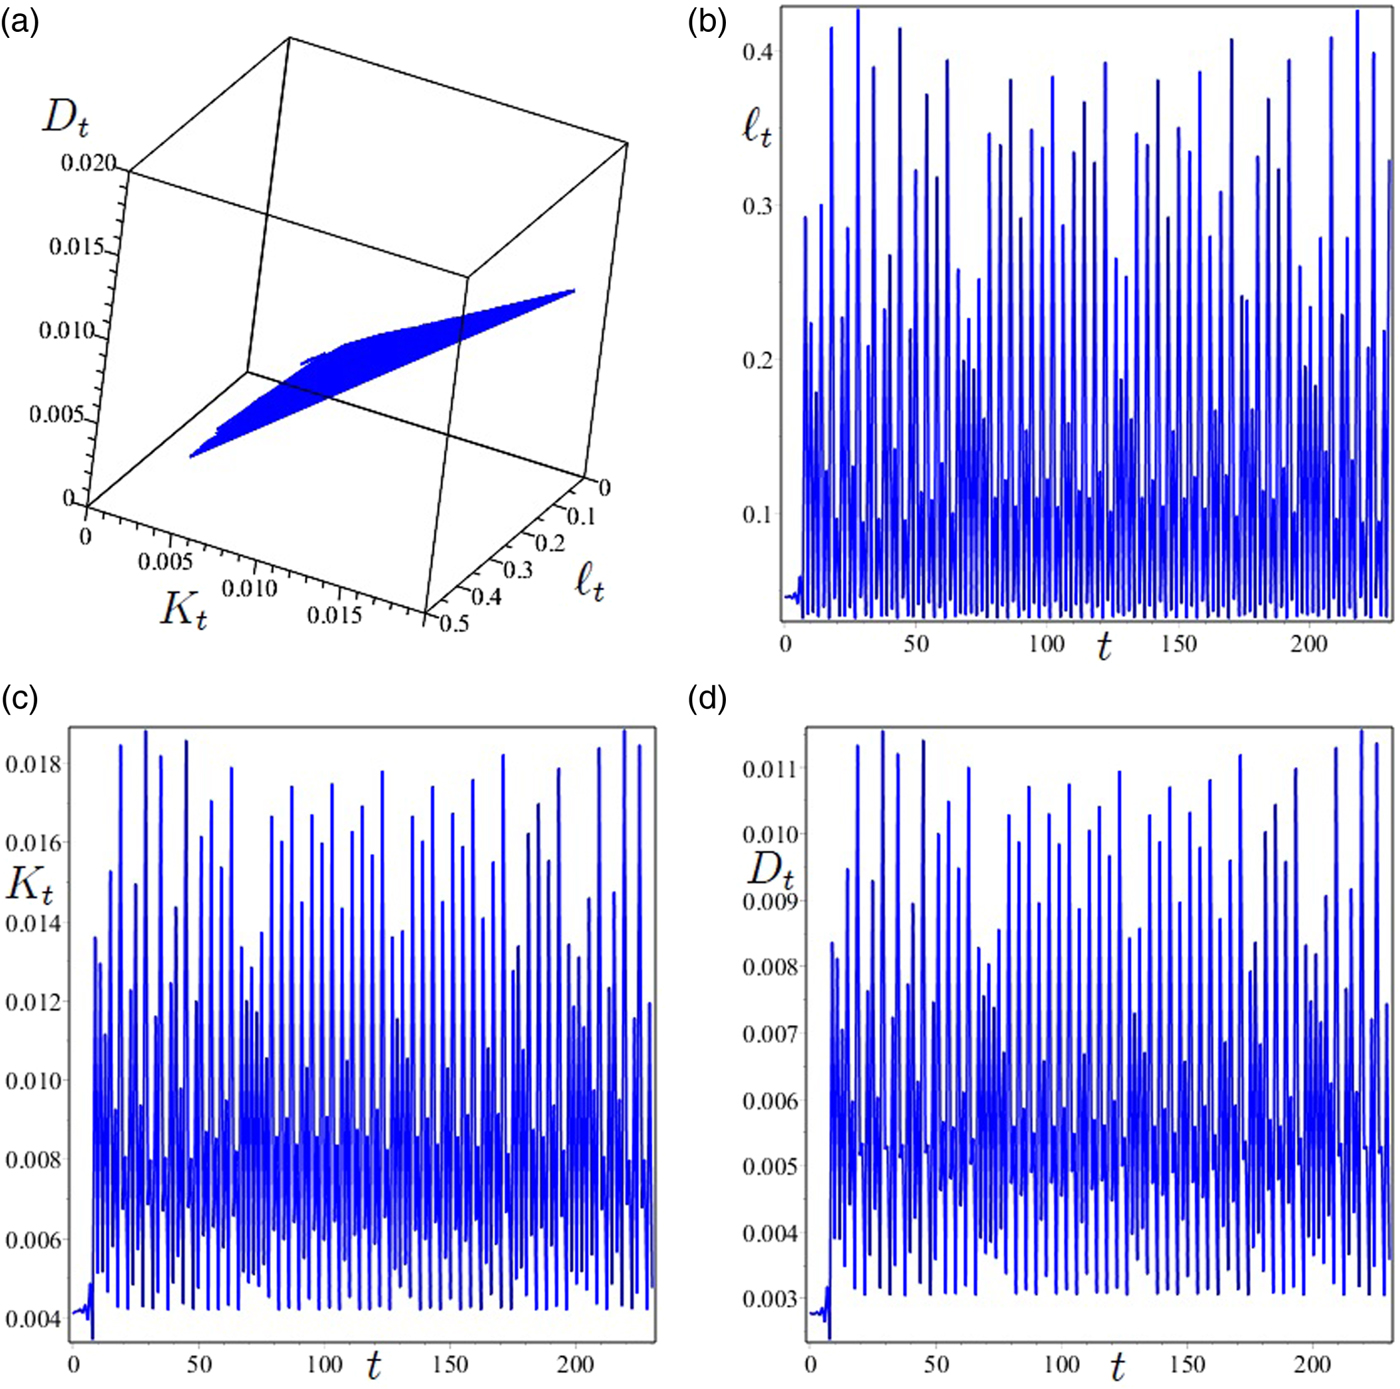
Figure 6 shows the time series of K, ℓ and D exhibiting the erratic behavior of a trajectory approaching the chaotic attractor illustrated in the bifurcation diagram of figure 5 (panel a) for β = 0.281310. Interestingly, the erratic trajectories in figure 6 are related to a lower average utility and a higher average labor supply than the corresponding stationary-state values. In other words, a strong effort for adaptation strategies can be detrimental for the environment, thereby inducing further adaptation and environmental degradation and then utility losses. The same results can be obtained if, ceteris paribus, the parameter δ changes (figure 5, panel b). For values of δ smaller than (around) 0.4, the long-term equilibrium is unique and determinate. This suggests that high values of δ not only produce a direct environmental damage but can also jeopardize agents' coordination leading to global indeterminacy. Therefore, policy makers should encourage the use of clean technologies.
Parameter set: A = 0.3, α = 0.33, γ = 0.9, θ = 0.03 and δ = 0.4. Time series of the variables K, ℓ and D showing the erratic behavior of a trajectory approaching the chaotic attractor, illustrated in the bifurcation diagram of figure 5, for β = 0.281310.
5. Conclusions
We conclude by coming back to our initial questions. Can individual behavior change tackle environmental threats? Can adaptation always give a positive contribution to protect human wellbeing against environmental damages? Let us take the example of climate change. Several governments are not on track towards meeting their Paris Agreement commitments,Footnote 5 but all around the world there is a certain emphasis on the role of citizens' climate awareness and lifestyle change for decarbonization. A large share of global emissions comes from direct and indirect forms of human consumption. Consequently, the call for urgent and massive action is often translated into a checklist of things we can do to make a difference – as individuals.
At the same time, adaptation is gaining increasing momentum both at government and individual levels. Recent empirical research has found, especially in high income countries, that implementation of concrete adaptation initiatives is growing (Lesnikowski et al., Reference Lesnikowski, Ford, Biesbroek, Berrang-Ford and Heymann2016; Berrang-Ford et al., Reference Berrang-Ford, Biesbroek, Ford, Lesnikowski, Tanabe, Wang, Chen, Hsu, Hellmann, Pringle, Grecequet, Amado, Huq, Lwasa and Heymann2019), while citizens and firms are increasingly investing in defensive strategies (Surminski, Reference Surminski2013; Korhonen et al., Reference Korhonen, Kangasraasio and Svento2019).
How risky and dangerous is this trend of weak policy commitment for climate mitigation compared to adaptation and reliance on individual behavior for both mitigation and adaptation? Are changes in individual consumption lifestyle the primary means of ‘making a difference’? In this work, we aim at answering these questions from a purely theoretical perspective. We acknowledge that empirical research is essential to track and forecast GHGs emissions along with their impact and to monitor climate policies. At the same time, we believe that the theoretical analysis, by combining sensible assumptions with the consistency and robustness of mathematical tools, can play a complementary and essential role, especially in the case of climate change, which requires transitions with no historical precedent.
More precisely, we address this question by modelling agents' consumption and production choices, which can result in either mitigation or maladaptation. We believe that it is a worthwhile exercise in the light of possible unintended and perverse effects of adapting efforts which are deemed to increase with rising temperatures (see UNEP, 2019, for a recent discussion about maladaptation to climate change).
Our model suggests that individual adaptation is dangerous as it may end up exacerbating climate change and reducing individual wellbeing. At the same time, the paths generated by individual adaptation are extremely hard to be analysed and predicted as they can be erratic and even chaotic.
The analysis shows that environmental degradation and agents' expectations about its future evolution can affect the paths of economic development in both the short and long term. The interaction between environmental degradation and agents' decisions may cause coordination failures and endogenous fluctuations in both economic and environmental variables. This last phenomenon has relevant policy consequences as phases where environmental degradation is small are followed by phases where environmental degradation is large. In addition, the likelihood of coordination failures becomes larger as the vulnerability to environmental changes or the degree of pollution intensity increases. To the extent that policy makers can affect pollution intensity, the policy implications of this result are clear. Weak environmental regulation not only reduces individual lifetime utility at the stationary states but may also cause local or global indeterminacy. In the case of global indeterminacy, agents may be not able to coordinate towards the growth paths with better long-term wellbeing outcomes. This is because there exists a multiplicity of feasible trajectories that the economy may follow starting from different initial values of the control variable. Consequently, there is not just one rational and admissible expectation shared by all agents. Decentralized decisions to fix and face environmental degradation may therefore end up in coordination failures and unpredictable outcomes.
Acknowledgments
The authors gratefully acknowledge conference participants at the 2018 International Workshop on ‘The Economics of Climate Change and Sustainability’ held at Bertinoro (University of Bologna), Italy, for valuable comments on an earlier draft. The authors are also indebted to two anonymous reviewers for comments and suggestions allowing an improvement in the quality of the work. Mauro Sodini also acknowledges financial support from the research project PRA 2017–2018 (University of Pisa) entitled ‘Globalization, population and sustainability’. The usual disclaimer applies.