
I. INTRODUCTION
Gas-particle separation has been the focus of many industries for several decades. Air filtration is a widely applied method for removing fine particles from a gas stream. The most common filters are polypropylene (PP) nonwoven fabrics due to its inexpensive cost and easy fabrication. A typical nonwoven filter consists of a mat of fine fibers. Therefore, the nanofibers have been used to prepare the filter device because they can improve collection efficiency without sacrificing the flow resistance. The electrospinning process is one of the most important methods to fabricate nanofibers. The filtration efficiency can be improved by electrospun nanofibers for filter media. Reference Yeom, Shim and Pourdeyhimi1,Reference Leung, Hung and Yuen2 The mechanisms of air filtration include interception, inertial impaction, diffusion, gravitational settling, and electrostatic attraction. Among them, electrostatic attraction is an important way to affect the efficiency of particle capture. Electrostatic attraction is widely used in many different types of aerosol filtration devices. Polymer fibers can be provided charges to increase their filtration efficiency through the electrostatic attraction. Reference Ikezaki and Murata3,Reference Nifuku, Zhou, Kisiel, Kobayashi and Katoh4 Polymer fibers such as polypropylene, poly(ethylene terephthalate), and nylon-6 (PA6) can be electrified by electrostatic charging technologies including corona charging, triboelectrification, and induction. Similar to corona charging technique, electrospinning technique also employs high voltage to charge the polymer solution. Reference Zhang, Karki, Rutman, Young, Wang, Cocke, Ho and Guo5 Different types of hybrid nanofibers incorporating nanoparticles into various polymer matrices have been prepared through electrospinning technique. Reference Park, Ryu and Kim6,Reference Korina, Stoilova, Manolova and Rashkov7 Nevertheless, to the best of our knowledge, the effect of nanoparticles on the charge storage properties of polyacrylonitrile (PAN) nanofiber web as a high efficiency filter media has been rarely reported.
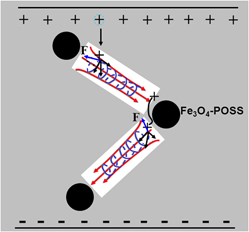
It was known that the charge storage properties of polymer electrets can be further improved by the formation of elongated voids or introducing charge traps with adding minor amounts of additives. Reference Hillenbrand, Motz, Sessler, Zhang, Behrendt, Salis-Soglio, Erhard, Altstädt and Schmidt8–Reference Mohmeyer, Schmidt, Kristiansen and Altsta10 In our previous studies, it has been confirmed that the charge storage properties of PP meltblown nonwoven fabric was improved with addition of polyhedral oligomeric silsesquioxanes (POSS). Reference Song, Zhou, Wang, Kang and Cheng11–Reference Song, Jeon, Oh and Park13 It is crucial for the substantial improvement of the charge storage properties that charge-transfer path is lengthened and detrapping charge can be retrapped. The detrapping charge moves in a spiral curve by lorentz force produced by magnetic field, indicating that their path will be lengthened and have more chance to be retrapped during moving process. Therefore, their electret properties may be improved by Lorentz force produced by magnetic field between magnetic nanoparticles after they are added into electret materials.
In recent years, nanoscaled magnetic particles have attracted much attention because they exhibit extraordinary physical and chemical properties due to their small size and high surface-area-to-volume ratio. Reference Ozmen, Can, Arslan, Tor, Cengeloglu and Ersoz14,Reference Du, Mei, Tao, Zhao, Cao, Nie, Xu and Fan15 Monodisperse Fe3O4 nanocrystal as a typical magnetic nanomaterial has been already applied in biomedical fields, water treatment, Reference Zhang and Zhu16,Reference Ye, Liu, Li, Liu and Wu17 cell separation, Reference Ren, Jia, Ren, Yuan and Tan18 target drug delivery, Reference Zhu, Fang and Kaskel19 catalyst, and magnetic resonance imaging. Reference Wang, Shenb, Aihuaa and Hea20,Reference Sun, Li, Gao and Shang21 However, Fe3O4 nanocrystal is very susceptible to air oxidation and easily aggregates. Surface functionality is an effective method to reduce air oxidation and aggregation. Qu et al. prepared Fe3O4–chitosan nanoparticles using co-precipitation method for hyperthermia. Reference Qu, Liu, Wang and Hong22 Wang et al. utilized EDTA (Ethylene Diamine Tetraacetic Acid) to modify Fe3O4 nanocrystal for removing organic pollutants. Reference Wang, Wang, Tang, Cao, She and Zhu23 Xuan et al. reported stable Fe3O4–polyaniline core/shell microspheres with a well-defined blackberry-like morphology. Reference Xuan, Wang, Leung and Shu24 Due to the reliable stability, and facile reactivity, silica has also been applied to modify Fe3O4 to improve its chemical stability. Reference Chen, Xu, Dai and Zhang25–Reference Zhang, Niu, Pan, Shi and Cai27
Regarded as the smallest spherical silica, POSS with 1–3 nm in diameter are cage-like hybrid molecules composed of silicon and oxygen. POSS with many unique physical properties has been used to prepare organic–inorganic hybrid materials. POSS can molecularly disperse in the nanocomposites due to their organic or inorganic substituent. Reference Moon, Kath, Pandian, Kolake and Han28–Reference Markovic, Clarke, Matisons and Simon30 In this study, we combined the advantages of POSS and Fe3O4 to improve the properties of PAN fibers as electret. In detail, magnetic Fe3O4–POSS particles with Si–OH were prepared by the hydrosilylation reaction. Reference Böhme32–Reference Cano, Yus and Ramón35 Then PAN/Fe3O4–POSS nanofibers were fabricated with PP as meltblown support layer by electrospinning technique, and its aerosol filtration properties as a new electrets filter media were subsequently characterized.
II. EXPERIMENTAL
A. Materials
FeCl3·6H2O and FeCl2·4H2O were purchased from Tianjin Kemio chemical reagent corporation. Dichloromethylsilane, cyclopentyltrichlorosilane, dichloromethylvinylsilane (DCMVS) (97%), and Karstedt's catalyst were purchased from Alfa Aesar.
B. Preparation of Fe3O4 nanoparticles
The synthesis of Fe3O4 nanoparticles was prepared according to the Ref. Reference Wei, Han, Hu, Lin, Wang and Deng36. Firstly, FeCl3·6H2O and FeCl2·4H2O (molar ratio 1.8:1) were added into the flask with deionized water, and then NaOH solution (3 mol/L) was dropwise added until the pH was 10. The reaction solution was stirred at 70 °C for 1.5 h under the nitrogen atmosphere. The crude product was obtained by magnetic separation and further washed repeatedly with deionized water and ethanol until pH was 7. Finally, the products were dried at 40 °C in vacuum.
C. Preparation of Fe3O4–SiH
Fe3O4 (1.2 g) was dispersed in the mixture of 25 mL toluene and 3 mL Et3N followed by ultrasonic treatment for 30 min, and 1 mL dichloromethylsilane was injected at room temperature. Then the reaction solution was rose to 60 °C for 6 h. Finally, the product was washed carefully with toluene, ethanol, and deionized water, respectively, and dried in vacuum oven to obtain Fe3O4–SiH.
D. Preparation of POSS–DCMVS
0.2 mL DCMVS was solely added into 45 mL dry tetrahydrofurane (THF) solution of (C5H9)7Si7O9(OH)3 (1.5 g) and triethylamine (0.5 mL) at 0 °C under nitrogen atmosphere. The reaction was stirred at 0 °C for 1 h, and then rose to 25 °C for 6 h, followed by filtration to remove the triethylamine hydrochloride byproduct. The solution of product was concentrated to 2 mL and then was added to rapidly stirred acetone (50 mL). The precipitated product was collected and washed with acetone and distilled water, and then dried in vacuum to obtain POSS–DCMVS.
E. Preparation of Fe3O4–POSS
Karstedt's catalyst was added into 50 mL toluene mixture of POSS–DCMVS (0.47 g) and Fe3O4–SiH (0.20 g). The reaction was carried out at 50 °C for 25 h under N2 atmosphere. The resulting particles were washed thoroughly with toluene, ethanol, and deionized water, respectively, to obtain the Fe3O4–POSS.
F. Preparation of PAN/Fe3O4–POSS nanofibers
A homogeneous spinning solution was formed by adding 0, 1, 2, and 3 wt% magnetic Fe3O4–POSS into the PAN solution of DMF/THF (v/v = 9:1), respectively. Then neat PAN and PAN/Fe3O4–POSS nanofibers were fabricated under the optimal electrospun conditions of 12% PAN solution concentration, 0.8 mL/h extruding speed, 25 kV voltage, and 15 cm tip-to-collector distance. PAN/Fe3O4–POSS nanofibers with 0, 1, 2, and 3 wt% Fe3O4–POSS were denoted as PAN0, PAN1, PAN2, and PAN3, respectively.
G. Preparation of PP–PAN/Fe3O4–POSS composites fiber mats
PAN/Fe3O4–POSS nanofibers were fabricated and collected on a PP meltblown support layer by electrospinning process to obtain PP–PAN/Fe3O4–POSS composites fiber mats. PP–PAN composites fiber mats with 0, 1, 2, and 3 wt% Fe3O4–POSS were denoted as PP–PAN0, PP–PAN1, PP–PAN2, and PP–PAN3, respectively.
H. Characterization
Fourier transform infrared absorption spectroscopy (FTIR) spectra were recorded on a Perkin Elmer spectrometer. All samples were prepared as potassium bromide pellets. The scanning range was from 4000 to 500 cm−1.
The morphologies and sizes of these particles were observed using scanning electron microanalyzer (SEM) and FEI Tecnai 20 transmission electron microscopy (TEM; FEI Company, Hillsboro, Oregon). The magnetic nanoparticles were dispersed in the polyethylene glycol solution (0.05 wt%). The solution was dripped onto the surface of copper grid placed on rotating photoresist spinner to remove the excess solution. Energy-dispersive x-ray (EDAX) was taken to analyze each element content.
Thermogravimetric (TG) analysis was used to investigate the stability of the composites. All of the thermal analyses were conducted under N2 atmosphere to 800 °C at the heating rate of 10 °C/min.
Vibrating sample magnetometry was used to measure the magnetic properties of the magnetic particles.
The surface potential of each sample was measured with a vibration capacitive electret electrostatic voltmeter (EST-102A). All reported data on surface potential values are the average of five defined positions of the films.
Circular samples (R = 5 cm) with 50 μm thickness were cut from randomly selected places of different PAN nanofiber mats. The surface charge density of each sample was measured with an EST111 static charge meter (Coulomb Meter). Measurements were performed directly at room temperature. All reported data on surface charge density values are the average of five samples.
The collection efficiency of PP–PAN0, PP–PAN1, PP–PAN2, and PP–PAN3 were measured by monodisperse NaCl (particle size: 0.25 μm) collection for gas velocities 32.0 cm/s using a SX-L1050 filter manufacturing apparatus. All reported data on collection efficiency values are the average of five tests.
III. RESULTS AND DISCUSSION
A. Synthesis of Fe3O4–POSS
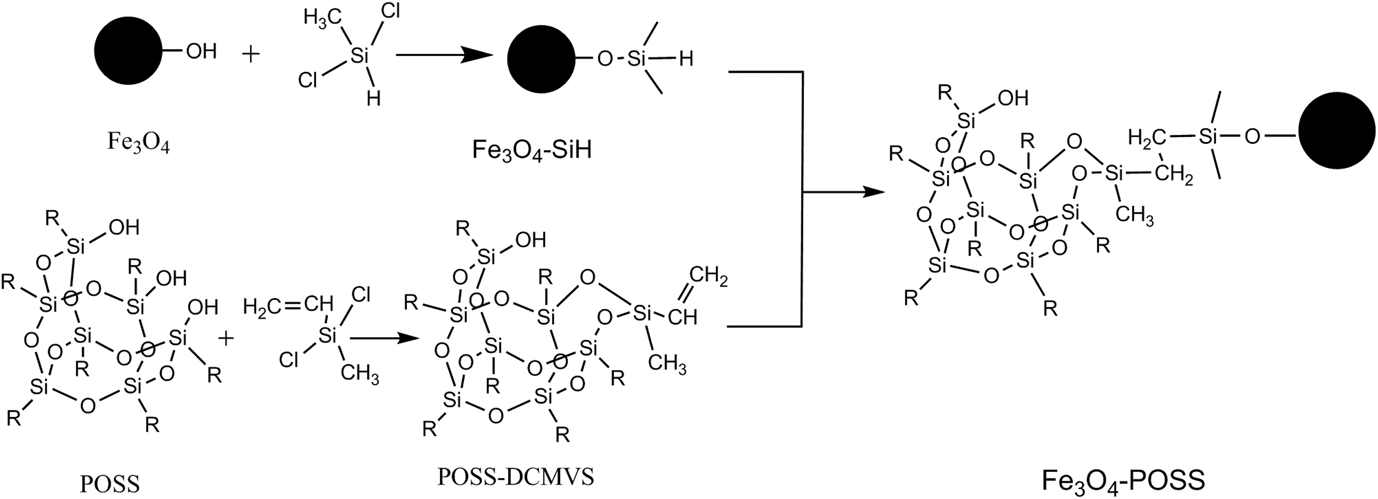
The synthetic route of Fe3O4–POSS is outlined in Scheme 1. Fe3O4 nanoparticles synthesized by co-precipitation method reacted with dichloromethylsilane to obtain Fe3O4–SiH. POSS with hydroxyl and vinyl (POSS–DCMVS) was synthesized through the reaction between (cyclo-C5H9)7Si7O9(OH)3 and DCMVS. Finally, Fe3O4–POSS was obtained through hydrosilylation reaction between the Fe3O4–SiH and POSS–DCMVS.
B. Morphology of Fe3O4–POSS
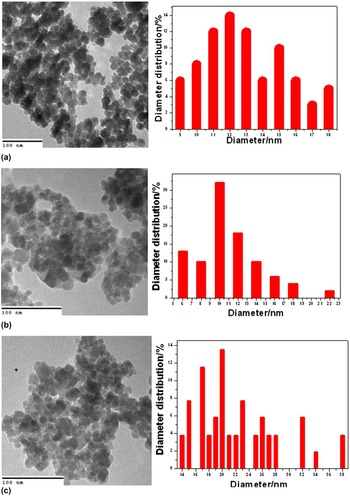
TEM was utilized to observe the morphology of Fe3O4, Fe3O4–SiH and Fe3O4–POSS magnetic nanoparticles. The distribution of particles sizes is calculated by the image analysis software. All these results are shown in Fig. 1. It is noted that most Fe3O4 nanoparticles with spherical structure has an average diameter of 12.4 ± 5.6 nm and relative narrow size distribution. Some Fe3O4–SiH magnetic nanoparticles exhibit quasicubic shape structure and the particle diameters range from 5 to 23 nm. The mean diameter of Fe3O4–POSS nanoparticles increases compared with Fe3O4–SiH, but they still keep quasi spherical state.
TEM micrographs of (a) Fe3O4, (b) Fe3O4–SiH, and (c) Fe3O4–POSS.

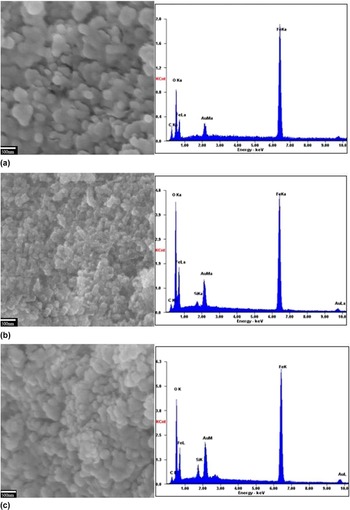
Figure 2 shows the field emission scanning electron microscopy (FESEM) images of Fe3O4, Fe3O4–SiH, and Fe3O4–POSS nanoparticles. It can be clearly observed that Fe3O4 are polydisperse due to aggregation and some Fe3O4–SiH particles aggregate to columnar shape, but the extent of aggregation turns smaller after grafted with the POSS molecules. The result suggests the aggregation of Fe3O4–POSS reduces compared with pristine Fe3O4. The compositions of Fe3O4, Fe3O4–SiH, and Fe3O4–POSS magnetic nanoparticles are analyzed by using EDAX analysis, and the content of Si corresponding to Fe3O4, Fe3O4–SiH and Fe3O4–POSS increases successively, indicating that Fe3O4 has been modified by POSS. Reference Misra, Fu and Morgan37–Reference Hoyos, Fina, Carniatoc, Pratodand and Monticelli39
FESEM of (a) Fe3O4, (b) Fe3O4–SiH, and (c) Fe3O4–POSS.

C. FTIR analysis of Fe3O4–POSS
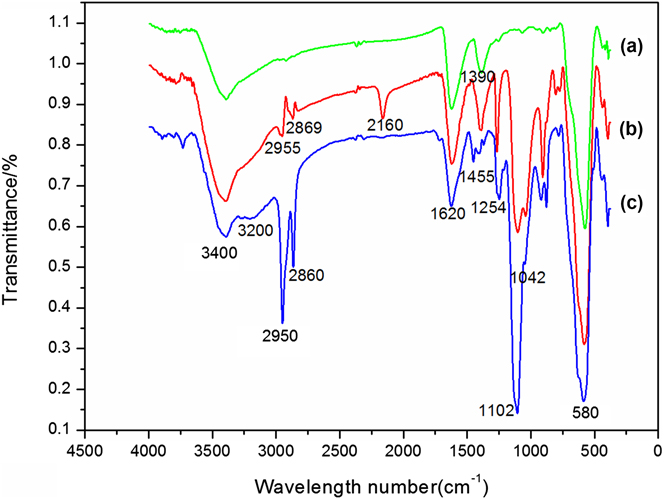
The FTIR spectra of Fe3O4, Fe3O4–SiH and Fe3O4–POSS particles are shown in Fig. 3. In Fig. 3(a), the strong absorption bands at 580 cm−1 corresponds to the Fe–O vibration of Fe3O4 nanoparticles. The characteristic peaks at 1620 and 3400 cm−1 are ascribed to the absorbed H2O molecules or OH− on the surface of the samples. Reference Chen, Xu, Dai and Zhang25 Similar peaks can be also observed in the spectra of Fe3O4–SiH and Fe3O4–POSS. The absorption at 1042 cm−1 in Fig. 3(b) is characteristic peak of the Si–O–Fe bond grafted on the surface on Fe3O4. The peak at 1108 cm−1 should be the stretching vibration of Si–O–Si bond, and the peak at 2160 cm−1 is attributed to the stretching vibration of Si–H bond. The peaks at 2955 and 2869 cm−1 are related to the existence of asymmetric and symmetric stretching vibration of –CH3 groups. Reference Lei, Li and Wei40 In Fig. 3(c), the strong peaks at 1108 and 1042 cm−1 are ascribed to antisymmetric stretching vibration of Si–O–Si and Si–O–Fe bond, respectively. Reference Yan, Zheng, Sun and Zhao41 Two peaks at 2950 and 2860 cm−1 correspond to the asymmetric and symmetric stretching vibration of –CH2 of cyclopentyl, respectively. Reference Wu, Ge and Mather42 The peak at 1455 cm−1 is the deformation vibration of –CH2 on cyclopentyl. The peak at 1254 cm−1 corresponds to the stretching vibration of –CH3 related to Si atom. Compared with Fig. 3(b), the peak at 2160 cm−1 disappears, demonstrating that POSS has been grafted on the Fe3O4 through hydrosilylation reaction between the Si–H bond grafted on Fe3O4 and the C=C on the surface of POSS.
FTIR spectra of (a) Fe3O4, (b) Fe3O4–SiH, and (c) Fe3O4–POSS.

D. TG analysis of Fe3O4–POSS
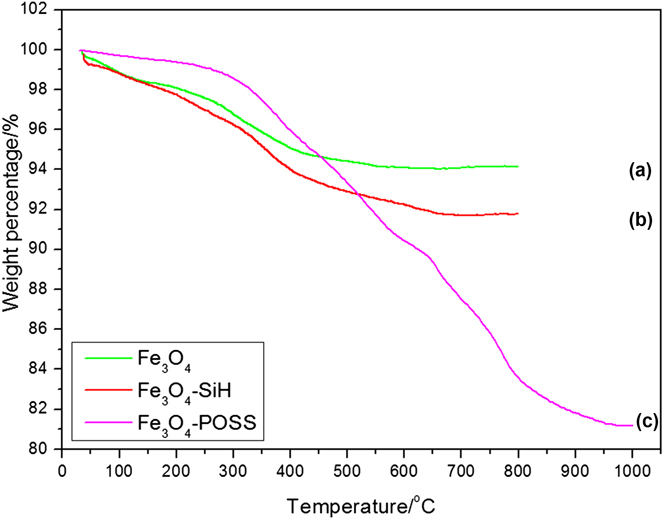
TG curves of Fe3O4, Fe3O4–SiH, and Fe3O4–POSS nanoparticles are shown in Fig. 4. The 5.85% weight loss of Fe3O4 is ascribed to evaporation of the water on the surface of Fe3O4 by physical and chemical absorption. Reference Duan, Litwiller and Pinnau29 According to Fig. 4(b), the mass fraction of the DCMS grafted on Fe3O4 is 2.37%. The organic groups of Fe3O4–SiH were decomposed in the temperature range from 313 °C to 600 °C, corresponding to 8.22% weight loss. The initial decomposed temperature of Fe3O4–POSS is improved by 100 °C compared with Fe3O4. The improvement in decomposed temperature originates from the inherent good thermal stability of the POSS. The remaining percentage of Fe3O4–POSS is 81.17% after the organic groups of POSS are decomposed. Molar rate of dichloromethylsilane and POSS–C=C grated on Fe3O4 is 0.94:1 calculated by the TGA data.
TG curves of (a) Fe3O4, (b) Fe3O4–SiH, and (c) Fe3O4–POSS.

E. Magnetic properties of Fe3O4–POSS
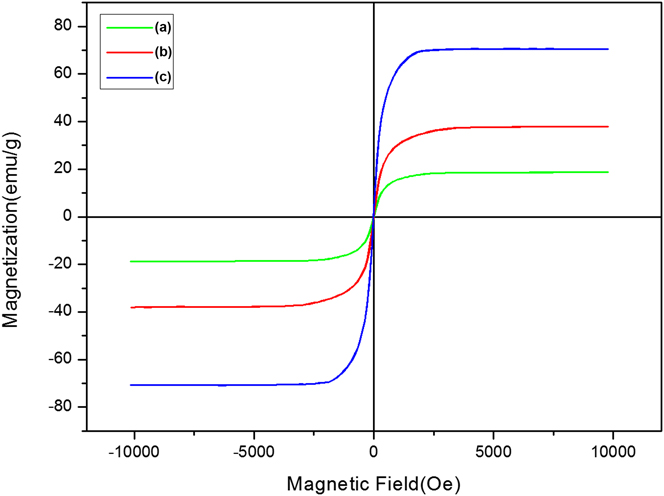
Figure 5 shows the hysteresis loop curves of Fe3O4, Fe3O4–SiH, and Fe3O4–POSS. Fe3O4, Fe3O4–SiH and Fe3O4–POSS exhibited a superparamagnetic behavior with zero remanence and coercivity, which may result from the small particle size as observed from the TEM images. Reference Zhu, Kockrick, Ikoma, Hanagata and Kaskel43,Reference He, Wang, Li, Miao, Wu and Zou44 Their magnetic saturation values are 70.8 emu/g, 38.04 emu/g, and 18.77 emu/g, respectively. The saturation magnetization of modified Fe3O4 was much smaller than that of pure Fe3O4. This phenomenon is related with the surface order/disorder interaction of the magnetic spin moment and the disturbance in the spinel structure inversion. Reference Chen, Xu, Dai and Zhang25 In addition, the saturation magnetization decreased because coatings changed the surface magnetic anisotropy and led to an increase of the surface spins disorientation. Reference Qin, Wang, Zhang and G. Su45
Magnetization curves of samples: (a) Fe3O4–POSS, (b) Fe3O4–SiH, and (c) Fe3O4.

F. Fiber morphology of electrospun PAN/Fe3O4–POSS nanofibers
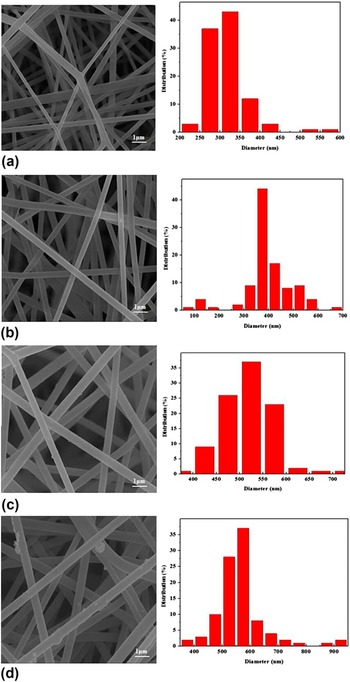
The SEM images and corresponding fiber diameter distribution of PAN and PAN/Fe3O4–POSS nanofibers are shown in Fig. 6. There are no obvious changes in the morphology of electrospun fibers. Uniform and smooth nanofibers are obtained by electrospinning process and they randomly distribute to form the fibrous web. The fiber diameter distributions become wider when Fe3O4–POSS nanoparticles are added. The average fiber diameter increases from 314 to 550 nm as the Fe3O4–POSS loadings reach 3 wt%. The possible reason is that viscosity of PAN solution increases after Fe3O4–POSS nanoparticles are added. As shown in Fig. 6(c), a little amount of small aggregated Fe3O4–POSS particles with diameter less than 100 nm can be observed on the surface of PAN2/Fe3O4–POSS nanofibers. Some large POSS particles can be observed only when Fe3O4–POSS loading reaches 3 wt% [Fig. 6(d)], indicating that Fe3O4–POSS can homogeneously disperse in the PAN nanofibers when Fe3O4–POSS content is less than 2 wt%.
SEM images and corresponding fiber diameter distribution of PAN/POSS nanofibers [(a) PAN0, (b) PAN1, (c) PAN2, (d) PAN3].

G. The electret properties of PAN/Fe3O4–POSS
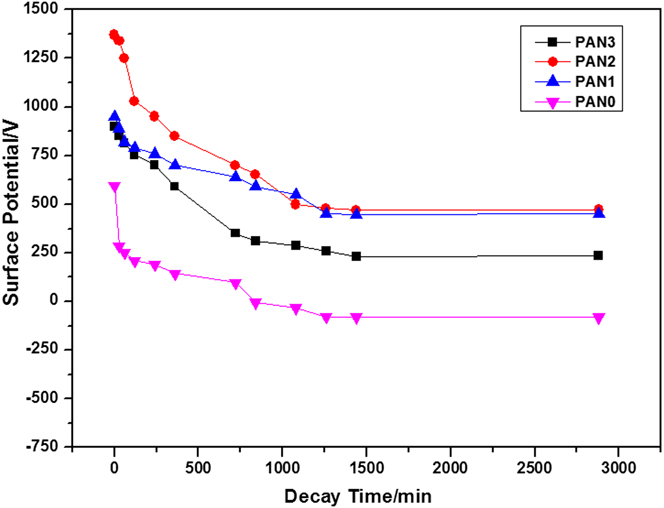
The electret properties were investigated by measuring the surface potential and the surface charge density of PAN/Fe3O4–POSS nanofiber mats. Figure 7 shows the decay of the surface potential over time for PAN mats with different content Fe3O4–POSS. It can be seen that the surface potential of neat PAN mats decreases dramatically in the first half hour and subsequently decreases slowly until 1080 min, and positive potential of the neat PAN mat turns into negative potential because of adsorbing some materials with negative charge in the air. The initial surface potential is much higher after addition of Fe3O4–POSS and the stability of the surface potential has a remarkable improvement. At a concentration of 2 wt% Fe3O4–POSS, the highest value of the surface potential after 1080 min is 478 V, which corresponds to relative surface potential retention of 35%. The surface potential retention of 50% is obtained for PAN mats with 1 wt% Fe3O4–POSS.
The decay curves of the surface potential over time.

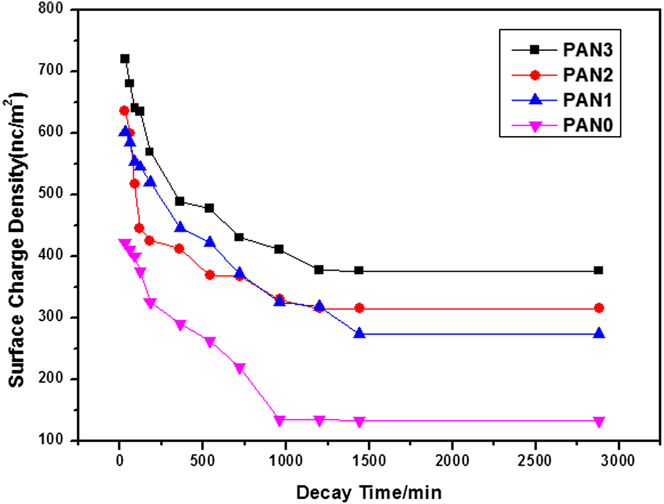
Figure 8 shows the decay of the surface charge density over time of PAN nanofiber mats with different content Fe3O4–POSS. The initial surface charge density is obviously improved with Fe3O4–POSS content increasing. The decay rate of surface charge decreases dramatically in first 4 h and charge density reach stable value after 20 h. The stability of the surface charge density increases with addition of Fe3O4–POSS. At a concentration of 3 wt%, the ultimate stable value of the surface charge density is 376.58 nC/m2. However, the surface charge density of neat PAN mats is only 132.63 nC/m2. The charge retention of PAN3 is 52.40% and is increased by 21% compared with that of pure PAN.
The decay curves of the surface charge density over time.

The improvement in stability of the surface charge and the surface potential probably results from the increment of crystalline–amorphous interfaces Reference Mohmeyer, Behrendt, Zhang, Smith, Altstädt and Sessler9 and the elongation of cavities. Reference Hillenbrand, Behrendt, Altstädt, Schmidt and Sessler46 In addition, the intrinsic nanoporosity of POSS cages can improve charge storage properties by hindering the charge drift. Reference Song, Zhou, Wang, Kang and Cheng11 Besides the influence factors described above, magnetic field between Fe3O4–POSS magnetic nanoparticles is an important factor to affect the properties of electrets.
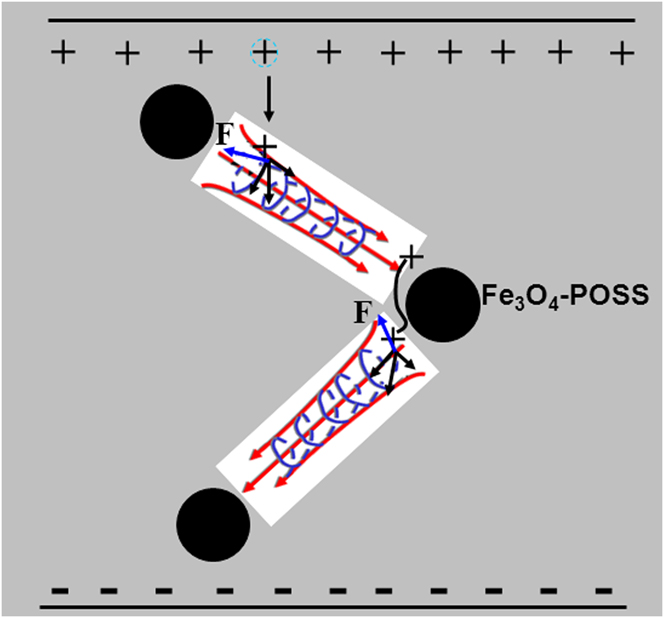
In this study, except above influence factors, magnetic field between Fe3O4–POSS magnetic nanoparticles play an important role. The detrapping charge moves in a spiral curve by Lorentz force produced by magnetic field between Fe3O4–POSS, and their path will be obviously lengthened and maybe retrapped during moving process. Therefore, the charge storage is improved dramatically. A schematic representation of the mechanism by which magnetic field role enhances the electret features is shown in Fig. 9.
Schematic representation of charge drift in a spiral curve by Lorentz force produced by magnetic field between Fe3O4–POSS dispersed in PAN.

H. Effect of Fe3O4–POSS on filtration performance of PP meltblown/PAN nanofiber mats
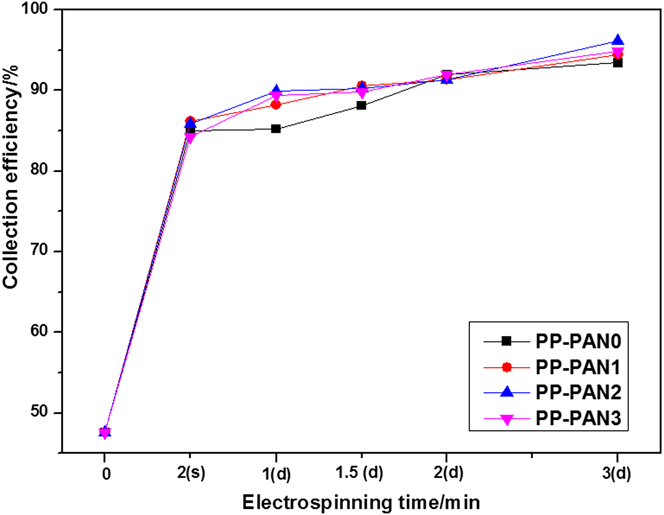
PAN/Fe3O4–POSS nanofibers were fabricated and collected on a PP meltblown support layer by electrospinning technique in the optimal condition of 12% PAN solution concentration, 0.8 mL/h extruding speed, 25 kV voltage, and 15 cm tip-to-collector distance. The relations of their collection efficiency with electrospinning time for composites fiber mats with different Fe3O4–POSS contents are shown in Fig. 10. The collection efficiency increases with electrospinning time and further enhances after addition of Fe3O4–POSS. The maximum value of collection efficiency is 96.20% for composite fiber mats with 2 wt% Fe3O4–POSS, which is improved by 48.6% than PP support layer and 3.06% than composite fiber mats without Fe3O4–POSS. The finally stable value of the surface charge density is much higher for PAN nanofiber mats containing Fe3O4–POSS compared to the neat PAN, demonstrating that the collection efficiency is improved with addition of Fe3O4–POSS.
NaCl aerosol collection efficiency of PP meltblown/PAN nanofiber mats with different Fe3O4–POSS contents for different electrospinning times (s: single side, d: double sides).

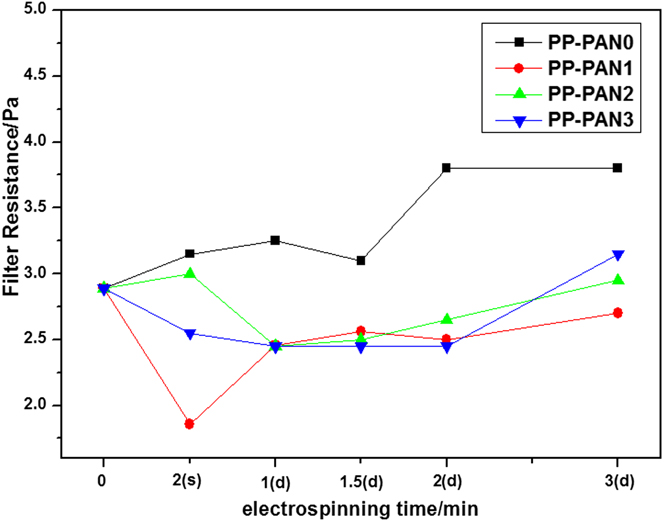
The filter resistances as electrospinning time for composites fiber mats with different Fe3O4–POSS content are shown in Fig. 11. The filter resistances of composites fiber mats increase with electrospinning time increasing for PP–PAN0. However, the pressure drop decreases when the PAN nanofibers with Fe3O4–POSS were collected on PP meltblown support layer in 3 min electrospinning time. This may be because of the increase in fiber distribution irregularities resulted from repulsion between fibers with more charges, which is consistent with Schweers and Loffler's results. Reference Schweers and Loffler47
Filter resistance of PP meltblown/PAN nanofiber mats with different Fe3O4–POSS contents for different electrospinning times (s: single side, d: double sides).

The synthesis of Fe3O4–POSS.

IV. CONCLUSIONS
The Fe3O4–POSS magnetic particles were prepared by a facile method. The magnetic saturation values of Fe3O4–POSS particles are 18.77 emu/g. PAN nanofibers mats containing Fe3O4–POSS particles are fabricated by electrospinning process. A remarkable improvement of the stability of the surface potential was observed and the surface potential retention of 50% is obtained for PAN mats with 1 wt% Fe3O4–POSS. The charge retention of PAN3 nanofibers mats with 3 wt% Fe3O4–POSS is 52.40% and is increased by 21% compared with pure PAN. The collection efficiency of composites fiber mats enhanced and their filter resistance decreased when the PAN nanofibers with Fe3O4–POSS were used as electrets filter media. Our study provided an effective method to prepare novel filter materials with high efficiency and low resistance.
ACKNOWLEDGMENTS
We gratefully acknowledge the financial support of National Natural Science Foundation (31371014), the Tianjin Research Program of Application Foundation and Advanced Technology (13JCZDJC32500), and National Key Technology R&D Program (2011BAE10B01).