1. Introduction
As an emerging technology platform in the field of water management, unmanned surface vehicles (USVs) represent a significant force in promoting the blue economy and sustainable development [Reference Luo, Zhuang, Jin, Xu and Su1]. These vehicles possess substantial potential and value across various domains, such as marine scientific research, environmental monitoring, resource development, surface search, and security. The automatic control of USVs typically encompasses path planning, path following, and automatic collision avoidance; however, automatic berthing remains a crucial component for achieving true autonomy [Reference Wu, Li, Ding, Shi and Han2–Reference Jin, Zhang, He, Yu, Jiang, Wang, Guo, Zheng, Deng and Yang4]. Given that USVs often encounter wind and current resistance during their missions, the limited energy capacity of USVs results in reduced endurance and increased energy consumption due to environmental loads [Reference Niu, Ji, Savvaris and Tsourdos5, Reference Zhang, Shi and Liu6]. To ensure successful berthing, it is essential to plan energy-efficient routes that take into account natural environmental conditions. The advancement of mature automatic berthing technology for USVs can significantly reduce labor and material costs while improving the recovery rate of USVs [Reference Yuan, Liu, Sun, Wang and Zheng7].
Currently, mainstream algorithms for berthing planning can be broadly categorized into three groups: the search category, which includes Dijkstra’s algorithm and the A* algorithm [Reference Li, Hou, Wang, Ma, Li, Wang and Chen8–Reference Ma, Zhao, Li, Yan, Bi and Królczyk11]; the sampling algorithms, represented by the Rapidly exploring Random Trees algorithm [Reference Guojun, Yunlong, Mingze, Zhibin and Jin12, Reference Jiao, Chen, Xin, Li, Zheng and Zhao13]; and the intelligent optimization algorithms, which encompass Genetic algorithm (GA), Bacterial Foraging Optimization algorithm (BFO), and Neural Network algorithm [Reference Zheng, Yu, Li, Qin and Luo14–Reference Zhang, Zhang, Wu and Wang17]. Intelligent optimization algorithms demonstrate strong global search capabilities and adaptability in path planning. They are highly flexible and robust, particularly when addressing complex multi-objective optimization problems [Reference Mohammadi and Sheikholeslam18].
Ahmed and Hasegawa [Reference Ahmed and Hasegawa19] employed artificial neural networks and virtual window concepts in automatic ship berthing experiments, achieving relatively favorable experimental results under specific wind disturbances. However, their method was primarily investigated for the berthing of large ships, which still necessitate tugboat assistance beyond a certain distance from the berthage. [Reference Ye Li, Zang and Liao20] proposed a hierarchical artificial potential field [Reference Ding, Zheng, Liu, Guo and Guo21] trajectory planning method that incorporates multiple constraints analysis of environmental obstacles, berthage, and hull dynamics in the USV berthing planning. This approach addresses the limitations of traditional artificial potential field methods, specifically the issues of local minima and excessive turning angles, by introducing a compensation radius for obstacles. The path planning performance of this method was validated through field tests. However, in scenarios characterized by dense obstacles, the USV may find itself simultaneously within the compensation ranges of multiple obstacles or may repeatedly enter the compensation area of a single obstacle. This complexity complicates the execution of effective planning and can result in oscillatory behavior. This complexity complicates the realization of effective planning and can lead to oscillatory behavior. [Reference Han, Wang, Wang and He22] proposed an extended dynamic window method for the automatic berthing of USVs. This method plans the motion path in real time, discards infeasible predicted trajectories under dynamic constraints, and evaluates the remaining trajectories using an objective function to obtain the optimal trajectory. In the second stage of planning, the USV adjusts its heading using a Proportional-Integral-Derivative (PID) controller and drifts to the berth relying on inertia. This approach introduces considerable uncertainty and complicates the stage planning, necessitating the calibration of numerous parameters for effective debugging. Both papers establish guidance points in their planning. In contrast, segmented planning may encounter challenges stemming from poorly articulated points or significant deviations in the heading angles between the two sections of the path.
Niu et al. [Reference Niu, Lu, Savvaris and Tsourdos23] proposed the Voronoi-Visibility algorithm, which integrates the Voronoi diagram, Visibility graph, and Dijkstra’s algorithm with an energy consumption function based on actual sea current data. This approach effectively simulates field tasks and enhances the quality of Voronoi energy-saving paths while maintaining algorithmic efficiency. [Reference Zhang, Shi and Liu6] updated the ocean data by establishing time breakpoints based on prior research. They enhanced the construction method of the Voronoi diagram, and their proposed dynamic energy-saving path improved the endurance while taking the distance effect into account. The former method focuses exclusively on identifying the path with the lowest energy cost, while neglecting the distance factor. In contrast, the latter method improves the construction of the Voronoi diagram, although this enhancement is confined to the environmental update phase. It is important to note that this approach does not modify the initial modeling process of the Voronoi diagram, which remains complex. Consequently, the quality of the initial path is suboptimal and necessitates multiple rounds of optimization.
The BFO is a bionic optimization method [Reference Raju, Gupta, Bhanot and Sharma24], characterized by a fitness function that offers a broad range of adaptability to various optimization challenges. Key components of the algorithm include the chemotaxis operator, which enhances local search accuracy; the reproduction operator, which accelerates population convergence; and the elimination-dispersion operator, which helps to avoid local minima while improving the algorithm’s ability to seek global optimization [Reference Dhaliwal and Pattnaik25, Reference Devi and Geethanjali26]. Consequently, BFO is extensively applied across diverse fields, including function optimization, image processing, and engineering optimization [Reference Kalaivani, Maheswari, Vigneshwaran, Karthick, Kathirvelu and Marquez27–Reference Manjula, Kalaivani, Gengaraj, Maheswari, Vimal and Kadry30]. Traditional BFO has been employed in the domain of path planning to identify the shortest routes [Reference Long, Zuo, Su, Li and Zhang31–Reference Long, Su, Shi, Zuo and Li33]. However, these algorithms do not consider energy consumption. The hull design and energy supply methods of USVs significantly influence their endurance, making it challenging to make adjustments in the later stages of development. Additionally, the complexities of the navigation environment and the diverse mission requirements impose greater demands on the endurance of USVs. To facilitate the smooth berthing of USVs in scenarios of insufficient energy, this paper presents a novel berthing planning scheme, termed MC-BFO. This scheme incorporates environmental factors to minimize energy consumption and simplifies the berthing path through various constraints, thereby enhancing berthing efficiency. The new fitness function is obtained by integrating the reward function with the updated energy consumption model. This fitness serves as a metric for assessing individual strengths and weaknesses, facilitating the optimization process of the algorithm. Additionally, new constraints are introduced regarding the heading and speed of the USV in proximity to the berthage, a modification that enhances the safety margin during the berthing process. Lastly, the frequency of changes in the USV’s sailing posture is utilized as a constraint to ensure that the resulting path is smoother and more rational.
The remainder of this paper is organized as follows: Section 2 develops the environmental model, describing the 2D planar motion coordinate system for the USV and its energy consumption model. Section 3 outlines the BFO algorithm and function optimization, while also describing the automatic berthing planning scheme for the USV. Section 4 presents simulation experiments conducted both downwind and upwind across three simulated environments, followed by a comparison and analysis of the experimental results. Finally, Section 5 concludes with a summary and outlook.
2. Mathematical modeling of USV
2.1. Environmental model
Grid maps offer several advantages in map modeling. They discretize the planning area into a finite number of grids, which can effectively store spatial information about the environment and achieve the desired map accuracy by utilizing grids of varying resolutions. Additionally, grid maps significantly simplify the search space, thereby enhancing the efficiency of path planning [Reference Zhang, Guo, Andriukaitis, Li, Królczyk and Li34, Reference Yang, Wang and Wang35].
In the grid map, the grid cell occupied by the USV serves as the central node, while the adjacent cells are designated as alternative nodes for subsequent movement. The USV must select a node that is free of obstacles and exhibits either the lowest energy consumption in windy conditions or the shortest distance to the target location in calm conditions. Additionally, if an obstacle does not completely occupy a grid cell, that node is included in the contraindication table to ensure sufficient safety margins for the USV, thereby allowing it to avoid potentially hazardous situations such as shallow waters or reefs. The relationship between the index value S and its corresponding coordinates
 $(x,y)$
within the grid environment is represented as follows:
 \begin{equation} \begin{bmatrix}x\\y\end{bmatrix}=\begin{bmatrix}\mathrm{mod}\left (S-1,n\right )\\-\mathrm{ceil}\left (S/n\right )\end{bmatrix}+\begin{bmatrix}0\\n\end{bmatrix}+\begin{bmatrix}0.5\\0.5\end{bmatrix} \end{equation}
where the modulus operation, denoted as ‘mod’, yields the remainder following the division of two numbers. Conversely, the ceiling function, denoted as ‘ceil’, rounds a given number upwards to the nearest integer that is greater than or equal to the original value.
2.2. Wind load model
The water surface resistance experienced by the USV during travel comprises friction resistance, eddy resistance, and wave resistance. Friction resistance is proportional to the square of the vehicle’s speed, while both eddy resistance and wave resistance increase with rising speed. Additionally, the water surface resistance is influenced by the structural parameters of the hull [Reference Lv, Yu, Chen, Zhao and Chi36]. Given that the water surface environment in the berthing area is relatively stable, the water surface resistance is treated as a variable that is speed-dependent in the energy consumption calculations [Reference Monex and Kumar37]. Taking into account the effects of wind load and the power of the USV, three degrees of freedom are analyzed: surge, sway, and yaw [Reference Wang and Li38]. The forces and moments associated with these three degrees of freedom from the incompressible Bernoulli equation [Reference Gu, Zhou, Wen, Xiao and Knoll39] are derived as follows:
 \begin{equation} \begin{cases}X_{wind}=\frac {1}{2}\rho _{a}S_{fp}V_{vw}^{2}A_{wx}\left (\theta _{w}\right )\\[3pt] Y_{wind}=\frac {1}{2}\rho _{a}S_{sp}V_{vw}^{2}A_{wy}\left (\theta _{w}\right )\\[3pt] N_{wind}=\frac {1}{2}\rho _{a}S_{sp}V_{vw}^{2}A_{wn}\left (\theta _{w}\right )L_{oa} \end{cases} \end{equation}
where
 $X_{wind}$
,
 $Y_{wind}$
,
 $N_{wind}$
represent the transverse force, longitudinal force, and overall force acting on the hull, respectively.
 $\rho _a$
denotes the air density, while
 $S_{fp}$
and
 $S_{sp}$
signify the projected area of the hull.
 $V_{vw}$
indicates the relative wind speed, and
 $L_{oa}$
represents the total length of the hull. Additionally,
 $A_{wx}(\theta _{w})$
,
 $A_{wy}(\theta _{w})$
, and
 $A_{wn}(\theta _{w})$
are the wind resistance coefficients in the transverse, longitudinal, and vertical directions, respectively. Lastly,
 $\theta _{w}$
is the angle between the apparent wind (relative wind) and the USV.
Coordinate system.

Data storage model.

Non-constant wind was employed as a disturbance factor, with varying wind speeds and directions at different locations. As illustrated in Figure 1, the true wind direction is defined, with
 $0^\circ$
representing north winds,
 $90^\circ$
representing east winds, and continuing in a clockwise manner, ranging from
 $0^\circ$
to
 $360^\circ$
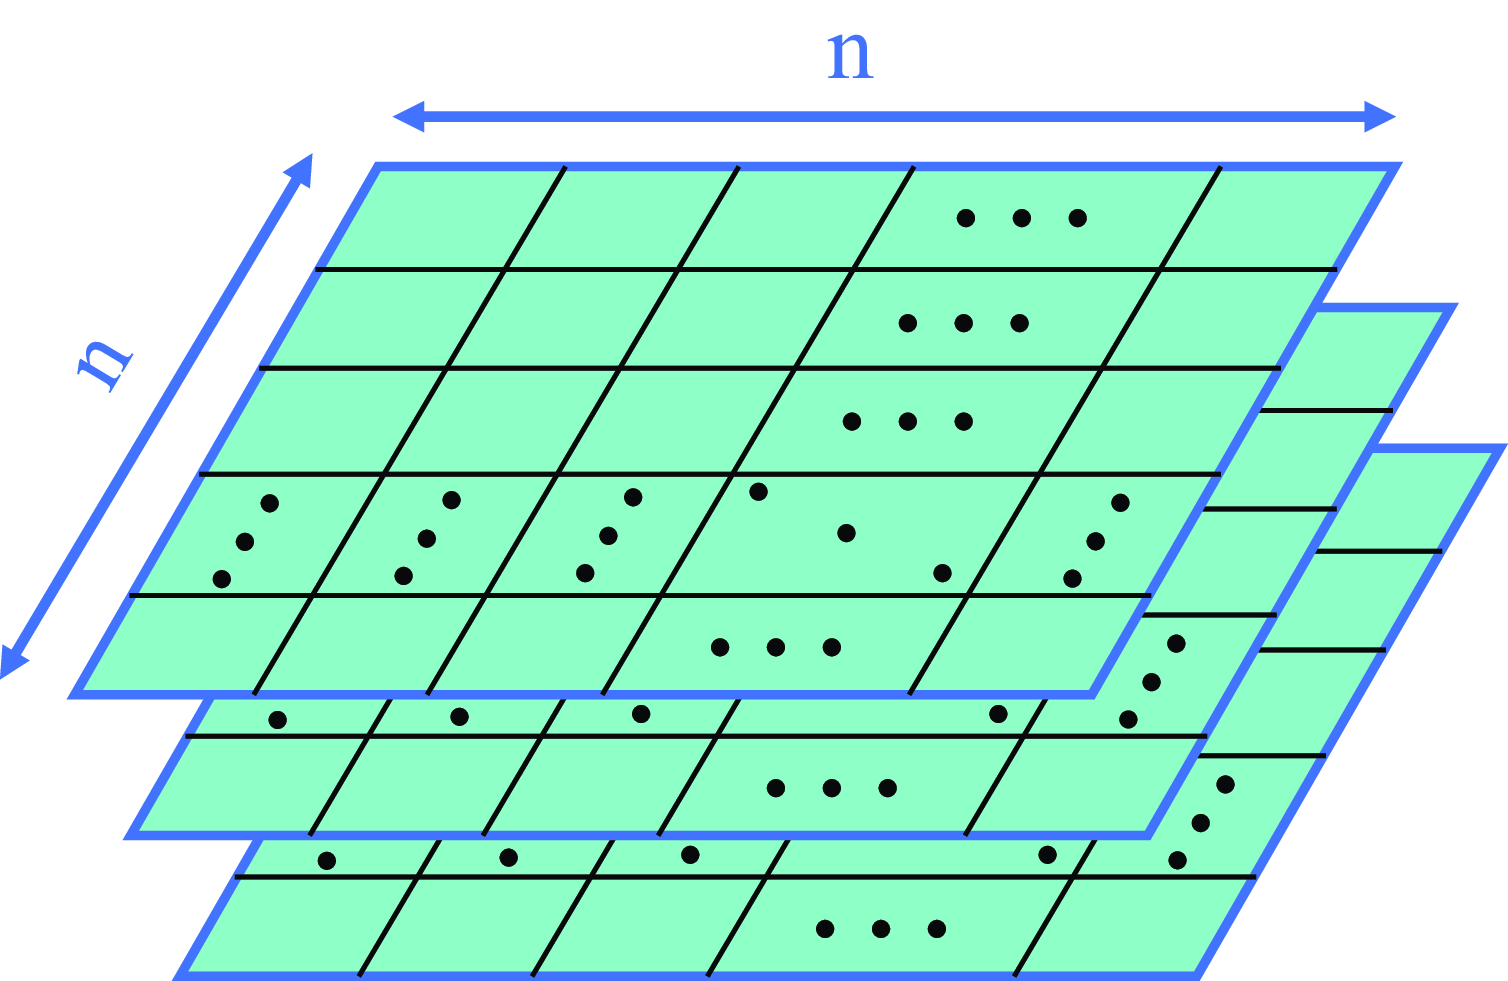
. As illustrated in Figure 2, a three-dimensional data storage model is established using three channels to store environmental information, specifically obstacle data, wind speed, and wind direction. This approach enhances the fitting of distribution patterns across various wind speed intervals. The vector relationship between the true wind and the apparent wind is described as follows:
 \begin{equation} V_{vw} + V_{usv} = V_{rw} \end{equation}
where the apparent wind and true wind are represented by
 $V_{vw}$
and
 $V_{rw}$
, respectively, while the speed of the USV is denoted as
 $V_{usv}$
.
In the coordinate system illustrated in Figure 1, the heading angle of the USV on the map is represented by
 $\phi$
. The previous node serves as the starting point of the vector, while the current node acts as the endpoint. Consequently, the vector angle corresponds to the heading angle of the USV along that segment of the path. The motion state of the USV within the grid map is denoted as
 $(x_i,y_i,\phi _i)$
. The true wind is transformed from the inertial coordinate system to the attached coordinate system, resulting in the two components
 $u_{vw}$
and
 $v_{vw}$
of the apparent wind in the attached coordinate system, and the expression is as follows:
 \begin{equation} \left \{\begin{array}{llllllllll}{{u_{{\mathrm{rw}}}=-u+V_{{\scriptscriptstyle {rw}}}\cos (\theta _{{\mathrm{rw}}}-\varphi )}}\\ {{u_{vw}=-v+V_{{\scriptscriptstyle {rw}}}\cos (\theta _{{\mathrm{rw}}}-\varphi )}}\end{array}\right . \end{equation}
where
 $u$
and
 $v$
represent the USV’s speed in the attached coordinate system.
 $\theta _{rw}$
denotes the true wind direction.
It is important to note that
 $\theta _w$
is considered positive when the wind chord is oriented to the left. The magnitude of the apparent wind and the wind chord angle,
 $\theta _w$
, can be described as follows:
 \begin{align}&\qquad\qquad\qquad V_{vw}^2=u_{vw}^2+v_{vw}^2 \end{align}
 \begin{align}& \theta _w=\left \{\begin{array}{llllllllll}{{{\displaystyle \arctan \frac {V_{rw}}{u_{rw}}}}} & {{{\displaystyle u_{rw}\lt 0}}} \\ \\ {{{\displaystyle \arctan \frac {V_{rw}}{u_{rw}}-\pi \operatorname {sgn}(\nu _{rw})}}} & {{{\displaystyle u_{rw}\geq 0}}}\end{array}\right . \end{align}
2.3. Energy consumption modeling
In this paper, the energy consumption of the USV is categorized into two components: the energy required to overcome environmental resistance, specifically wind load, and the reaction force exerted by the water surface on the hull. The total energy consumption of the USV during travel can be determined using Eq. (7). To maximize the efficiency of energy use while ensuring task completion, it is essential to leverage natural forces that facilitate navigation, thereby effectively reducing overall energy consumption. Eqs. (8) and (9) indicate that the energy required for the USV to overcome water resistance is denoted as E1, while E2 represents the energy required to counteract wind resistance. The energy consumption data E1 for the subsequent drivable node at each position is stored in the adjacency matrix A1, whereas E2 is recorded in the adjacency matrix A2. The expressions are as follows:
 \begin{align}&\qquad\qquad\quad E=\alpha E_{1}+\beta E_{2} \end{align}
 \begin{align}& E_1=\int _0^tP_c(t)\;dt\qquad E_2=\int _0^tP_w(t)\;dt \end{align}
 \begin{align}&\qquad\qquad\,\,\, P(t)=F(t)V_{usv}(t) \end{align}
where
 $\alpha$
and
 $\beta$
represent the weighting parameter.
 $P_c$
and
 $P_w$
denote the power consumed by the USV to counteract water surface resistance and wind resistance, respectively.
 $F$
signifies the longitudinal force acting on the USV.
Combined parameter analysis of energy consumption models.

Due to the gentle water current in the berthing area and the stable power output of the USV, it is assumed that the USV travels at a constant speed in this region, except when influenced by wind. Consequently, the frictional resistance between the water surface and the hull is treated as a constant value. As the USV maintains a constant speed, a shorter travel path results in a smaller value for E1. To reduce E2 in the presence of wind interference, it is essential to take into account the actual wind speed and direction, indicating that the shortest path may not be the optimal objective. However, for the computations to converge and enable the USV to reach its destination, it is necessary to employ the heuristic distance as a constraint. In the actual driving scenario, E1 is significantly larger than E2. To mitigate the dominance of E1 in the calculations, a weighted average approach is employed, incorporating weighted values and preprocessing of the data. This method enhances the differentiation of the fitness for each node, thereby benefiting the probabilistic search methods utilized by the algorithm. Both downwind and upwind paths are flexibly selected to optimize energy consumption, resulting in more reasonable routing. Furthermore, the value of
 $\alpha$
must be less than 0.5 to enhance the sensitivity of the USV to wind. Under these constraints, a one-factor experimental design method is implemented to investigate the impact of the parameter combinations on the experimental outcomes. As illustrated in Figure 3, Sailing Posture Changes and the Maximum Steering Angle of the USV are analyzed separately. A total of 20 samples are collected for averaging during periods when the USV can effectively harness the wind [Reference Gao, Li, Liu, Ge and Song40]. The experimental results indicate that with parameters
 $\alpha =0.35$
,
 $\beta =0.65$
the USV demonstrates increased sensitivity to wind and improved path smoothness.
3. Berthing program
3.1. Bacterial foraging optimization algorithm and function optimization
The BFO is a novel bionic class of algorithms proposed by K.M. Passino, inspired by the foraging behavior of E. coli. Bacteria tend to swim towards nutrient-rich areas and frequently flip when encountering unfavorable conditions. These behaviors are facilitated by flagella, which are integral to chemotaxis operation. The chemotaxis operation is central to the BFO, as it makes decisions based on comparisons, determining whether the bacteria should flip or swim. Therefore, the configuration of the chemotaxis operator is crucial for the effective convergence of the BFO. Upon the completion of the chemotaxis life cycle, when bacteria have sufficient nutrients, grow in size, and the environmental conditions are favorable, they undergo a process of binary fission, resulting in the formation of two new bacterial cells. This reproductive process not only regenerates a more energetic subset of the population but also tends to maintain the population size at an even number. Moreover, this propagation mechanism is linked to enhanced population quality and accelerated convergence performance among the bacteria. The elimination-dispersion operation is implemented in response to a sudden change in the environment or an attack on the colony that results in the death of some bacteria or their relocation to a new environment. This operation assesses the decision to relocate an individual by comparing a random number with the migration probability. Consequently, this operation enhances the algorithm’s capacity for global optimization [Reference Passino41].
The introduction of weight ratios in the energy consumption model alters the original fitness, which was solely based on distance. This modification encourages individuals to prioritize low-energy nodes, potentially leading them to deviate from the target node. When the E2 percentage is excessively high, USVs may continuously pursue the wind, resulting in slower convergence of computations or, in some cases, failure to converge altogether. Reward value serves as a feedback mechanism in the Markov decision-making process, where its magnitude is utilized to evaluate the quality of an intelligent agent’s action choices. To enhance result orientation, the reward function in reinforcement learning is introduced. In this context, the USV acts as the intelligent agent, and an energy consumption reward is devised based on the node where the USV is located after executing an action. If the distance from the USV’s current node to the target node is less than the distance from the previous node to the target node, a reward is granted; otherwise, a penalty is imposed. Consequently, the optimal path is identified as the one yielding the highest reward value. The incorporation of the reward function not only accelerates convergence but also ensures sample diversity. The reward function is formulated as follows:
 \begin{equation} r=\left \{\begin{array}{llllllllll}{{1/dist_i,\quad if dist_i\lt dist_{i-1}}}\\ {{-1/dist_i,\quad \quad otherwise}}\end{array}\right . \end{equation}
where
 $dist_i$
represents the distance from the USV’s current optional node to the target node, and
 $dist_{i-1}$
denotes the distance from the previous node to the target node.
Using a gradient strategy, among all the optional nodes in the subsequent step, the node that, after taking the action, has the shortest distance to the target node will receive the highest reward for this action. If
 $dist_i\lt dist_{i-1}$
, although this may not be the optimal choice, it will yield a relatively small reward value. The optimal path does not encourage the USV to travel in the opposite direction of the goal node; thus, if
 $dist_i\gt dist_{i-1}$
, this action will incur a penalty. Furthermore, in the context of global search, which also involves non-stationary rewards, receiving a smaller reward value when farther from the target node is advantageous for maintaining population diversity in the early stages of the algorithm, allowing for exploration of more unoccupied areas. As the USV approaches the target node and receives a larger reward value, this can enhance endpoint orientation and ultimately prompt the algorithm to converge.
Each step in this decision-making algorithm is linked to the fitness. Consequently, a new function for calculating the fitness is employed in the new application scenario. The fitness of the selectable nodes is derived from Eq. (11), and the initial paths are determined using a probabilistic selection method during the initialization phase. The expression is as follows:
 \begin{equation} fitness{{}}\left (i,j\right )=E(i,j)+\lambda r(i,j) \end{equation}
where
 $fitness$
is an indicator of individual merit.
 $\lambda$
denotes the equilibrium parameter. To ensure the proper functioning of the roulette wheel selection method during the initialization of the population,
 $\lambda$
is set to 20.
3.2. Trajectory constraints within the berth
While the natural environment near the berthing area is relatively favorable, uncertainties persist due to the movement of ships entering and leaving the harbor, as well as irregularities in the management of the berthing area. To mitigate the risk of accidents, the USV must reduce its traveling speed. In scenarios of insufficient energy, the power distribution between the propellers may not achieve optimal results, complicating challenging berthing maneuvers, such as continuous turning or executing large angle turns within a confined space. Consequently, it is essential to plan a simple and efficient berthing path.
When the USV approaches the berthing area, it is essential to impose constraints not only on energy consumption and path length but also on the change in the heading. Specifically, the steering angle of the USV must be kept below
 $45^\circ$
, which enhances the controller’s effectiveness and results in a smoother path. Upon reaching the designated docking point, the speed should ideally be reduced to zero. However, different routes will be planned based on varying practical situations within the berthing area. Consequently, the concept of equal proportional reduction, which is based on the number of nodes in the path under the same constraints, will ensure that the speed is reduced by a consistent amount across each segment of the path. The speed constraint of the USV can be expressed as follows:
 \begin{equation} V_{i}=\frac {N_{s}-N_{p i}}{N_{s}-N_{p k}}V_{k} \end{equation}
where
 $V_i$
denotes the speed of the USV upon reaching the
 $i-th$
node,
 $N_s$
represents the total number of nodes in the path,
 $N_{pi}$
indicates the number of nodes traveled so far,
 $N_{pk}$
signifies the number of nodes traversed upon entering the berthing area, and
 $V_k$
denotes the speed of the USV when it enters the berthing area.
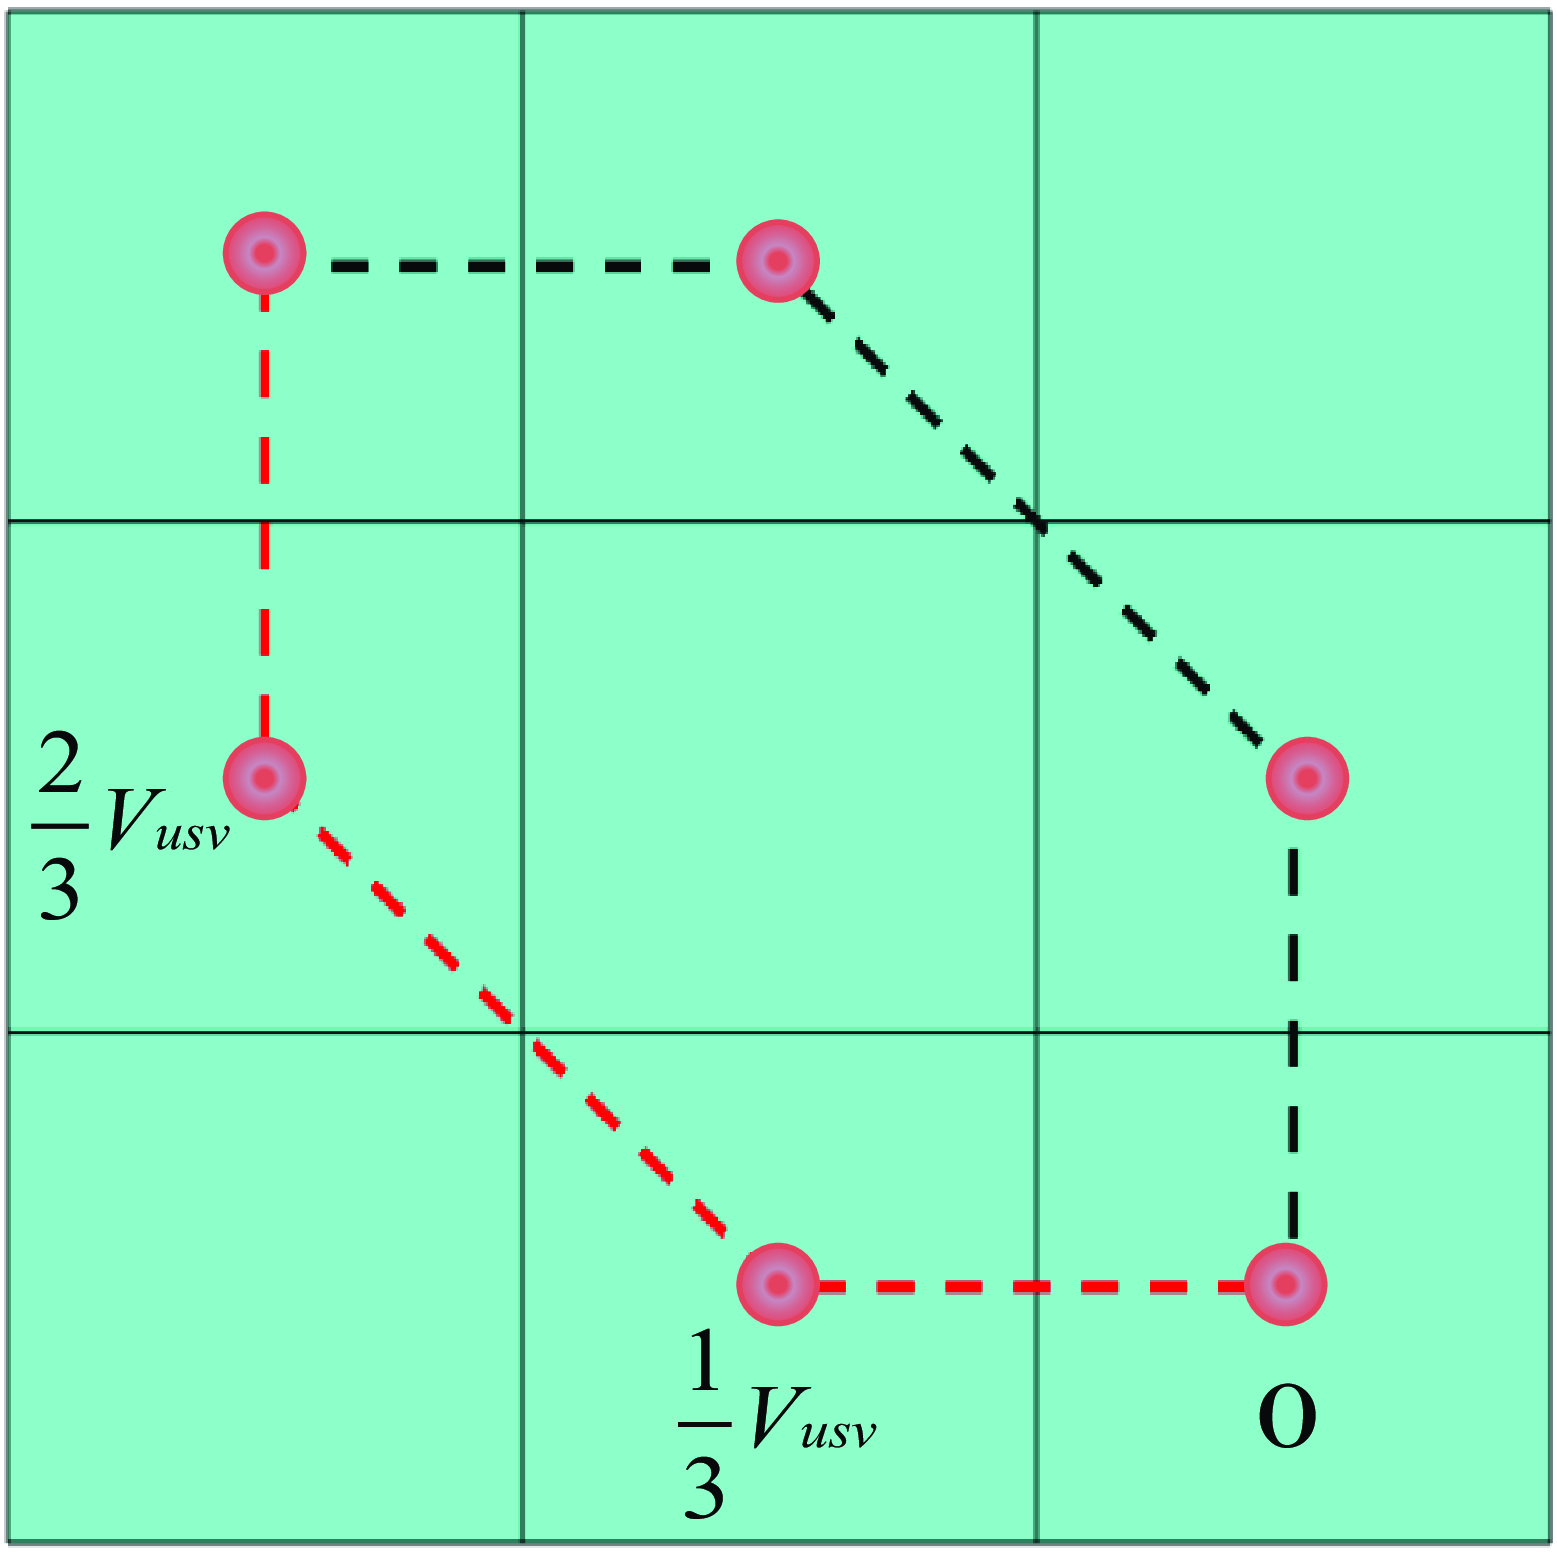
Due to the constraints of heading and speed, a portion of the trajectory of the USV as it enters the berthing area from the upper left corner is illustrated in Figure 4. Both trajectories consist of four nodes and three path segments, with the velocity required to be reduced by one-third in each segment of the path.
Bow restraint at berth.

The influence of natural factors on path planning is significant, particularly regarding the berthing capabilities of the USV in environments with obstacles. The effectiveness of the USV’s berthing ability is primarily determined by its obstacle perception and avoidance capabilities. By optimizing relevant parameters and imposing constraints on speed and heading, the proposed method enables the USV to smoothly berth at a designated position along a continuously curving path while successfully avoiding obstacles. This approach mitigates the risks associated with sharp turns or erratic pathways, thereby enhancing the stability and comfort of the USV during the berthing process. Furthermore, the constraints on speed and heading ensure that the USV adheres to a predetermined safe trajectory while berthing, maintaining a stable sailing posture and preventing swaying or course deviations caused by improper operation or external disturbances.
4. Simulation experiment
4.1. Generating paths
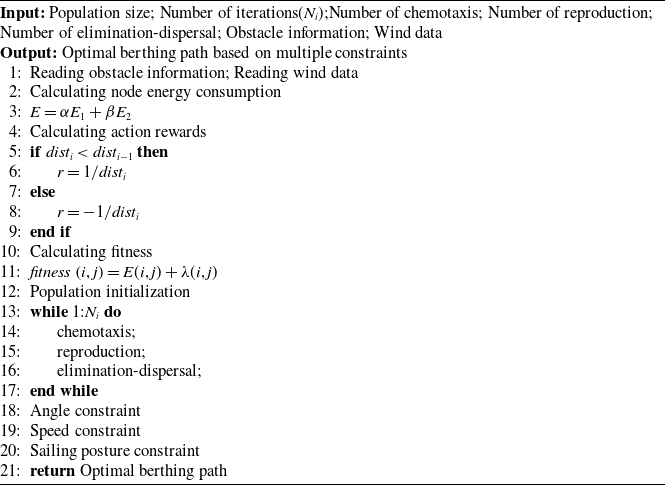
In the grid map, USV icon denotes the starting point, and USV dashed icon represents the endpoint. The red irregular objects symbolize obstacles, while the size and direction of the blue arrows indicate wind speed and direction, respectively. Figure 5 illustrates the lowest energy path, where the USV aims for the endpoint while searching for a route that leverages favorable winds, thereby conserving its energy output. Although the actual wind conditions are complex, a new fitness function can be assigned to each segment of the path to facilitate probabilistic selection. In Figure 5, the front part of the right-side route experiences a favorable wind direction, yet the wind speed is noticeably lower than that of the left-side route. Additionally, there exists a headwind section in the middle of the right-side route. Individuals often encounter challenges in selecting intersections, leading to increased confusion, and the initial population may include routes on the right side that are high in energy. However, after applying three operators and several constraints, optimal or relatively optimal individuals will emerge in the final population. The optimal path, referred to as MC-BFO, depicted in Figure 6, is determined by using the frequency of changes in the USV’s sailing posture as a filtering criterion within the final population. The pseudo-code for MC-BFO is provided below. The energy consumption value for the path illustrated in Figure 6 is represented by a blue pentagram in Figure 8. Although this path does not exhibit the lowest energy consumption overall, it is relatively more efficient. Additionally, this path is smoother than the one with the lowest energy consumption, making it more suitable for the safe travel of the USV, particularly in scenarios involving limited energy and reduced control effectiveness. The path’s design is therefore more reasonable.
Minimum energy consumption berthing path.

Considering the smoothness of the berthing path.

A comparison of the data between the paths shown in Figure 5 and Figure 6 is presented in Table I. Figure 7 depicts the shortest path, and it is calculated that the path in Figure 5 consumes 40.49% less energy than that in Figure 7, while the path in Figure 6 consumes 36.50% less energy than the path in Figure 7.
Comparison of data between the optimal path and the lowest energy path.

Shortest berthing path.

Comparison of individual energy consumption of optimal and shortest paths.

A bacterial foraging optimization algorithm with multiple constraints (MC-BFO)

4.2. Experimental comparison
To verify the effectiveness of the proposed algorithm, simulation experiments were conducted using MATLAB 2016a (Windows 10, Intel(1R) Core (TM) i5–8300H CPU @ 2.30 GHz 2.30 GHz with 16G of RAM). Three experimental environments were established with grid map sizes of 20
 $\times$
20, 25
 $\times$
25, and 30
 $\times$
30. The ratio of obstacle area to map area remains consistent across these environments; however, the distribution of obstacles varies among them, as does the distribution of wind speed and direction. The paths planned by the MC-BFO, BFO, and GA are compared and analyzed under both downwind and upwind conditions.
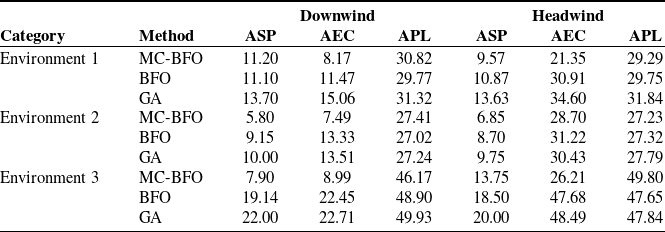
Figure 9 illustrates the optimal paths generated by the three algorithms across three environments under both downwind and upwind conditions (with start and end positions exchanged). In this figure, the red solid line represents the path generated by the MC-BFO, the gold dashed line corresponds to the BFO, and the black dotted line indicates the GA. Table II presents data on the average number of sailing posture (ASP), average energy consumption (AEC), and average path length (APL) for the three algorithms in the three environments. These metrics were obtained from 20 repetitions of the experiment conducted under both downwind and upwind conditions. The results indicate that the MC-BFO path exhibits fewer sailing posture changes across all three environments, resulting in a simpler and more efficient trajectory. Specifically, under downwind conditions in Environment 1, the MC-BFO path demonstrates a reduction of 28.77% in AEC compared to the BFO path and 45.75% compared to the GA path. In upwind conditions, the MC-BFO path achieves a 30.93% reduction in AEC relative to the BFO path and 38.29% compared to the GA path. In Environment 2, the MC-BFO path saves 43.81% in AEC when compared to the BFO path and 44.56% relative to the GA path under downwind conditions, while it saves 8.07% over the BFO path and 5.69% over the GA path in upwind conditions. In Environment 3, the MC-BFO path results in a 58.73% reduction in AEC compared to the BFO path and 64.09% compared to the GA path under downwind conditions, and a 45.29% reduction over the BFO path and 45.95% over the GA path under upwind conditions. These findings suggest that the USV conserves more energy during downwind travel compared to upwind travel. While the analysis of energy consumption is intricately linked to the energy model, the parameters of the USV itself, and the wind conditions, the MC-BFO path consistently consumes the least energy under identical map models and parameter settings. Regarding APL, the differences among the paths range from 0.3 to 8.01%, with the APL of the MC-BFO path being shorter, smoother, and more reasonable in certain areas with complex obstacles. This characteristic is advantageous for the USV’s safe navigation and smooth berthing, particularly during periods of energy scarcity.
Optimal berthing paths for different algorithms in each environment.

Comparison of performance parameters of various algorithms.

5. Conclusion
This paper addresses the challenges associated with automatic berthing for USV and the endurance issues encountered during the berthing process by proposing a MC-BFO approach for automatic berthing planning of USV. The study examines the impact of wind in the vicinity of the berthing area on the energy consumption of a USV, assuming that the drag exerted by the water surface on the USV is treated as a fixed effect. To assess the forces acting on the USV in various areas and to quantify energy losses, a wind resistance model and a novel energy consumption model are developed. A reward function is introduced to balance the extremes related to path length and to optimize the resulting trajectories. By integrating the reward function with the fitness function of the traditional BFO, a new fitness function is derived, enhancing data processing. This results in a higher quality of the original population, increased iteration speed, and an overall more efficient algorithm. Constraints are applied to the heading and speed of the USV during berthing, yielding a more coherent and reasonable path. Additionally, the issue of USV oscillation at the connection point is mitigated by avoiding segmental planning. The final stage of path selection refines the trajectory by choosing the path with the fewest number of changes in heading among those exhibiting below-average energy consumption. Finally, comparison experiments were conducted under various environmental maps. The results indicate that, in both downwind and upwind conditions, MC-BFO achieves the lowest average energy consumption for the planned paths when compared to BFO and GA. Additionally, it demonstrates superior performance in terms of the number of sailing postures and the overall path length. In conclusion, the path generated by the proposed algorithm exhibits significant energy-saving benefits and rationality, facilitating the smooth berthing of the USV.
The impact of wind on the lateral displacement of USVs will be addressed in future research to enhance the safety of USVs during real-world navigation. Additionally, the decision-making system should incorporate path-following algorithms, particularly a control model for the USV’s approach to berthing. Further investigation into these topics will be undertaken in subsequent studies.
Author contributions
Jiming Zhang: Writing – review & editing, Writing – original draft, Visualization, Validation, Supervision, Software, Resources, Methodology, Data curation, Conceptualization. Yang Long: Project administration, Funding acquisition, Conceptualization, Methodology, Supervision. Jiao Deng: Conceptualization, Methodology. Da Qiu: Methodology. Caihua Fang: Conceptualization, Methodology.
Financial support
The authors greatly acknowledge the support of the National Natural Science Foundation of China (Grant No. 52361045).
Competing interests
The authors declare that they have no known competing financial interests or personal relationships that could have appeared to influence the work reported in this paper.
Ethical approval
Not applicable.
Ethical considerations
The submitted work is original and has not been published elsewhere in any form or language.