Large-scale, prolonged contact between regionally diverse dialects often results in the mixing of a wide range of linguistic forms, followed by leveling, in which some forms are retained and others are lost. Interspeaker variation is expected to be high, whereas leveling is ongoing. Gradually, the community establishes stable linguistic norms and interspeaker variation drops (Kerswill & Trudgill, Reference Kerswill, Trudgill, Auer, Hinskens and Kerswill2005; Siegel, 1985; Trudgill, Reference Trudgill1986). Trudgill posited three broad chronological stages in contact-induced new dialect formation (Trudgill, Reference Trudgill and Jahr1998; Trudgill, Gordon, Lewis, & Maclagan, Reference Trudgill, Gordon, Lewis and Maclagan2000):
Stage 1: Adult migrants from different dialect regions come into contact and engage in “rudimentary leveling.”
Stage 2: The members of the first generation born into the dialect contact setting confront the absence of a single, stable dialect. As a result, they exhibit extremely high inter- and intra-speaker variability while continuing the leveling process.
Stage 3: In subsequent generations, leveling continues and a focused dialect may emerge.
This paper examines the gradual leveling of Southern Vowel Shift (SVS) features in the dialect contact setting of Raleigh, North Carolina. Large-scale migration of white-collar Northerners to Raleigh began during the 1960s. The data used here are a middle- and upper-class subset of a (to date) 250-speaker corpus of conversational English collected by the authors between 2008 and 2011. All speakers grew up in Raleigh. As the oldest speakers show robust participation in the SVS, and the youngest speakers exhibit no discernible participation, the data represent the full trajectory of the loss of Southern vowels in middle-class Raleigh. This paper's central goal is to examine in detail the changes in the front vowel system across apparent time, evaluating predictions made based on Trudgill's model. More generally, we aim to contribute to the growing body of research on the social dynamics of large-scale dialect contact, particularly the role of common urbanization phenomena, including economic segregation. Specifically, we find unexpectedly low inter- and intraspeaker variance among the middle and youngest age groups, and we attribute this in part to the geographic distance that isolates middle-and working-class populations from one another in urban centers, Raleigh included.
THE SVS IN RALEIGH, NORTH CAROLINA
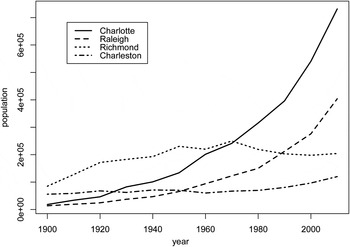
Raleigh, North Carolina, has housed large-scale contact between Southern and non-Southern dialects since the early 1960s, when migration to Raleigh from outside the South intensified. Urban areas in the Southern United States grew considerably as the result of post–World War II migration from the North (Abbott, Reference Abbott1987; Weinstein, Gross, & Rees, Reference Weinstein, Gross and Rees1985). In Raleigh, migration was bolstered as Research Triangle Park (RTP), a technology research center, began to grow and researchers migrated to the Raleigh area from both inside and outside the South. Although RTP was established as a research facility during the late 1950s, its growth accelerated in 1965 when IBM, among other large ventures, opened facilities. As of 2007, RTP had 39,000 employees, some of the largest employers being IBM, GlaxoSmithKline, and Cisco (Rohe, Reference Rohe2011:71–76). Raleigh's population growth has mirrored the development of RTP. Figure 1 compares population estimates for Raleigh over the course of the 20th century with those of other regional cities. Raleigh's population growth has resembled the exponential growth of Charlotte, the largest city in North Carolina and a banking industry center, rather than the relatively flat distributions of Richmond and Charleston (U.S. Census Bureau). The 2010 U.S. Census (the most recent available population data) lists the city of Raleigh's population as 403,892. A Raleigh city councilman, referring to the migration of affluent people to Raleigh from outside the South, observed that “they moved here from the Northeast, paid for their homes with cash, bought new cars, you name it” (Rohe, Reference Rohe2011:97). As of the 2000 census, only 56% of Raleigh residents were born in North Carolina (U.S. Census Bureau). The most intense growth has occurred in suburban Raleigh, particularly the expansive, middle-class northern suburbs (City of Raleigh Community Inventory Report).
Twentieth-century populations of four Southeastern cities.

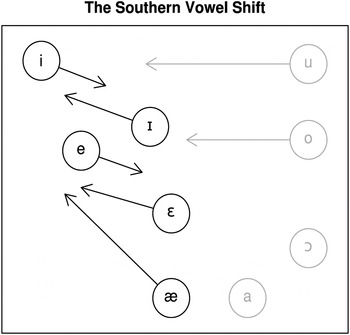
Until the last quarter of the 20th century, the dominant variety spoken in Raleigh featured the SVS (Labov, Reference Labov and Eckert1991; Labov, Ash, & Boberg, Reference Labov, Ash and Boberg2006). The SVS, which is found with considerable variability throughout the Southeastern United States, might have begun during the mid- to late-19th century (Bailey, Reference Bailey and Schneider1997). It has been documented in urban settings by Fridland (Reference Fridland2000, Reference Fridland2001, Reference Fridland2003) and Thomas (Reference Thomas2003) in Memphis and Houston, respectively, and by Labov et al. (Reference Labov, Ash and Boberg2006) in cities throughout the South. Whereas the SVS variably affects the entire vowel space, we focus here on the front vowels. Two frequently observed SVS processes operating in the front vowel system are the raising and fronting of the front lax nuclei, and the lowering and backing of the front tense nuclei (Figure 2). We exclude back vowel fronting from this analysis because, unlike the front vowel pattern, it is not unique to the SVS, having become pervasive in multiple U.S. dialects (Labov et al., Reference Labov, Ash and Boberg2006). We also exclude /aɪ/ monophthongization, the most iconic SVS feature, precisely because it is so iconic. We are interested in the mechanisms of variation and change that operate prior to the stage—if it ever occurs—at which a variable reaches into public consciousness; certainly most variables never achieve the higher orders of social indexicality (Johnstone, Andrus, & Danielson, Reference Johnstone, Andrus and Danielson2006; Silverstein, Reference Silverstein2003) that /aɪ/ monophthongization has reached. In Labov's (Reference Labov1972) terminology, the front elements of the SVS are indicators or perhaps markers, but not stereotypes.
The Southern Vowel Shift, front vowels highlighted.

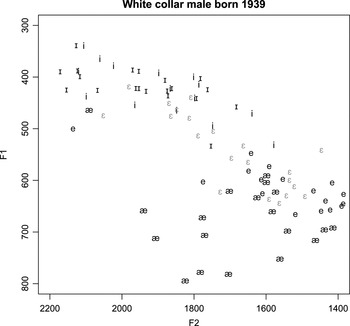
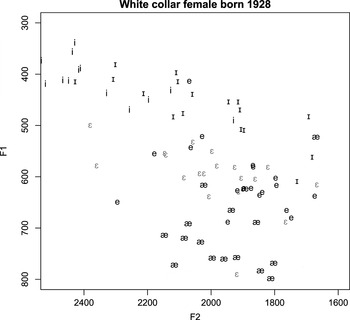
Labov et al. (Reference Labov, Ash and Boberg2006) found moderate Southern shifting in Raleigh, with /e/ occurring variably backer than, but always higher than, /ɛ/, and no reversal of /i/ and /ɪ/. Many of the speakers in our corpus, however, show more advanced Southern shifting, especially with respect to /e/ and /ɛ/. Figures 3 and 4 show front vowel spaces for two white, middle-class Raleigh speakers who finished high school prior to the development of RTP, and thus before large-scale contact with non-Southern varieties. Both speakers have overlapping /i/ and /ɪ/ nuclei, though there is not a clear reversal. However, for both speakers, /e/ clusters toward the low back area of the front vowel space, and the majority of /ɛ/ tokens are higher and fronter. Fridland (Reference Fridland2001) similarly found substantially more Southern shifting of /e/ and /ɛ/ than of the high front vowels in Memphis. Finally, /æ/ is widely dispersed for both speakers.
Front vowel space for a white-collar Raleigh man born in 1939.

Front vowel space for a white-collar Raleigh woman born in 1928.

Based on a negative correlation between population size and participation in the SVS, Labov et al. (Reference Labov, Ash and Boberg2006:253) concluded that SVS features are disappearing in urban areas. Raleigh contributes to this trend. SVS variants in the front vowel system are being eliminated or weakened, as shown in the following sections. Other distinctively Southern phonetic features are also missing or rare among young speakers, such as /aɪ/ and /ɔɪ/ monophthongization. Many of the young white-collar Raleigh speakers in our corpus exhibit the “pin/pen” merger, but this feature is present in many other regional dialects. As expected, young Raleigh speakers also lack distinctively northern phonetic forms, such as the fronting of the low back vowel as in “cot.”
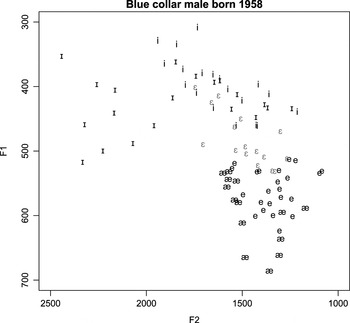
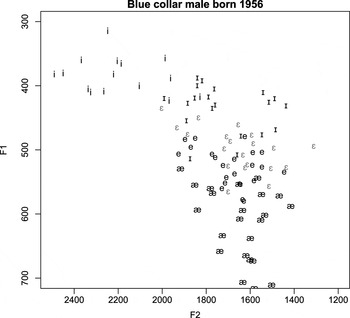
The Raleigh working class, however, appears to retain Southern features to a greater extent. Fridland (Reference Fridland2001:240) also found more advanced Southern shifting among upper working- and lower middle-class speakers than among the middle middle-class speakers in Memphis. Figure 5 shows the front nuclei for a working-class Raleigh man born in 1958. Many northern migrants arrived in Raleigh while he was in elementary school, but he lived in a working-class neighborhood in the city where contact with non-Southerners was relatively rare. His /ɪ/ is mostly fronter than /i/, and /ɛ/ is both higher and fronter than /e/. Finally, /æ/ is quite dispersed, with many tokens higher and fronter than /e/. Figure 6 shows a working-class man born in 1956. /i/ and /ɪ/ are mostly distinct and not reversed, but the /ɛ/ and /e/ nuclei occupy the same space. /æ/ is variably raised and fronted, as in Figure 5.
Front vowel space for a blue-collar Raleigh man born in 1958.

Front vowel space for a blue-collar Raleigh man born in 1956.

The retention of Southern vocalic forms in the working class appears to be a case of what Britain and Trudgill (Reference Britain and Trudgill2005) referred to as “sociostylistic reallocation.” Trudgill (Reference Trudgill1974) documented sociostylistic reallocation of the three surviving variants of the broom vowel in Norwich. They are class stratified, /u:/ being associated with the highest socioeconomic groups, probably because it is also the Received Pronunciation variant. Further, Watt (Reference Watt2002) described contact-induced dialect leveling in Tyneside English, such that local Tyneside variants of the face and goat vowels have come to be found primarily among working-class men. The confinement of an entire vowel shift to a particular corner of the social space, at least temporarily, is also familiar, as in the case of the Northern Cities Chain Shift being led by urban or working-class speakers (Eckert, Reference Eckert2000; Labov et al., Reference Labov, Ash and Boberg2006; Roeder, Reference Roeder2006). As Fridland (Reference Fridland2001:243) noted, “the association of predominantly male or lower class groups with vowel changes that serve a contrastive function to larger prestige norms, indexing speakers as members of a more local speech network, is in fact a fairly common finding in sociolinguistic literature.” In addition, Southern U.S. dialects are popularly associated with a range of negative personal characteristics, including lack of education and/or intelligence, and they are rated very low on “correctness” scales (Preston, Reference Preston1989, Reference Preston2003). Middle-class–oriented teenagers confronted with multiple dialects therefore have strong motivation to choose non-Southern forms. Fridland (Reference Fridland2001) and Thomas (Reference Thomas1997) posited the avoidance of “Southernness” as factors in social differentiation with respect to the SVS in Memphis and urban centers in Texas, respectively.
In the following sections, we investigate the white-collar reversal of the SVS, asking when it began, how quickly it has progressed, and to what extent there is inter- and intraspeaker variance as it progresses.
DATA AND METHODS
The quantitative analysis of change over time uses data from conversational interviews with 59 white speakers who grew up in Raleigh. The interviews were all conducted between 2008 and 2011 and were recorded on a solid-state recorder (Marantz PMD 660) with a lavalier microphone. The interviewers were the authors of this paper, both of whom have native South Midland dialects. The interviews are semistructured and took place in speakers’ homes or in a university office, with just the individual speaker and the interviewer present. The interviews cover a wide range of topics, but topics found in every interview include speakers’ experiences growing up in Raleigh, changes that Raleigh has undergone, and family members. Between 15 and 20 closed-syllable tokens per speaker of each front vowel were measured using Praat at 25%, 50%, and 75% of each vowel's duration (Boersma & Weenik, Reference Boersma and Weenink2012). Formant measurements were normalized using Lobanov's (Reference Lobanov1971) method.
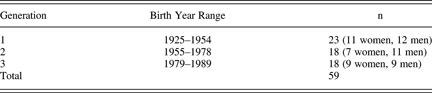
The speakers were grouped into three generations as shown in Table 1. Here, generation corresponds to three periods in Raleigh's history that offered distinct experiences, particularly with respect to elementary school and high school social networks. The choices of 1955 and 1979 as the year-of-birth boundaries between generations was informed by the city's growth history. Speakers in generation 1 were born before 1955 and finished elementary school before RTP's major period of growth, though they saw substantial migration from surrounding rural areas and from the Southeastern United States. The speakers in this group all attended one of the city high schools near downtown, as the first public suburban high school in Raleigh did not open until 1968. The oldest generation 1 speaker was born in 1923, the youngest in 1954. When asked, all of the generation 1 speakers reported that they self-identify as “Southern,” and they often drew an explicit association between Southernness and friendliness or politeness, and/or a relaxed lifestyle. Generation 2 speakers, born between 1955 and 1978, completed all or most of their school years before the opening of the second public suburban high school, which opened in 1993 and marks continued suburban development. Two of the youngest members of this group are the children of middle-class migrants who moved to Raleigh from the northern or midwestern United States. Several generation 2 speakers lived near downtown during early childhood and then moved to the suburbs before high school. These speakers have had lifelong or near-lifelong exposure to dialects that are considered more “educated” or “correct” by these speakers’ own descriptions, and most of them did not self-identify as Southern when asked, citing alienation from various aspects of Southern culture. The generation 3 speakers, born between 1979 and 1989, grew up surrounded by a regionally heterogeneous middle-class population. Only four of the speakers in this group grew up inside the 1950 city limits, the rest in the expansive suburban developments on incorporated land. The three study generations do not correspond precisely to familial generations because generations 1 and 2 both encompass a wide temporal range, such that many of the generation 2 members are too young to be the parents of generation 3.
White-collar Raleigh speakers in each generation
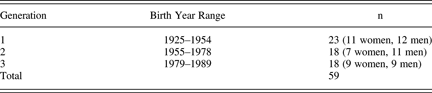
All of the speakers included in the quantitative analysis (Table 1) are white-collar, as determined by their current occupations or, in the case of the youngest speakers, their parents’ occupations. All of the youngest speakers were college students at the time they were interviewed. No blue-collar speakers, defined as those whose occupations require primarily manual labor (and not, e.g., clerical labor), were included in the quantitative analysis. Seven of the generation 1 speakers grew up in working-class families, though they are white-collar as adults. These seven speakers show no significant differences from the other speakers in generation 1.
Change across apparent time was evaluated using linear mixed effects models; this method being chosen to accommodate the random effect of speaker. The dependent variable is normalized F2 at the nucleus, this being a more robust axis of change than F1, as shown. All models included the following fixed effects: preceding place, preceding manner, preceding voice, following place, following manner, following voice, duration, sex of speaker, and generation or year of birth. (Generation and year of birth were used in separate models as alternate ways of operationalizing apparent time.) Subsequently, mixed models were carried out for each generation separately to compare linguistic factors across the generations. There is no “Southern identity” variable in any of the models because, as noted, the generation 2 and 3 speakers do not generally consider themselves Southern, whereas all of the generation 1 speakers do.
MAGNITUDE OF CHANGE, SPEED OF CHANGE, AND VARIANCE
Predictions
Based on both Trudgill's model and previous dialect contact findings, we made two main predictions:
Prediction 1: Shift away from SVS variants will first be visible in generation 2 and more advanced in generation 3
Generation 2 is the first generation born into the contact setting, in Trudgill's terms, and so we predict a “mixed,” intermediate dialect that differs from both the previous Raleigh dialect and a non-Southern dialect. The SVS variants of the front vowels do not occur consistently in the United States outside of the South, and so they are predicted to be disfavored in a dialect contact setting as “marked regional forms” (Kerswill & Williams, Reference Kerswill and Williams2000). In predicting a further degree of leveling in generation 3, we are drawing on the fact that Raleigh was a well-established community at the time of contact. Although the suburban north Raleigh neighborhoods expanded largely as the result of migration from outside the South, the early migrants’ children attended the same schools, and often lived in the same neighborhoods, as the children of the Raleigh natives during the 1960s. Therefore, we expect some social and linguistic continuity between the indigenous population and generation 2 speakers. We expected this to show up empirically as a less-than-complete shift away from SVS forms in generation 2, continued in generation 3.
Prediction 2: Both interspeaker variation and intraspeaker variation will be higher in generation 2 than in generations 1 and 3
Following Trudgill's model, we expected considerable diffuseness in generation 2 as the result of the mixing of Northern and Southern children and adolescents and subsequently more inter- and intraspeaker uniformity in generation 3 as the result of further leveling of SVS forms. Generation 2 is predicted to show both greater variance and a larger number of outliers than generation 3.
Results
Prediction 1: Change over time
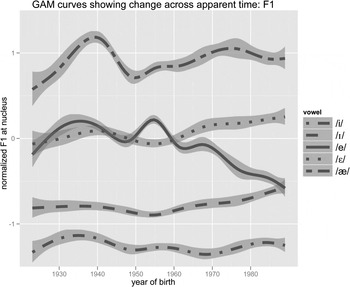
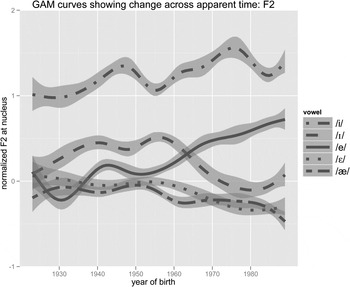
We first address the prediction that the front vowels began to shift away from SVS variants during generation 2 and continued into generation 3. Figures 7 and 8 give an overarching view of the change across apparent time for each vowel. The lines are generalized additive model (GAM) curves, conceptually similar to a series of local averages, generated with the geom_smooth function in the R graphics package ggplot2 (R Development Core Team, 2010). The data are consistent with the prediction that change began with generation 2. In Figure 8 in particular, the vowels begin a period of consistent change during the mid or late 1950s that continues past 1970. Although the SVS is not at its most advanced in Raleigh—for example, /i/ and /ɪ/ are never reversed in the aggregate—a gradual shift away from Southern variants is visible. /i/ and /ɪ/ begin divergent trajectories during the late 1950s. /e/ and /ɛ/ are not reliably distinct, and are sometimes reversed, until /e/ shifts frontward and /ɛ/ shifts backward beginning around 1955. Strikingly, /e/ crosses /ɪ/ during the early 1960s and subsequently remains the fronter and higher of the two vowels. /ɛ/ and /æ/ follow very similar trajectories, both shifting backward over time. They are consistently distinct only with respect to height and not frontness. Conversely, /e/ and /ɛ/ converge with respect to height as they are diverging in frontness. They also remain distinct insofar as /e/ is variably diphthongal.
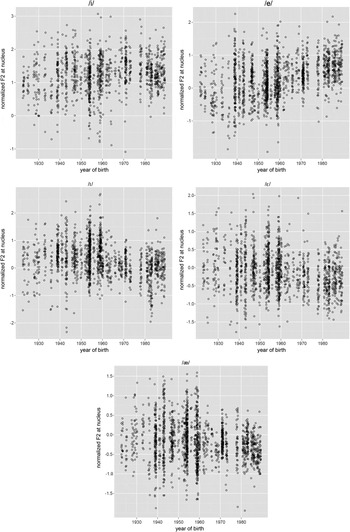
Figure 9 offers a detailed look at the data. Each circle represents a single vowel token, and the tokens have been jittered horizontally so that those lying close together in a given year of birth can be seen as distinct. The tense vowels (top row) show an expected rising of F2 over time, whereas in the case of the lax vowels (middle and bottom rows), F2 falls over time. In order to consider the leveling of SVS features, we compare the acoustic range of F2 in the 1940–1945 period, where there is more data than at earlier years, with the acoustic range of F2 after 1955. In all cases, the 1940–1945 range remains intact until approximately 1960, when the “Southern” edge of the range recedes. The majority of the data then occupies the less Southern half of the 1940–1945 range. In other words, generation 2—the first postcontact generation—began the process of eliminating Southern forms, and generation 3 continued it. This is consistent with our Prediction 1 and with Trudgill's model, in which a mixed variety begins to emerge in the first native-born generation. (In the context of Raleigh, mixed refers to the fact that the generation 2 front vowel system is intermediate between the generation 1 Southern system and a fully non-Southern system.) Further change is visible in generation 3, as “marked regional forms” are eliminated (Kerswill & Williams, Reference Kerswill and Williams2000:84). In addition, Figure 9 shows that the generation 3 speakers, who were born after 1979, have not advanced the range of F2 further from the Southern variants. Rather, they have simply narrowed the range of F2, restricting it to the non-Southern end of the generation 1 range. The only exception is /ɪ/, where the generation 3 speakers push the F2 range slightly lower than the bottom edge of the generation 1 range. For all other vowels, the generation 3 forms were already occurring, if rarely, in generation 1. The fact that non-Southern variants were already present in the community likely facilitated the early stages of leveling.
Change in F1 across continuous apparent time.

Change in F2 across continuous apparent time.

Scatterplots showing change across apparent time for each vowel. Individual circles represent vowel tokens.

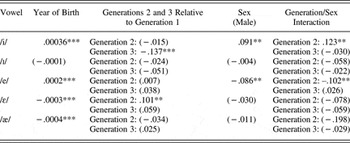
Table 2 shows coefficients and significance values for year of birth, generation, sex, and the interaction between generation and sex. Year of birth is highly significant other than in the model for /ɪ/. By contrast, generations 2 and 3 tend not to be significantly different from generation 1. The lack of significant generational effects results from the wide acoustic range for each vowel in generation 1, when both SVS variants and non-SVS variants were frequent. There is clear change over time, but the significance levels for generation are tempered by the large within-group variance in generation 1. Variance will be addressed further. Sex is significant for /i/ and /e/, but in different directions. In the case of /i/, men show higher F2 and are thus leading the shift away from SVS forms, but in the case of /e/, men lag behind women. The significant interactions between sex and generation for these vowels indicate that the male lead and lag, respectively, are stronger in generation 2 than in generation 1.
Coefficients from linear mixed models with (normalized) nucleus F2 as dependent measure

Note: Asterisks indicate significance levels: * = p <.05, ** = p <.01, *** = p <.001.
Based on Figures 7 to 9 and the results in Table 2, we can conclude that, with the possible exception of /ɪ/, the leveling of SVS variants has been in progress throughout the second half of the 20th century. Leveling began approximately with the speakers born between 1955 and 1960, who were the first to attend elementary school with children of the non-Southern migrants. Generation 3 speakers shifted further from SVS variants.
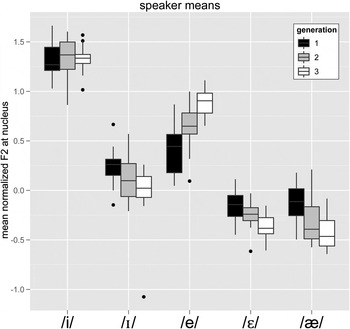
Figure 10 highlights the gradual leveling of SVS variants and retention of non-Southern variants. The five vowels are arranged on the x axis, and each vowel has three boxplots, one for each generation. The median values shift away from the Southern ends of the generation 1 F2 distribution over time (i.e., the medians fall for lax vowels and rise for tense vowels), indicating that the generation 2 speakers began the leveling of SVS features and the generation 3 speakers continued it. The /i/ median falls slightly between generations 2 and 3, but the lower end of the generation 2 range also disappears. Further, the whiskers on the generation 2 and 3 boxplots do not exceed those on the generation 1 boxplots, with the very slight exception of /ɪ/. Therefore, the variants used by the youngest speakers were already occurring, but were not the majority variants, among the oldest speakers.
Normalized F2 distributions for each vowel at each generation.

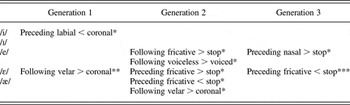
We made few specific predictions about internal factors because Labov et al. (Reference Labov, Ash and Boberg2006:254) found that, for the SVS, “the unit of chain shifting is not the allophone but the phoneme,” referring to the lack of consistent conditioning factors for the Southern shifting of /aɪ/ and the front tense vowels. However, we expected that following fricatives would exert a fronting effect on /æ/, as in half versus bat (cf. Labov et al., Reference Labov, Ash and Boberg2006:240). Further, following Labov (Reference Labov2007), we expected that any transmission of locally significant internal factors across generations would indicate linguistic continuity (Labov, Reference Labov2007). Table 3 shows the significant internal factors from mixed effects models for each generation separately. We conclude, first, that the SVS was constrained by very few significant internal factors in generation 1. Second, the few significant internal factors were not transmitted to generation 2 speakers as SVS forms were disappearing, nor are there shared internal factors between generations 2 and 3. Given that change was in progress during generations 2 and 3, the lack of shared internal factors is not unexpected.
Significant internal factors constraining normalized F2 at each generation

Note: Asterisks indicate significance levels. * = p <.05, ** = p <.01, *** = p <.001.
Prediction 2: Variance
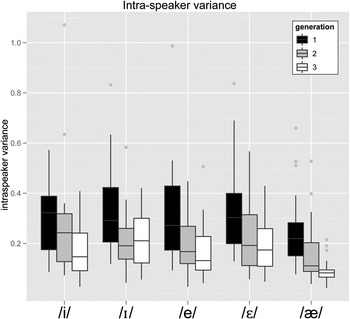
We have already seen in Figures 9 and 10 that generation 2 produces a narrower acoustic range of F2 values for each vowel than generation 1 does, and generation 3 shows a still narrower range. We consider variance directly in Figures 11 to 13. Figure 11 confirms that the overall group variance in generation 2 tends to be slightly lower than in generation 1, with the exception of /i/, and markedly lower in generation 3. Rather than showing wide variability as non-SVS forms became more prominent, generation 2 began the leveling process as a surprisingly uniform group. Evidence for this is shown in Figure 12, which plots interspeaker variance, defined as the variance of speaker means, for each vowel at each generation. High interspeaker variance would indicate that speakers’ mean values were spread out across the acoustic range rather than clustered together. We use the same scale for the y axis as in the overall variance graph (Figure 11) to highlight the relative lack of, and stability of, interspeaker variance over time. In general, interspeaker variance is similar between generations 1 and 2, dropping slightly at generation 3 for three of the five vowels. If generation 2 had shown the predicted between-speaker diffuseness, then the lines in Figure 12 would have had positive slopes between generations 1 and 2. Instead, they are markedly stable, even though change is in progress. Generation 3 shows even less interspeaker variance, with the exception of /ɪ/.
Overall variance.

Interspeaker variance.

Intraspeaker variance.

Figure 13 shows intraspeaker variance, which is calculated simply as variance for each speaker and plotted as a distribution for each generation and each vowel. Intraspeaker variance is higher than interspeaker variance partly because every individual speaker is subject to coarticulatory effects, which are obscured when speaker means are calculated. Contrary to our prediction, intraspeaker variance does not rise from generation 1 to generation 2. Rather, individual speakers in generation 2 have narrower F2 ranges than individual speakers in generation 1 do. The speakers in generation 2 not only shifted away from SVS variants with enough uniformity to maintain low interspeaker variance, but they also, as individuals, narrowed the F2 range for each vowel. That is, generation 2 showed inter- and intraspeaker uniformity even as change was taking place.
Outliers
Although generations 2 and 3 are strikingly uniform, there are some outlying speakers. Identifying these few outliers may point to the interactional mechanisms that have led to the elimination of SVS forms. On one hand, if the outliers in each generation are the oldest and youngest speakers, or those with the most and least exposure to SVS variants, then we can interpret the low inter- and intraspeaker variance as evidence that the loss of SVS forms is primarily a function of exposure, rather than of social indexicality. (This would not, of course, equate to denying that SVS forms carry social meaning, or that social indexicality contributes to community-level patterns.) On the other hand, the emergence of unexpected leaders or laggers would suggest that the low variance in generations 2 and 3 obscures socially meaningful patterns of variation within those generational groups. Therefore, we discuss the outlying speakers in turn. Figure 14 plots the distributions of speaker means at each generation, so that a single data point is the mean normalized F2 value for one speaker. We define outliers as speakers that are outlying points in the boxplots, that is, those whose mean values lie outside the interquartile range by more than 1.5 times the interquartile range. By this definition, there are very few outliers.
Distributions of mean F2 values for individual speakers.

In generation 1, the only outliers are with respect to /ɪ/: one high outlier and one low outlier. The high (= more Southern) outlier is a man born in 1939 who inherited the ownership and management of a city cafeteria that was once a center of social life. He recounts in his interview that even as Raleigh urbanized, his customers were mostly elderly Raleigh natives who had been going to the cafeteria for decades. We suspect, therefore, that this speaker had disproportionately frequent contact with elderly speakers throughout his life. The low (= less Southern) outlier for /ɪ/ is a woman born in 1954, the youngest speaker in generation 1.
Generation 2 also has only two outliers. The first, a low (= more Southern) outlier with respect to /e/, is a woman born in 1956. In addition to being one of the oldest generation 2 speakers, she grew up in a working-class neighborhood, though her father was a professional, and, unlike most of the other speakers, she has always held unskilled white-collar jobs. As noted above, we believe that the loss of the SVS has been most extreme in white-collar neighborhoods. The other generation 2 outlier has a low (= less Southern) F2 for /ɛ/. This is a man born in 1978, one of the youngest generation 2 speakers, and he spent several years at college in Virginia before returning to Raleigh.
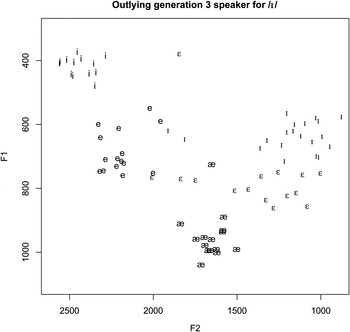
Generation 3 has a total of four outliers, three of which are outliers with respect to /i/. The two high (= less Southern) outliers with respect to /i/ are a woman and a man born in 1988 and 1989, respectively, two of the youngest speakers in the corpus. They both grew up in suburban northern Raleigh, an area that many locals describe as devoid of Southern cultural norms. Nevertheless, the female speaker spoke at length about her attempts during the past few years to fashion herself as more Southern or “country,” and so we find it surprising that she is, with respect to /i/, one of the least Southern speakers. Less puzzling is the low outlier for /i/, a woman born in 1983. In addition to being one of the oldest generation 3 speakers, she grew up inside the city of Raleigh, not in the suburban areas. The final, and most extreme, outlier is a low (= less Southern) outlier with respect to /ɪ/. As Figure 14 shows, her mean is quite distant from the other mean values for any generation. This speaker is a woman born in 1983 who grew up among the city of Raleigh's upper class. Her father owns a well-known, affluent business, and she married into another prominent longstanding Raleigh family. Her unusual front vowel space is shown in Figure 15. Whereas her /i/, /e/, and /æ/ are where we would expect for a speaker in this generation, the lax vowels /ɪ/ and /ɛ/, particularly /ɪ/, are much further back than expected. This is perceptually salient to our Midwestern ears. Her /ɪ/ sounds like /ɛ/ to us. She also has an unusually high (less Southern) /e/ mean of 1.11. We cannot be sure about her reasons (if any) for avoiding Southern variants, but we note that she grew up surrounded by the “old Raleigh” upper class, and she appears to be hypercorrecting in an attempt to avoid the associated Southern dialect.
Front vowels as produced by an outlying female speaker born in 1983.

In summary, most of the outliers are either the oldest or youngest speakers in their generations, and so with the exception of the speaker represented by Figure 15, they do not represent exceptions to the claim that SVS variants are being leveled uniformly in the white-collar community. Even the generation 3 speaker who actively fashions herself as “Southern” or “country” has a markedly non-Southern front vowel system.
Discussion of results
Our first prediction, that the SVS would begin to reverse in the white-collar community during generation 2 and continue into generation 3, is consistent with the data. A period of change appears to have begun between 1955 and 1960 and continued past 1980, and the birth-year effects are significant for all vowels other than /ɪ/. However, contrary to our second prediction, generation 2 shows considerably less intraspeaker variance than generation 1 does and approximately the same levels of interspeaker variance as generation 1 does. The low variance in generation 2 is surprising given that change was in progress, and it indicates that the emerging new dialect was relatively focused at its early stages. Leveling continued into generation 3.
The speed with which dialect features are leveled, and with which focusing occurs, is known to vary across dialect contact settings. Factors include the relative numbers of first-generation speakers from each dialect area, the ratio of children to adults, the structural similarity of the contributing dialects, and the social perceptions associated with each dialect. In Kerswill and Williams's (2000) account of the Milton Keynes contact setting, Principle 7 states: “From initial diffusion, focusing takes place over one or two generations” (101). However, as Kerswill and Williams noted, the process may take longer or remain incomplete in sparsely populated regions without regular contact among speakers. For example, Britain (Reference Britain, Boberg, Meyerhoff and Strassel1997) contended that the focusing of phonological variables in the English Fens, following migration to the area during the 17th century, was originally hindered by the lack of regular interaction among children, as compulsory education was not yet established. Mæhlum (Reference Mæhlum1997), cited in Kerswill and Trudgill (Reference Kerswill, Trudgill, Auer, Hinskens and Kerswill2005), similarly found an unfocused dialect setting in two northern Norwegian communities even 200 years after migration from the east. The reasons, Mæhlum suggested, are that speakers lived on isolated farms rather than in towns, and that some descendants of migrants maintained ties with eastern regions. Another example is the immigrant town of Høyanger, Norway, where the first native-born generation of speakers retained much of their parents’ linguistic variability and focusing accelerated in the following generation (Omdal, Reference Omdal1977). Kerswill (Reference Kerswill, Chambers, Trudgill and Schilling-Estes2002:690–691) explained:
It turns out that, in the early years of Høyanger's existence, there was considerable social segregation between the families of managers and professionals and those of the workers, with housing in different parts of the town. Crucially, while workers mainly came from the same county as Høyanger, the managers and professionals came from the east of the country. This meant that linguistic convergence between the two groups could only take place later, as social and geographic allegiances became more oriented toward the new community.
Finally, Trudgill's analysis of the children and grandchildren of the first European settlers in New Zealand similarly shows incomplete leveling during the first native-born generation (Trudgill, Reference Trudgill and Jahr1998; Trudgill et al., Reference Trudgill, Gordon, Lewis and Maclagan2000). The children of the first settlers (i.e., Stage II speakers, in Trudgill's model) show interspeaker and intraspeaker variability, mirroring to some extent the wide variability of input from multiple regions in the British Isles and Australia. By contrast, the grandchildren of the settlers (Stage III) exhibit a stable, focused dialect from which many of the input features have been leveled. Again, the lack of focusing during Stage II is attributed in part to the lack of regular interaction among children, as the population was not well-connected and education was not centralized.
When children have more regular interaction, it is possible for leveling and focusing to occur more quickly. Kerswill and Williams (Reference Kerswill and Williams2000) found significant focusing of phonological variables within the first native-born generation in the “new town” of Milton Keynes. The speakers in this generation, who are children at the time of recording and who live in two adjacent neighborhoods, have regular contact at school. Another probable reason for the quick focusing is that Milton Keynes lies in an already leveled dialect region, and so children have access to an established regional norm.
We suspect that a major factor underlying the quick shift away from SVS forms, and the relatively low variance in generation 2, is the close and regular contact between the locally born white-collar children and the children of early non-Southern migrants to Raleigh. As noted in the SVS section, the areas of Raleigh with the highest rate of population increase are suburban areas, particularly to the north. These neighborhoods are both closer to RTP and more affluent than the eastern and southern areas. Therefore, dialect contact was concentrated in those areas and was relatively rare elsewhere during the 1960s and early 1970s. We have two types of evidence for this hypothesis. The first is that the speakers in our corpus who grew up in working-class neighborhoods during the 1960s and 1970s, especially those who attended the eastern city high school during that period, report knowing very few, if any, children who had moved to Raleigh from outside the South. By contrast, speakers who grew up in more affluent neighborhoods at the time and went to the western city high school report being surrounded by non-Southerners. (The exceptions are speakers who grew up in upper-class families and kept to elite groups in high school, attending debutante balls and country club events. One—and only one—lifelong upper-class speaker born in 1955 even reports not being aware of the incoming children of Northerners during high school.)
A second type of evidence that white-collar children had more regular interaction with children of Northern migrants can be found in Dwyer's (2010) examination of five quantitative indicators of economic segregation in U.S. metropolitan areas based on Census 2000 data. Three of these are relevant for our purposes (Dwyer, Reference Dwyer2010:123):
1. Evenness/dissimilarity indicates “the percentage of the affluent that would have to move so that every tract would have the same ratio of affluent to poor families across the metropolitan area,” ranging from 0 (no segregation) to 1 (all affluent families would need to move).
2. Exposure/interaction is “the average proportion of the population that is poor in each tract weighted by the affluent population. The measure is commonly interpreted to capture the likelihood of contact between members of different groups.” Values range from 0 to 1, and values closer to 1 indicate greater exposure/interaction.
3. Clustering/spatial proximity is “the degree to which the affluent live in neighborhoods near other affluent neighborhoods versus near poor neighborhoods.” Values range from 0 to 1, with values closer to 1 indicating more segregation (unlike the exposure/interaction indicator, where high values indicate less segregation).
Table 4 shows Raleigh's score for each indicator as well as the means for all metropolitan areas combined. With respect to evenness/dissimilarity and exposure/interaction, both the Raleigh scores and the U.S. metropolitan mean scores indicate considerable economic segregation. In particular, Raleigh's low exposure/interaction score suggests that the children of affluent families have much more regular interaction with one another than with the children of working-class families. The low clustering scores—where 0 indicates no segregation—show that affluent and less-affluent neighborhoods may be adjacent to one another, but the affluent and nonaffluent are nevertheless segregated by tract. According to all three indicators, Raleigh is more economically segregated than the national metropolitan average. We can conclude that interaction among affluent people, which includes both migrants and native Raleigh residents, outpaces their interaction with the working class.
Three measures of economic segregation based on Census 2000 data

Source: Dwyer (Reference Dwyer2010).
The degree of interaction among speakers is an important factor in linguistic variation generally, not only in dialect contact settings. In one of the earliest detailed network-based studies of linguistic variation, Milroy (Reference Milroy1987:136) observed that high-density networks have been found to act as “norm enforcement mechanisms,” and in Belfast, a high network index score (indicating robust connections to the dense, multiplex working-class networks) correlates with one's use of conservative vernacular linguistic variants. Recent simulation work tests the viability of network-structural explanations for language change (e.g., Fagyal, Swarup, Escobar, Gasser, & Lakkaraju, Reference Fagyal, Swarup, Escobar, Gasser and Lakkaraju2010; Troutman, Clark, & Goldrick, Reference Troutman, Clark and Goldrick2008,) and new dialect emergence (Baxter, Blythe, Croft, & McKane, Reference Baxter, Blythe, Croft and McKane2009).
Whereas regular contact among middle-class children and adolescents has shifted the front vowel space, it also appears to have facilitated the shift from culturally Southern norms and ideologies to an urban culture. Third-wave studies of linguistic variation have argued that speakers linguistically construct various subjective aspects of personal and group identity, thereby contributing to patterns of language variation and change (Chun, Reference Chun2001; Eckert, Reference Eckert2000, Reference Eckert2008; Guy & Cutler, Reference Guy and Cutler2011; Hazen, Reference Hazen2002; Hoffman & Walker, Reference Hoffman and Walker2010; Mallinson, Reference Mallinson2006; Mendoza-Denton, Reference Mendoza-Denton1997, Reference Mendoza-Denton2008). Under this perspective, the reversal of the SVS is predicted to be a product of speakers’ strategic use of Southern and (increasingly) non-Southern variants, rather than simply reflecting diminishing exposure to Southern variants. Whereas speaker identity is, we expect, one of the factors underlying the shift away from SVS variants, we have not found clear evidence for it among this white-collar subset of the Raleigh corpus. If the construction of identity were the central motivating force, we would expect to find some outlying speakers whose front vowel systems were inconsistent with their age group or neighborhood. However, as we have shown, no such outliers emerged, with the possible exception of the speaker represented in Figure 15.
The lack of outliers does not refute the third-wave perspective, as all speakers may be choosing linguistic resources based on both frequency of exposure and interactional goals. Sex differences are often interpreted as evidence of linguistic resources serving identity construction (Coates, Reference Coates1993, Reference Coates1998; Eckert, Reference Eckert2000; Holmes, Reference Holmes1997). There are two significant sex effects in these data (Table 2). Men lead in the case of /i/ and lag in the case of /e/. A possible explanation is that the two vowels carry distinct social meanings, as Fridland (Reference Fridland2001) proposed for Memphis. An investigation of these vowels among the Raleigh working class, which we hypothesize to retain the SVS to a greater degree than the white-collar speakers do, could elucidate not only the sex effects but also the broader question as to the current social indexicality of the SVS in the urban South. The aggregate results we have shown here are intended as a basis for future investigation of the social distribution of Southern variants.