Although the scientific study of well-being is relatively new, the importance that humans have attributed to feeling good or to harboring feelings of happiness has its origins thousands of years ago and has influenced some of the most important theories of thought (McMahon, Reference McMahon2006). Among the factors that explain this universal desire to feel good, is the fact that our well-being plays an important role in emotional and behavioral self-regulation (Hervás & Vázquez, Reference Hervás and Vázquez2006). Precisely due to this central role in human functioning, well-being assessment is a very important task and, at the same time, a major scientific challenge.
Cognitive and affective components of well-being
In the study of psychological well-being, there is consensus on the need to distinguish, and evaluate separately, emotional and cognitive elements. This distinction is fully incorporated into the so-called concept of Subjective Well-being (SWB) -Diener, Oishi, and Lucas (Reference Diener, Oishi and Lucas2003) - which includes both the current emotional state and the more abstract evaluation of the degree of satisfaction with life. While the emotional state is variable and more focused on short-term experience, the second aspect refers to a broader (in terms of time) and more stable perspective. The emotional component is usually evaluated using instruments that assess the current positive and negative affective state (usually resulting in a single score where positive emotions are subtracted from the negative). For this purpose, widely used scales such as the Positive and Negative Affect Schedule (PANAS: Watson, Clark, & Tellegen, Reference Watson, Clark and Tellegen1988) are available. The life satisfaction component, which is more cognitive in nature, is usually assessed through self-report instruments. These instruments may consist of a single-item (e.g., “to what extent are you satisfied with the life you lead?” Very satisfied, fairly satisfied, not very satisfied, not satisfied; such item is used regularly in Eurobarometer surveys) or multiple-item questionnaires (for a review see Diener, Inglehart, & Tay, Reference Diener, Inglehart and Tay2013, and Vázquez, Reference Vázquez, Vázquez and Hervás2009).
From a conceptual point of view, Lucas, Diener, and Suh (Reference Lucas, Diener and Suh1996), using multitrait-multimethod procedures, showed that life satisfaction is separable from the affective components of well-being. Moreover, the distinction between cognitive and affective factors is very important as they are associated with different variables and predict different results. For example, while life satisfaction correlates closely with personal achievement and social circumstances such as personal education level, national or personal wealth (Diener, Kahneman, Arora, Harter, & Tov, Reference Diener, Kahneman, Arora, Harter, Tov and Diener2009; Kahneman, Krueger, Schkade, Schwartz, & Stone, Reference Kahneman, Krueger, Schkade, Schwarz and Stone2006; Kahneman & Stone, Reference Kahneman and Stone2010), emotions (e.g., happiness or sadness) are more closely linked to daily events and circumstances (Diener et al., Reference Diener, Kahneman, Arora, Harter, Tov and Diener2009, Diener, Kahneman, Tov, & Arora, Reference Diener, Kahneman, Tov, Arora, Diener, Helliwell and Kahneman2010).
Although general assessments about life satisfaction may be subject to memory bias and may be, to some extent, mood dependant (Kahneman, Reference Kahneman, Kahneman, Diener and Schwarz1989; Schwarz & Strack, Reference Schwarz, Strack, Kahneman, Diener and Schwarz1999), research has consistently shown that the general judgment of satisfaction with life, seemingly vulnerable to cognitive biases, is a very solid construct (Diener et al., Reference Diener, Inglehart and Tay2013; Schimmack & Oishi, Reference Schimmack and Oishi2005). It has been repeatedly shown that this assessment is associated with diverse aspects such as marital satisfaction (Diener & Seligman, Reference Diener and Seligman2002), productivity (Lyubomirsky, King, & Diener, Reference Lyubomirsky, King and Diener2005), improved physical and mental health (Vázquez, Rahona, Gómez, Caballero, & Hervás, Reference Vázquez, Rahona, Gómez, Caballero and Hervás2012), or even longevity (Diener & Chan, Reference Diener and Chan2011).
The concept of life satisfaction implies an assessment of life itself that is based on a comparison process with subjectively established criteria (Shin & Johnson, Reference Shin and Johnson1978). It is, essentially, a cognitive measure that refers to an overall judgment of life experience in general (Diener, Emmons, Larsen, & Griffin, Reference Diener, Emmons, Larsen and Griffin1985) or to various domains such as health, family, housing, etc... (Huebner, Reference Huebner2001). In the cognitive processes that lead to a judgment on life satisfaction, stable factors (such as each individual’s personality, general assessments that are unlikely to change, etc...) and more situational factors (such as mood, the context in which the question is asked, etc...) are involved. However, according to Schimmack and Oishi’s (Reference Schimmack and Oishi2005) estimate, based on a test-retest reliability of life satisfaction measures meta-analysis, 80% of the variance is due to stable factors (e.g., personality , upbringing, economic status), 10% to circumstantial or situational factors (e.g., order of questions, mood, episodic life circumstances), and 10% to random factors. Therefore, life satisfaction scales are poorly determined by random fluctuations or by transitory or occasional factors.
The life satisfaction measure
The Satisfaction with Life Scale (SWLS: Diener et al., Reference Diener, Emmons, Larsen and Griffin1985) is probably the life satisfaction measure most cited in scientific literature (Diener & González, Reference Diener and Gonzalez2011). Until its creation, most existing scales of subjective well-being focused on the emotional component (Pavot & Diener, Reference Pavot and Diener1993). The scale was generated from a set of 48 self-report items related to life satisfaction and positive and negative affect. A factor analysis revealed three factors (life satisfaction, negative affect, and positive affect). The satisfaction factor contained ten items that were eventually reduced to the five that compose the current scale based on a semantic similarity analysis (Diener et al., Reference Diener, Emmons, Larsen and Griffin1985). Thus, the SWLS is a short scale composed of five simple items, intelligible to virtually any adult (Pavot & Diener, Reference Pavot and Diener1993), which are added up to yield an overall score (see Appendix). The multi-item character of this scale makes it even more valuable, since many of the measures that assess life satisfaction, and are used in large-scale national and international studies (see Vázquez, Reference Vázquez, Vázquez and Hervás2009), consist of a single item with all the psychometric limitations that this involves (Diener et al., Reference Diener, Emmons, Larsen and Griffin1985).
The scale has been used on many different samples: general population (Bai, Wu, Zheng, & Xiaopeng, Reference Bai, Wu, Zheng and Xiaopeng2011; Glaesmer, Grande, Braehler, & Roth, Reference Glaesmer, Grande, Braehler and Roth2011), students (Diener et al., Reference Diener, Emmons, Larsen and Griffin1985; Pavot, Diener, Colvin, & Sandvik, Reference Pavot, Diener, Colvin and Sandvik1991), or people with various clinical problems (see Pavot & Diener, Reference Pavot and Diener1993). In turn, the existing data suggest SWLS’s validity in different cultures and nations and translations are available in a number of different languages Footnote 1 . Its validation has been carried out in countries as culturally diverse as Israel (Anaby, Jarus, & Zumbo, Reference Anaby, Jarus and Zumbo2010), Netherlands (Arrindell, Heesink, & Feij, Reference Arrindell, Heesink and Feij1999; Arrindell, Meeuwesen, & Huyse, Reference Arrindell, Meeuwesen and Huyse1991), or Malaysia (Swami & Chamorro-Premuzic, Reference Swami and Chamorro-Premuzic2009).
The good psychometric properties of the SWLS have been confirmed over the past twenty years and there are recent studies that have summarized the existing information in a very complete manner (Pavot & Diener, Reference Pavot and Diener2008). A great number of studies have shown the high internal consistency of the scale, with Cronbach’s alpha coefficients ranging from .79 to .87 (Blais, Vallerand, Pelletier, & Briere, Reference Blais, Vallerand, Pelletier and Briere1989; Diener, et al., Reference Diener, Emmons, Larsen and Griffin1985; Pavot et al., Reference Pavot, Diener, Colvin and Sandvik1991). Regarding the validity of the SWLS, although not all items show the same level of best fit, confirmatory factor analyzes reveal a consistent factor structure (Pavot & Diener, Reference Pavot and Diener1993) explaining between 60–75% of the variance (Pavot et al., Reference Pavot, Diener, Colvin and Sandvik1991; Westaway, Maritz, & Golele, Reference Westaway, Maritz and Golele2003). This unifactorial structure has also been confirmed in Spanish samples (e.g., Atienza, Pons, Balaguer, & García Merita, Reference Atienza, Pons, Balaguer and García-Merita2000).
Regarding convergent and discriminant validity, the SWLS correlates moderately but significantly with personality variables such as self-esteem (r = .54), neuroticism (r = -.48) and sociability (r = .20) but not with impulsivity (Diener et al., Reference Diener, Emmons, Larsen and Griffin1985). Moreover, Lucas et al. (Reference Lucas, Diener and Suh1996) found moderate correlations with optimism (r = .59). Finally, regarding the concurrent validity, the SWLS has moderate to strong correlations (r = .40 to .70) with other measures of well-being, for example, Fordyce’s indicator of percentage of time that you feel happy, single-item measures of happiness, Cantril’s Self-Anchoring Scale, Bradburn’s Affect Balance Scale (Diener et al., Reference Diener, Emmons, Larsen and Griffin1985; Lyubomirsky & Lepper, Reference Lyubomirsky and Lepper1999; Pavot et al., Reference Pavot, Diener, Colvin and Sandvik1991). Divergent validity figures are equally consistent, for example, the SWLS also shows moderate to strong negative correlations (r = -.55 to -.72) with Beck’s Depression Scale (BDI) or the anxiety and depression scales from the Symptom Checklist-90 (SCL-90) (Arrindell et al., Reference Arrindell, Meeuwesen and Huyse1991). In this sense, the SWLS discriminates between people with mental disorders (affective disorders, substance abuse, anxiety, etc.) and those without them (Meyer, Rumpf, Hapke, & John, Reference Meyer, Rumpf, Hapke and John2004).
The objective of this study is to analyze the psychometric properties and normative values of an adaptation of the SWLS in a nationally representative sample. To our knowledge, this research has not been carried out before in Spain. Although there have been previous Spanish adaptations of this scale, these were confined to sociodemographically limited samples, such as teenagers or college students (e.g. Atienza et al., Reference Atienza, Pons, Balaguer and García-Merita2000; Casas et al., Reference Casas, Coenders, González, Malo, Bertran and Figuer2011; Chico, Reference Chico2006) or to very specific samples, such as pregnant women (Cabañero et al., Reference Cabañero, Richart, Cabrero, Orts, Reig and Tosal2004) or parents of children who have also been assessed using the SWLS (Casas et al., Reference Casas, Coenders, González, Malo, Bertran and Figuer2011) Footnote 2 . In most cases, the translations, if shown in published articles, presented some controversial aspects in our opinion. A careful translation was carried out in our study, following the latest indications (e.g., Wild et al., Reference Wild, Grove, Martin, Eremenco, McElroy, Verjee-Lorenz and Erikson2005) and with the collaboration of several bilingual Latin American specialists. It was designed with the objective that this version would be comparable in most of the Spanish-speaking world, which, together with a full normative study, is one of the most characteristic elements of our research.
Method
Participants
The sample consisted of a total of 2,964 Spanish adults, after eliminating cases with missing data (1.1%). The age of the participants ranged from 21 to 69 years, M = 42.39; SD = 13.19.
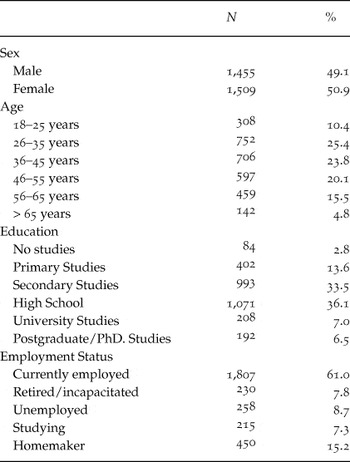
The demographic data of the sample are presented in Table 1.
Sample characteristics (N=2,964)

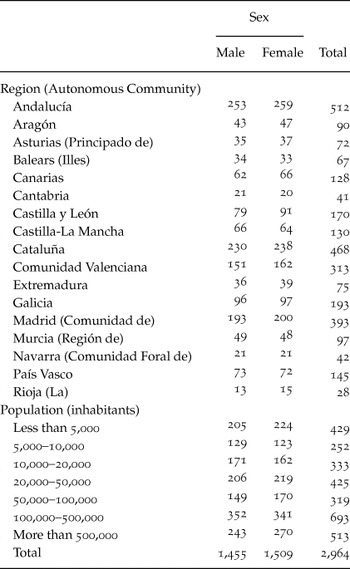
A distribution, proportional to the population, by region and city size, was used as sampling method (Table 2). For the final selection of sample units, a scanning by quota method was used, which established a quota for age, sex and social class based on the population percentages published by the National Institute of Statistics (Instituto Nacional de Estadística, INE, 2001), selecting the units by random sampling. With the sample sizes used, the sampling error in the most unfavorable conditions (p = q = .5) could be estimated at approximately 1.8% with a confidence level of 95%.
Sample distribution by region and sex

All interviews and contacts with participants were carried out in their homes. All participants were informed from the beginning of the procedure that they would receive a reward for participating in both sessions that comprised this study (a small gift valued at 30 €).
Instruments
Satisfaction with Life Scale (SWLS; Diener et al., Reference Diener, Emmons, Larsen and Griffin1985). This is a life satisfaction scale consisting of five items. Participants are asked to indicate their degree of agreement with each statement using a 7-point Likert scale (from 1 = strongly disagree to 7 = strongly agree). Scores can range from 5 to 35 points, indicating a greater life satisfaction with higher scores. The translation used was the result of a multistep process. After an initial process of forward/backward translation, a thorough analysis of the similarity between the original and the translation by a team of eight psychologists, two from Spain and 6 from different language areas of Latin America, was carried out (as recently recommended by Wild et al., Reference Wild, Grove, Martin, Eremenco, McElroy, Verjee-Lorenz and Erikson2005) with the aim of ensuring it was intelligible to any Spanish reader. In addition, a native North American psychologist attended these meetings to ensure equivalence with the original version. In the present study, the alpha reliability coefficient of the scale was .88.
Although the authors of the scale did not provide normative data, Pavot and Diener (Reference Pavot and Diener1993) proposed a series of criteria to classify individuals in terms of a series of breakpoints directly corresponding to the seven response categories: 31–35, very satisfied; 26–30, satisfied; 21–25, slightly satisfied, 20, neutral, 15–19, slightly dissatisfied, 10–14, dissatisfied, 5–9, very dissatisfied.
Subjective Happiness Scale (SHS; Lyubomirsky & Lepper, Reference Lyubomirsky and Lepper1999). This is a 4-item scale widely used to assess directly the degree of subjective happiness. Each item is rated on a Likert scale from 1–7 (e.g., “In general, I consider myself”: 1 = A person who is not very happy, 7 = A person who is very happy). The SHS has shown good psychometric properties (Lyubomirsky & Lepper, Reference Lyubomirsky and Lepper1999) and has been used in different studies on happiness (Lyubomirsky, Tkach, & DiMatteo, Reference Lyubomirsky, Tkach and DiMatteo2006), including Spanish samples (Extremera, Salguero, & Fernández-Berrocal, Reference Extremera, Salguero and Fernández-Berrocal2011). In our study, Cronbach’s internal consistency index was of .65, lower than the average reliability of .86 reported by Lyubomirsky and Lepper (Reference Lyubomirsky and Lepper1999). The elimination of some items did not improve this reliability significantly.
Duke-UNC Functional Social Support Questionnaire (FSSQ; Broadhead, Gehlbach, Degruy, & Kaplan, Reference Broadhead, Gehlbach, DeGruy and Kaplan1988). This scale assesses perceived social support. The version included in the National Health Survey (Insituto Nacional de Estadística, 2006) was used. The original instrument consists of 11 questions (e.g., “I have people who care about what happens to me”) on a Likert-type scale with five response options (1 = Much less than I would like, 5 = As much as I would like). For this study, three items related to confidential support (receiving advice, guidance, or information) and three items of emotional support (direct expressions of care and affection) were selected according to factor solution in a wide Spanish sample (Bellón, Delgado, Luna, & Lardelli, Reference Bellón, Delgado, Luna and Lardelli1996). Cronbach’s alpha in our study was .84, which coincides with Bellón et al.’s (Reference Bellón, Delgado, Luna and Lardelli1996) results. They obtained a total alpha of .90, with an internal consistency of .88 for confidential support and .79 for emotional support. In our case, the values were .67 and .81 for both subscales, respectively.
Procedure
Each participant was interviewed at home, individually, by one of the 121 purposely-trained interviewers. A team of 18 supervisors reviewed all questionnaires. In addition, direct supervision by random phone calls to 19% of the participants was carried out to ensure that the test administration had occurred under adequate conditions.
Information on sex and socioeconomic status in each of the regions was collected according to the Population and Housing Census 2001 (Instituto Nacional de Estadística, INE, 2001). A company specializing in surveys (Millward Brown) was commissioned to carry out the fieldwork (May-July 2007). During the first interview, participants were asked questions regarding their sociodemographic characteristics, socioeconomic status and education. After this first contact, participants were handed a booklet containing several self-report measures (e.g., life satisfaction). After two weeks, the interviewers returned to each participant’s home to collect the questionnaires and reward the participants for their cooperation.
Statistical Analyzes
In order to analyze the differences in SWLS score according to sex and age, as well as education and employment status, a series of analyzes of variance were carried out.
To examine the convergent validity of the scale, a bivariate correlation analysis with the other instruments used was performed. Finally, a confirmatory factor analysis was carried out in order to study the factorial structure of the SWLS. The SPSS 17 and Mplus 5.0. programs were used.
Results
Life Satisfaction and sociodemographical variables
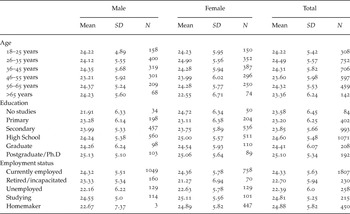
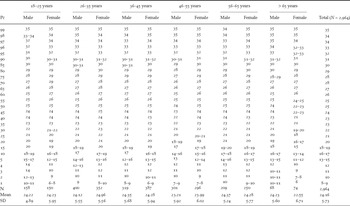
Table 3 shows the means and standard deviations of the SWLS scores according to sex, age, education, and employment. A 2x6 factorial ANOVA (Sex x Age) revealed no difference in overall SWLS score in relation to sex, age or the interaction of both variables. The correlation between SWLS and age of participant was r = -.03, ns. Table 4 shows the percentiles corresponding to the total score in the SWLS.
SWLS scores by sex according to age, level of studies and working status

SWLS percentiles according to sex and age

This pattern of results was identical to that found in the subjective happiness measure (SHS). In this case, neither sex, age, nor their interaction had a significant effect on the participants’ scores.
Regarding the educational level of the participants, a univariate ANOVA revealed that there were significant differences in the SWLS scores F(5, 2949) = 5.43, p < .001. Post-hoc analysis (Games-Howell correction) indicated that the SWLS scores of participants with primary and secondary education were significantly lower than the scores of those participants with high school and postgraduate / doctoral studies (p < .05).
Similarly, regarding the employment status of the participants, a univariate ANOVA showed that the SWLS scores were statistically different in relation to different work situations F(4, 2959) = 12.92, p < .001. Post-hoc analysis (Bonferroni) revealed that respondents in situations of non-activity such as those retired / disabled and unemployed had significantly lower satisfaction with their lives than those who worked, studied or engaged in housework p < .001
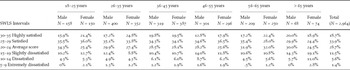
Finally, as shown in Table 5, 34% of the total sample considered they were satisfied with their life and 28.7% considered they were slightly satisfied.
Percentage Distribution (%) of the total sample (N=2,964) in the different SWLS intervals according to sex and age

Psychometric properties of the SWLS
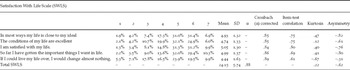
The psychometric properties of the scale were calculated over the whole sample, N = 2,964. The average score obtained in SWLS was 24.16, SD = 5.73. As shown in Table 6, Cronbach’s alpha coefficient was .88. The corrected alpha values of the first four items ranged between .83 and .85, while the elimination of item 5 would result in a slight increase of the internal consistency of the scale to .89, which coincides with the criticisms made to the consistency of this item (Casas et al., Reference Casas, Coenders, González, Malo, Bertran and Figuer2011; Veenhoven, Reference Veenhoven1994). All item-test correlations were higher than .61, suggesting good psychometric properties Footnote 3 .
Total sample (N=2,964) distribution (%) for each SWLS item and psychometric properties

In order to assess the convergent validity of the SWLS, Pearson bivariate correlations were performed with the SHS and FSSQ. Correlation values obtained were r = .44, p < .01 between SHS and SWLS; r = .31, p < .01 between the SWLS and FSSQ Footnote 4 .
Confirmatory factor analysis
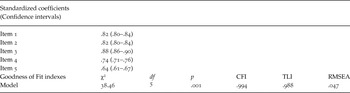
To carry out such analysis and considering that life satisfaction does not exhibit normal distribution (z = 4.662; p < .0001), a maximum likelihood estimation method with robust standard errors and chi- square correction by mean and asymptotic variance was used, following Satorra and Bentler’s (Reference Satorra, Bentler, von Eye and Clogg1994) procedure. It also provides confidence intervals for standard loads (Table 7).
Confirmatory Factor Analysis. Model Fit

Note:
df = degrees of freedom; p = significance level; CFI = Comparative Fit Index; TLI = Tucker-Lewis Index; RMSEA = Root Mean Square Error of Approximation.
The criteria followed for a good fit of the model were those proposed by Hu and Bentler (Reference Hu and Bentler1999): Comparative Fit Index (CFI) and Tucker-Lewis Index (TLI) over .95 and Root Mean Square Error of Approximation (RMSEA) less than .06. As shown in Table 7, all values met these criteria, which therefore confirm the unifactorial structure of the SWLS in the Spanish version.
Discussion
This is the first study to use a representative sample of Spanish adults to validate the SWLS. In line with the published literature (Diener et al., Reference Diener, Inglehart and Tay2013), the scale shows very good psychometric properties. Our results also show that this scale is unidimensional. This result replicates Glaesmer et al.’s (Reference Glaesmer, Grande, Braehler and Roth2011) findings with a representative sample of the German population and supports the scale’s initial proposal (Diener et al., Reference Diener, Emmons, Larsen and Griffin1985). These findings have been found on numerous occasions but with smaller or not entirely representative at population level samples (Atienza, Balaguer, & García-Merita, Reference Atienza, Balaguer and Garcia-Merita2003; Hultell & Gustavsson, Reference Hultell and Gustavsson2008; Wu & Wu, Reference Wu and Wu2008). One exception is Hultell and Gustavsson’s (Reference Hultell and Gustavsson2008) study who, with a sample of 2,966 students and a high proportion of women, found that a second-order hierarchical model, with two lower order factors, could also fit the data.
The high factor loadings for each item provide additional support for the construct validity of the scale. Item 5 (“If I could live my life over, I would change almost nothing”) showed a lower saturation. This result coincides with other studies that, using Item Response Theory (IRT) models, have shown that this item seems to be more weakly associated with the latent life satisfaction construct (Oishi, Reference Oishi2006; Rahona, Vergara, Hervás, & Vázquez, Reference Rahona, Vergara, Hervás and Vázquez2012; Vitterso, Biswas-Diener, & Diener, Reference Vitterso, Biswas-Diener and Diener2005 ). One reason for the malfunction of this item is that it could measure desire to change (even in satisfied people) rather than subjective well-being (Veenhoven, Reference Veenhoven1994). This may be even more common amongst adolescents than at other stages of life (Casas et al., Reference Casas, Sarriera, Abs, Coenders, Alfaro, Saforcada and Tonon2012).
The correlations of each item with the total score show a remarkable internal consistency and are slightly higher than those previously found in SWLS studies with Spanish samples (Atienza et al., Reference Atienza, Pons, Balaguer and García-Merita2000, Chico, Reference Chico2006). Moreover, they generally coincide with the .51 to .80 range reported in Pavot and Diener’s (Reference Pavot and Diener1993) review.
The results of our study show that, in general, there are no significant relationships between age or sex and the SWLS scores, confirming the result pattern typically found (Pavot & Diener, Reference Pavot and Diener1993) even in national studies (Glasesmer et al., Reference Glaesmer, Grande, Braehler and Roth2011; Swami & Chamorro-Premuzic, Reference Swami and Chamorro-Premuzic2009). In fact, studies that have carried out factor analyzes focused on gender factorial invariance show that the structure and measure of life satisfaction is equivalent between groups, indicating that the relationship between the scale items and the underlying construct are the same for men and women (Wu & Yao, Reference Wu and Yao2006). An exception to this can be found in Atienza et al.’s (Reference Atienza, Balaguer and Garcia-Merita2003) study, carried out on a sample of Spanish adolescents. However, other large national studies have found a U-shaped relationship between age and variables related to well-being, such as life satisfaction and positive emotions (Stone, Schwartz, Broderick & Deaton, Reference Stone, Schwartz, Broderick and Deaton2010). In this case, data were obtained through a telephone survey carried out by Gallup in which 340,847 people were asked to rate their well-being using the Cantril’s ladder, which consists of a single item:
“Please imagine a ladder with steps numbered from 0 at the bottom to 10 at the top. Suppose we say that the top of the ladder represents the best possible life for you and the bottom of the ladder represents the worst possible life for you. If the top step is 10 and the bottom step is 0, on which step of the ladder do you feel you personally stand at the present time?”.
As Diener et al. (Reference Diener, Kahneman, Tov, Arora, Diener, Helliwell and Kahneman2010) show, this question possibly probes less stable and abstract aspects than the life satisfaction questions, which may explain the differences between results with apparently similar measures. But this is a matter that should be addressed specifically in future research.
In terms of the convergent validity of the scale, data show moderate correlations with the social support measure (FSSQ) and with the subjective happiness measure (SHS), which is consistent with the pattern of correlations obtained with similar psychological variables (Pavot & Diener, Reference Pavot and Diener2008). Thus, life satisfaction, a construct of hedonic nature, is distinguishable from others seemingly similar (e.g., positive emotions, subjective happiness) and is associated with a wide range of psychological variables and parameters such as health or mortality (Diener et al., Reference Diener, Inglehart and Tay2013).
In short, we believe that this work is a contribution to the study of psychological well-being. The fact of using such a large and representative sample, in highly controlled methodological conditions and using the most used life satisfaction measure adds value to the study. Moreover, we believe that the participation of a large team of Latin American psychologists in the translation of the SWLS favors the use of the scale in different countries and linguistic contexts, allowing for the reliable use of the scale in transcultural studies.
In conclusion, the SWLS scale can be used for individual but also for more social or political purposes. The growing need to incorporate measures of psychological well-being as indicators of the effectiveness of public policies (Bok, Reference Bok2010; Diener, Lucas, Schimmack, & Helliwell, Reference Diener, Kahneman, Arora, Harter, Tov and Diener2009) requires the availability of reliable and valid instruments. We believe that the SWLS is one of the measures that can be used in this wider scope.
Appendix Escala de Satisfacción con la Vida (SWLS; Diener et al., Reference Diener, Emmons, Larsen and Griffin1985)
Instrucciones. A continuación hay cinco afirmaciones con las cuales usted puede estar de acuerdo o en desacuerdo. Lea cada una de ellas y después seleccione la respuesta que mejor describa en qué grado está de acuerdo o en desacuerdo (1 = Fuertemente en desacuerdo; 2 = En desacuerdo; 3 = Ligeramente en desacuerdo; 4 = Ni de acuerdo ni en desacuerdo; 5 = Ligeramente de acuerdo; 6 = De acuerdo; 7 = Fuertemente de acuerdo).