1. Introduction
Longevity improvement and fertility decline around the globe has resulted in an ageing world’s population. As the risk of disability increases with age, all countries face the challenges posed by the growing need for long-term care. In China, the challenges are exacerbated by dramatic demographic changes that will see a rapid surge in the elderly population who requires care and a shrinking working-age population who can provide care.
Long-term care for the Chinese elderly has traditionally been provided by family members. This informal care is becoming less viable with the increasingly common 4-2-1 family structure (consisting of four grandparents, two parents and the only child) and other social-economic changes such as rural-to-urban migration. Amid these changes, private long-term care facilities have expanded rapidly over the past 20 years (Feng et al. Reference Feng, Liu, Guan and Mor2012). More recently, the Chinese government has piloted public long-term care insurance programs in several cities, preparing for nationwide policy reforms on long-term care (see Feng et al. Reference Feng, Glinskaya, Chen, Gong, Qiu, Xu and Yip2020, for a review).
The shifts in the long-term care landscape mean that the future generations of the elderly in China are likely to be faced with a system closer to the one in the US. Since the need for long-term care is largely driven by health status and functional disability, comparing the functional disability and mortality experience between China and the US is important in informing and understanding the development of the long-term care system in China.
Earlier empirical studies on functional disability in China usually draw on cross-sectional data to analyse disability prevalence rates and then use Sullivan’s method to estimate disability-free life expectancy. For instance, Liu et al. (Reference Liu, Chen, Song, Chi and Zheng2009) use data from two national disability surveys and period life tables finding an upward trend in disability-free life expectancy of the elderly Chinese. Studies that adopt a similar method provide valuable insights into the cross-sectional changes in functional disability at a time when there was limited longitudinal data. These studies do not model health transition dynamics that can incorporate interplay between different health states, age and other individual characteristics.
More recent studies make use of increasingly available longitudinal individual-level data to investigate functional disability in the elderly Chinese population. For example, Hanewald et al. (Reference Hanewald, Li and Shao2019) fit differing generalised linear models for transition rates using the Chinese Longitudinal Healthy Longevity Survey (CLHLS) data stratified by gender and urban–rural residence. Liu et al. (Reference Liu, Han, Feng, Dupre, Gu, Allore, Gill and Payne2019) fit logistic models to the transitions for the CLHLS data, using age, sex, urban/rural residence, education as predictor variables and transition probabilities as the dependent variable. The resulting transition probabilities are more relevant than static prevalence rates when estimating future functional disability.
In order to compare China and the US and to understand differing trends and levels in mortality and functional disability, we also use longitudinal individual-level data to estimate health transition rates or probabilities. Since uncertainty is critical in understanding the range of possible future outcomes, we improve earlier studies by incorporating systematic uncertainty along with time trends in health state transitions. The systematic uncertainty allows us to quantify the risk associated with future disability and mortality. Although some studies have shown the significance of systematic uncertainty in health transitions using US data (Li et al. Reference Li, Shao and Sherris2017; Sherris & Wei Reference Sherris and Wei2021), this has not been quantified in the Chinese data.
To quantify the time trend and systematic uncertainty in health transitions among the Chinese elderly and to compare with those in the US, we fit a multi-state latent factor intensity model, similar to the one used in Li et al. (Reference Li, Shao and Sherris2017) and Sherris & Wei (Reference Sherris and Wei2021). We use the CLHLS data as well as the US HRS data for the years between 1998 and 2014 and for the age range 65 and above since we are interested in older ages for long-term care. Li et al. (Reference Li, Shao and Sherris2017) and Sherris & Wei (Reference Sherris and Wei2021) assume a random walk process for the latent factor. Based on the empirical plots of the transition rates in Online Appendix A.1, we test the assumption of a first-order autoregressive, AR(1), process and compare this assumption with the random walk process for the latent factor. We verify that the AR(1) process does not improve the goodness-of-fit for the CLHLS or HRS data and that assuming a random walk is adequate. We refine the models in Li et al. (Reference Li, Shao and Sherris2017) and Sherris & Wei (Reference Sherris and Wei2021) by improving the age change assumption and adjusting for the delay in death reporting. We allow the age covariate to change with each birthday, whereas Li et al. (Reference Li, Shao and Sherris2017) and Sherris & Wei (Reference Sherris and Wei2021) update the age covariate value only on the interview dates or when a transition occurs. We consistently use the data collected in later waves to complete the death records for earlier years and thus adjusting for the delay in these earlier years.
One study that is related to ours in respect of the Chinese transition rates is Hanewald et al. (Reference Hanewald, Li and Shao2019). Our modelling approach differs in several aspects apart from incorporating systematic uncertainty. Firstly, they do not include recovery rates from disability in health transitions, whereas we do and, importantly, find a significant time trend in recovery rates. Secondly, we only consider linear age effects in log transition rates, avoiding unrealistic transition rates at older ages and providing a more parsimonious model. Finally, our model is an integrated model based on a stronger statistical foundation. Instead of fitting separate models to different sub-populations stratified by covariates such as gender and residence, we specify a functional form of the transition rate with proportional hazards assumptions, and fit the model using the full sample. This approach not only improves the reliability of the parameter estimation since more data points are employed but also allows us to test the significance of each covariate.
We quantify how both countries experienced longevity improvement with morbidity compression using the longitudinal individual-level data. We estimate that the Chinese elderly have shorter life expectancy but spend a greater proportion of their future lifetime in the healthy state than their US counterparts. Incorporating time trends is important since failing to do so will underestimate both total life expectancy and healthy life expectancy, and overestimate the proportion of the elderly in functional disability in both countries. Incorporating systematic uncertainty allows us to quantify the confidence we have in the estimated proportion in functional disability. We show that the data indicates greater uncertainty in the functional disability rates for the Chinese elderly.
Within China, we use the model to quantify the significant urban–rural disparity in health and longevity, and show how the gap has widened over time. Urban residents are shown to have reaped more benefits from a longer life expectancy and morbidity compression. Liu et al. (Reference Liu, Han, Feng, Dupre, Gu, Allore, Gill and Payne2019) find similar results for those aged 80 and above. We show that this extends to younger ages. We also find that urban residents experience greater health inequity than their rural counterparts. Not only are they subject to greater uncertainty in their survival probability, but the proportion of people with functional disability has a heavier-tailed distribution.
The rest of the article is structured as follows. Section 2 introduces the health transition model and the estimation method. Section 3 describes the data with an exploratory data analysis. Section 4 discusses the estimation results. Section 5 compares our model results with other studies and population data. Section 6 provides a comparison of our model results and forecasts between China and the US. Section 7 concludes.
2. Health State Transition model
Since long-term care insurance benefits are paid when the policyholder is disabled and cease when the policyholder recovers or dies, we use a three-state Markov process to model the health state transitions. The three states are healthy (H), functionally disabled (F) and dead (D). The health state is determined by a person’s ability to perform activities of daily living (ADLs). The definition is in line with common practice used by insurers. In both the CLHLS and the HRS, there are six ADLs, and they only differ by one ADLFootnote 1. Most long-term care insurance policies pay benefits when the policyholder needs help in two or more ADLs or has a cognitive impairment (Administration for Community Living 2020). The CLHLS and the HRS have different measures for cognitive function, making it hard to compare, so we use the ADLs alone to define disability. An individual needing help in two or more ADLs is in State F. We also allow for recovery from the disabled state to the healthy state. Figure 1 illustrates the transition model.
The health state transition model.

We assume a Markov model. The Markov process is widely used in the literature to model health state transitions (see e.g. Fong et al. Reference Fong, Shao and Sherris2015; Ameriks et al. Reference Ameriks, Caplin, Laufer and Van Nieuwerburgh2011). Although the Markovian property does not take into account the past transitions or the time spent in the previous states, the model achieves satisfactory goodness-of-fit and is more computationally efficient than the semi-Markov process (see e.g. Mø ller 1992; Haberman & Pitacco Reference Haberman and Pitacco1998; Leveille et al. Reference Leveille, Penninx, Melzer, Izmirlian and Guralnik2000; Wolthuis Reference Wolthuis2003).
We use a Cox proportional hazard model (Cox Reference Cox1972) for each transition intensity. Some recent applications of the model include Koopman et al. (Reference Koopman, Lucas and Monteiro2008) on credit rating migrations and Li et al. (Reference Li, Shao and Sherris2017) on health state transitions. The transition intensity for individual k of transition type s (
 $ s \in \{1, 2, 3, 4\} $
where
 $ s=1 $
denotes
 $ H \to F $
,
 $ s=2 $
denotes
 $ F \to H $
,
 $ s=3 $
denotes
 $ H \to D $
,
 $ s=4 $
denotes
 $ F \to D $
) at time t is given by
 \begin{equation}\lambda_{k, s}(t) =\exp[ \beta_s + \boldsymbol{\gamma}^\prime_s \cdot \boldsymbol{\omega}_k(t) + \alpha_s \cdot \psi(t)]\cdot H_{k, s}(t).\end{equation}
The vector
 $ \boldsymbol{\omega}_k(t) $
contains observable explanatory covariates, such as age, gender and time. The process
 $ \psi(t) $
is an unobservable (or latent) factor, also referred to as frailty, that captures the randomness of the transition intensity. It affects all transition types, thus generating systematic risk. The scalar
 $ \beta_s $
, the vector
 $ \boldsymbol{\gamma}_s $
and the scalar
 $ \alpha_s $
are fixed unknown coefficients. The
 $\beta_s$
term is the reference-level log-intensity of transition type s in the starting year. It remains the same across time and individuals. The parameters
 $ \boldsymbol{\gamma}_s $
and
 $ \alpha_s $
measure, for transition type s, the sensitivity of the log-intensity to the observable covariates
 $ \boldsymbol{\omega}_k(t) $
and the latent factor
 $ \psi(t) $
, respectively. The scalar function
 $ H_{k, s}(t) $
is the underlying baseline hazard function to allow for duration dependence (Koopman et al. Reference Koopman, Lucas and Monteiro2008). For example,
 $ H_{k, s}(t) $
can be specified as
 $ H_{k, s}(t) = H_s(t - t_k) $
where
 $ (t-t_k) $
denotes the backward-recurrence time of the
 $k^{\mathrm{th}}$
individual with respect to his/her last transition moment. More choices for
 $ H_{k, s}(t) $
can be found in Koopman et al. (Reference Koopman, Lucas and Monteiro2008). We assume the Markovian property, so
 $H_{k, s}(t)$
is a constant. Without loss of generality, we set
 $H_{k, s}(t)$
to be 1.
The data from both the CLHLS and the HRS is collected every 2–3 years. We use
 $ t_j $
, measured in years, to denote the time of the
 $ j^{\text{th}} $
interview and denote
 $ \psi_j = \psi(t_j) $
as the value of
 $ \psi(t) $
over the interval
 $ t \in (t_{j-1}, t_j] $
. Plotting the crude transition rates against time suggests possible autoregression in the transition rates (see Online Appendix A.1 for the plots). The lines show a zigzag pattern in that an increase in the transition rate is often followed by a decrease and vice versa. To capture the possible serial correlation in
 $ \psi_j $
, we assume
 $ \psi_j $
follows a first-order autoregressive process, or an AR(1) process, with
 \begin{equation}\psi_j = \rho^{t_j - t_{j-1}} \psi_{j-1} +\varepsilon_j, \quad\varepsilon_j \stackrel{i.i.d.}{\sim} \mathcal{N}(0, \sigma^2_j), \quad\psi_0 = 0.\end{equation}
We use a heteroscedastic normal error term because the time between consecutive interview waves is not constant and hence the error term needs to account for this.
 $ |\rho| \leq 1 $
is the autoregressive parameter. When
 $ \rho=1 $
,
 $ \psi_j $
becomes a random walk process. Since not all
 $ \alpha_s $
in equation (1) and
 $ \sigma_j $
can be identified simultaneously (Koopman et al. Reference Koopman, Lucas and Monteiro2008), we normalise
 $ \sigma_j $
to
 \begin{equation}\sigma_j^2 = \begin{cases} \dfrac{1 - \rho^{2(t_j - t_{j-1})}}{1 - \rho^2} & \text{ if } -1 < \rho
< 1, \\ \\ t_j - t_{j-1} & \text{ if } \rho = 1.\end{cases}\end{equation}
We consider the following three models in the parameter estimation.
-
1. Static model
(4)where \begin{equation} \ln{\lambda_{k, s}(t)} = \beta_s + \gamma^{\text{age}}_s \, x_k(t) + \gamma^{\text{female}}_s \, F_k,\end{equation}
$ x_k(t) $
represents the age for the the
$ k^{\text{th}} $
individual at time t and
$ F_k=1 $
if the
$ k^{\text{th}} $
individual is female.
-
2. Trend model
(5)where t captures the time trend.
\begin{equation} \ln{\lambda_{k, s}(t)} = \beta_s + \gamma^{\text{age}}_s \, x_k(t) + \gamma^{\text{female}}_s \, F_k + \gamma^{\text{time}}_s \, t,\end{equation}
-
3. Frailty model
(6)where
\begin{equation} \ln{\lambda_{k, s}(t)} = \beta_s + \gamma^{\text{age}}_s \, x_k(t) + \gamma^{\text{female}}_s \, F_k + \gamma^{\text{time}}_s \, t + \alpha_s \, \psi(t),\end{equation}
$ \psi(t) $
is the frailty factor defined in equation (2).


The covariates
 $ x_k(t) $
in equations (4)–(6), and t in equations (5)–(6), are scaled, so their values are within the same order of magnitude as the gender indicator,
 $ F_k $
. This helps to improve the numerical stability in the estimation. We follow Yogo (Reference Yogo2016) to set the age covariate
 $ x_k(t) $
to
 $ \frac{x^{\text{last}}_k(t) - 65}{10} $
where
 $ x^{\text{last}}_k(t) $
represents the age last birthday. In a similar vein, the time covariate t is set to
 $ \frac{\textit{Time}}{10} $
, where
 $ \textit{Time} $
is based on the year–year range that is determined by the interview waves (Table 1).
The correspondence between year and
 $ \textit{Time} $
.

We improve the estimation in earlier studies (see e.g. Li et al. Reference Li, Shao and Sherris2017), by avoiding directly using the interview waves as the time covariate due to the delay in death reporting, which is a known issue for survey data not linked to the national death index. The delay happens if someone died shortly after the interview, and the death was not reported until the next interview wave. As a result, deaths that occur in the same year (especially when it is a survey year) can be reported in different wavesFootnote 2 . Using the calendar year instead of the interview waves ensures consistency within deaths and between different types of health transitions when assigning values to the time variable.
Prior studies have shown large urban–rural disparities in the health care system (Hougaard et al. Reference Hougaard, østerdal and Yu2011), spending on long-term care (Li et al. Reference Li, Zhang, Zhang, Zhang, Zhou and Chen2013), as well as disability and mortality rates in China (Hanewald et al. Reference Hanewald, Li and Shao2019). Given the significance of the urban–rural disparity in China, we also consider residence as a covariate when fitting to the CLHLS data. The log transition intensity in the frailty model becomes
 \begin{equation} \ln{\lambda_{k, s}(t)} = \beta_s + \gamma^{\text{age}}_s \, x_k(t) + \gamma^{\text{female}}_s \, F_k + \gamma^{\text{resid}}_s \, U_k + \gamma^{\text{time}}_s \, t + \alpha_s \, \psi(t),\end{equation}
where
 $ U_k = 1 $
if the
 $ k^{\text{th}} $
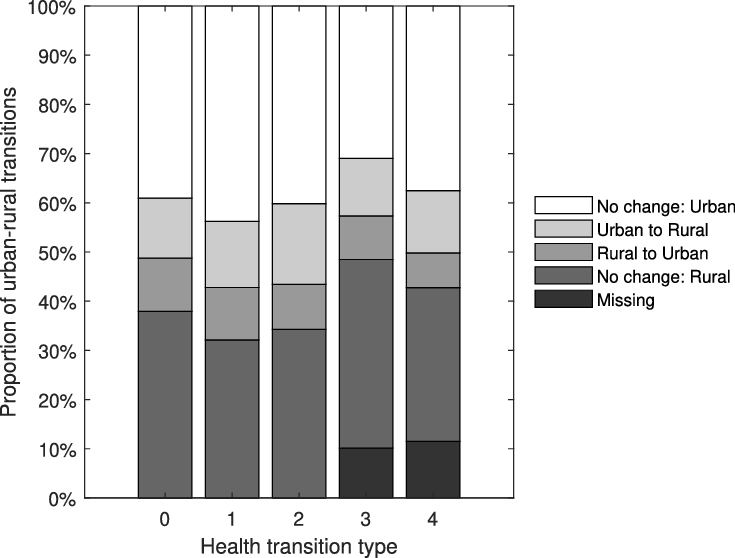
individual lived in city or town when joining the survey. We choose the residence status at the point of joining the survey because this choice is assumed to reflect the place where the individuals spent most of their lifetime. Figure 2 shows that around 20% of health transitions involve a change of residence. This proportion is relatively small and varies little with the type of health transitions.
The distribution of change of residence that occurred in each type of health state transitions based on the selected CLHLS sample. Health transition type 0 means there is no change of health states. Health transition type 1 denotes healthy to disabled, 2 disabled to healthy, 3 healthy to dead, 4 disabled to dead.

We use maximum likelihood estimation (MLE) to estimate the parameters. We define two indicator functions,
 $ Y_{k, s, j} $
and
 $ R_{k, s}(t) $
.
 $ Y_{k, s, j} = 1 $
if transition type s is observed between the
 $ j^{\text{th}} $
and the
 $ (j+1)^{\text{th}} $
interviews, and
 $ R_{k, s}(t) = 1 $
if the individual is exposed to the risk of transition type s at time t. If any type of transition occurs, we use
 $ \hat{t}_j $
to denote the time of transition. For a total of S transition types, K individuals and J interview waves, the likelihood function conditional on the complete path of the frailty is given by
 \begin{align}& L(\boldsymbol{\theta}|\mathcal{F}_J,\Psi) \nonumber\\ & =\prod\limits_{j=1}^{J-1}\prod\limits_{k=1}^{K}\prod\limits_{s=1}^{S}\exp\left\{ Y_{k, s, j} \, \ln \lambda_{k, s}(\hat{t}_{j}) - R_{k, s}(t_j) \int_{t_{j}}^{\hat{t}_{j}} \lambda_{k, s}(u) \mathrm{d} u - R_{k, s}(\hat{t}_{j}) \int_{\hat{t}_{j}}^{t_{j+1}} \lambda_{k, s}(u) \mathrm{d} u\right\},\end{align}
where
 $ \boldsymbol{\theta} $
denotes the set of parameters to be estimated,
 $ \mathcal{F}_J $
denotes all the information available up to time
 $ t_J $
,
 $ \Psi = \{\psi(t_j): j = 0, 1, \cdots, J\} $
. The integrals in equation (8) incorporate changes of age and time. Integrating over the path of
 $ \Psi $
gives the likelihood function that is unconditional on
 $ \Psi $
 \begin{equation}L(\boldsymbol{\theta} | \mathcal{F}_J) =\int L(\boldsymbol{\theta}|\mathcal{F}_J, \Psi) \mathrm{d} P(\Psi).\end{equation}
It is computationally intensive to evaluate equation (9) due to the high dimension of the integral. We use a Monte Carlo simulation technique to reduce the computational burden. We first simulate M paths of
 $ \Psi $
denoted by
 $ \Psi^{(1)}, \ldots, \Psi^{(M)} $
. The likelihood function
 $ L(\boldsymbol{\theta} | \mathcal{F}_J) $
is then estimated as
 \begin{equation} \hat{L}(\boldsymbol{\theta}|\mathcal{F}_J) = \frac{1}{M} \sum_{m=1}^{M} L(\boldsymbol{\theta}|\mathcal{F}_J,\Psi^{(m)}).\end{equation}
We use the quasi-Newton method to find the parameter estimates. In each iteration, the same random numbers are used to simulate the M paths of
 $ \Psi $
. This ensures a smooth likelihood surface. The estimation procedure is implemented in MATLAB using the fminunc function, which applies to an unconstrained function. When the autoregressive parameter (
 $ \rho $
) is estimated, the optimisation problem becomes a constrained one due to the stationarity condition. To continue using the fminunc function, we use the algorithm in Jones (Reference Jones1980) to transform the constrained optimisation procedure to an unconstrained one. The algorithm maps a real-valued parameter to the stationarity region. Once the parameters are estimated, we use the Kalman filtering and smoothing technique to recover the frailty process. Sherris & Wei (Reference Sherris and Wei2021) give a detailed procedure. The code is available at https://sites.google.com/view/mxu/code for download.
3. Exploratory Data Analysis on the CLHLS and HRS
3.1. Data description
To compare China and the US, we use the CLHLS (Zeng et al. Reference Zeng, Vaupel, Xiao, Liu and Zhang2017) and the HRS (Health and Retirement Study 2020; RAND HRS Longitudinal File 2016 (V2) 2020) to estimate the model parameters. Both datasets have a similar structure, containing one record (i.e. one row of a spreadsheet) for each interviewee, who is identified by a unique identity number. Each record consists of multiple variables (i.e. columns of a spreadsheet), including date of birth, gender, interview wave, difficulty in the ADL. A full list of variables selected for our analysis can be found in Online Appendix A.3.
The CLHLS started in 1998 and conducts face-to-face interviews every 2–3 years in 22 provinces, representing 85% of the population in mainland China (Zeng Reference Zeng2004). The survey originally sampled individuals aged 80 and above, and has expanded to those aged 65 and above since 2002. We use the datasets from 1998 to 2014, which is the latest survey available. The HRS is a biennial survey of initially non-institutionalised Americans over age 50. The survey started in 1992, but the early waves contain some inconsistency in the survey questions about ADLs (Fong et al. Reference Fong, Shao and Sherris2015). To bring age and year ranges in line with those in the CLHLS, we use the HRS data from 1998 to 2014 and exclude individuals who had not reached 65 by 2014.
The transitions between healthy and disabled states are interval-censored. We assume the transition occurred in the midpoint of the two interview dates and limit the sample to those whose identity numbers appeared in consecutive waves. The time of death is recorded, but there is a delay in death reporting, as explained in Section 2 so we argue for using the calendar year rather than interview wave as the time covariate. As the delay in death reporting, if it occurs, is at most one interview wave, for years prior to the last interview wave, we use the information from later waves to complete the death records. We cannot do this correction in reporting for the last wave (i.e. year 2014) since the death data in later waves is yet to be collected. We therefore remove the health transitions that occurred in 2014 to avoid bias. After further removing those with missing interview dates, missing or invalid death dates (e.g. February
 $ 29^{\text{th}} $
in non-leap years) or missing information on ADLs, we are left with 36,233 individuals in the CLHLS sample and 22,467 individuals in the HRS sample. The selected HRS sample has fewer individuals but more interview waves. The summary statistics of the two selected samples are presented in Online Appendix A.4.
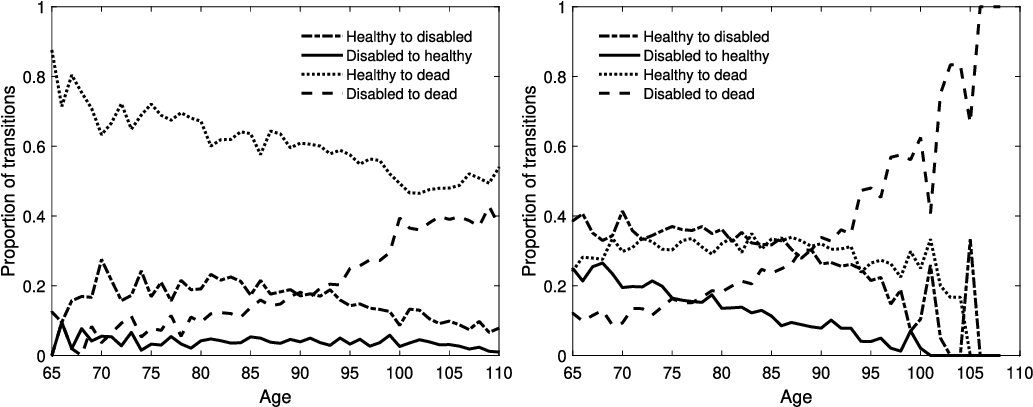
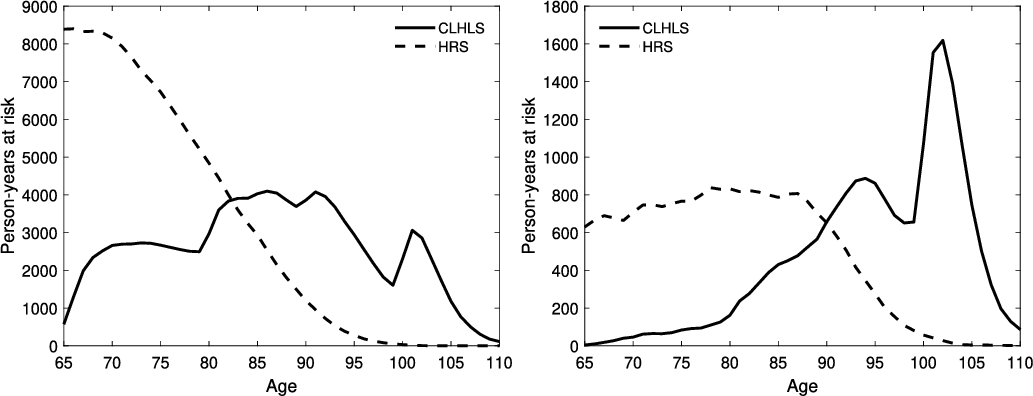
Figure 3 shows the proportion of health state transitions at each age for the selected CLHLS sample and HRS sample. The health transitions of the selected CLHLS sample are dominated by deaths, while those of the HRS sample are more evenly spread across different transition types except for the very advanced ages. Figure 4 compares the total person-years at risk between the two samples. The HRS sample shows a downward trend with age, whereas the CLHLS sample shows an inverse U shape. The differences in the health transition and exposure between the two samples are mainly due to different sampling ages. The CLHLS sample has more participants of the middle-old and the oldest-old than the HRS. Despite those differences, both samples contain a sufficiently large number of individuals in each age group above 65 for our model estimation. Given the differences in the absolute values of person-years at risk, we plot the proportion of person-years at risk in healthy and disabled states in Figure 5. Compared to the HRS sample, the CLHLS sample has a higher proportion of person-years at risk in the healthy state and it decreases at a slower rate with age.
Proportion of transitions between different health states for (left panel) the selected CLHLS sample and (right panel) the selected HRS sample.

Total person-years at risk in (left panel) healthy and (right panel) disabled states for the selected CLHLS sample and HRS sample.

Proportion of person-years at risk in (left panel) healthy and (right panel) disabled states for the selected CLHLS sample and HRS sample.

3.2. Proportional hazard assumption
We make the proportional hazard assumption when defining the transition intensity in Equation (1). In this section, we use a graphical approach to evaluate this assumption. Figure 6 plots the crude health transition rates by age. There are four curves in each panel, representing each gender in each of the two samples. The two curves that correspond to female and male transition rates in a given sample are seen to be reasonably parallel in that they do not cross over or diverge. In addition, the log transition rates show a linear trend with age in almost all transition types, supporting our model assumption to have a linear age term in the transition intensity. We also plot the crude transition rates by urban-rural residence in the CLHLS sample, shown in Online Appendix A.5, and confirm the reasonableness of the proportional hazard assumption. In summary, the graphical checks support these assumptions in our model specification. Model estimation results are in the next section.
Crude health transition rates by age for female and male.

4. Estimating the Health Transition Model
We use the MLE to estimate the transition model parameters, and this section discusses the estimation results. Since the computation time for estimating the frailty model can be much longer, and this model feature is an important contribution we make to functional disability transition modelling, we first report the computational time and compare the goodness-of-fit of the static, trend and frailty models in Section 4. Section 5 validates the estimation results.
We then simulate the heath state transitions using the estimated transition models to determine life expectancy, including healthy life expectancy, as well as disability prevalence, implied by the model and discuss the simulation results in Section 6 with Section 6.1 comparing China and US life expectancy and Section 6.3 considering urban–rural differences in China.
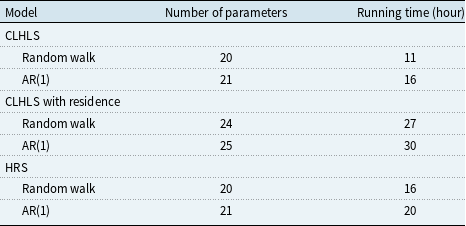
Estimating the static and trend models is computationally efficient. It can be completed within minutes on a standard desktop. Estimating the frailty model requires substantially more computational resources. We show that the running time is not unwieldy and allows for the application of the model to the individual longitudinal data we have (Table 2).
Approximate running time of the frailty model, where the latent factor is modelled as a random walk process or an AR(1) process. The code is implemented in MATLAB Release 2019b.

Note: The computational time is based on 1,000 simulated frailty paths and 12 CPU cores.
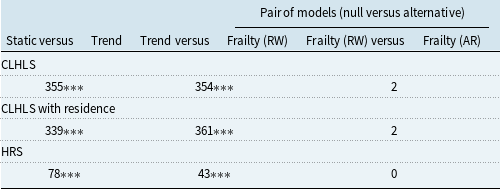
We use the likelihood ratio test to determine whether each of the following improves the model fit: (1) adding the time trend to the static model, (2) adding the frailty factor to the trend model and (3) relaxing the constraint on the autoregressive parameter.
The likelihood ratio test statistic is given by
 \[ -2 \ln \left( \ell_{\text{null}} - \ell_{\text{alternative}}\right), \]
where
 $ \ell_{\text{null}} $
is the maximum log-likelihood of the model under null hypothesis, and
 $ \ell_{\text{alternative}} $
is the maximum log-likelihood of the model under alternative hypothesis. Under the null hypothesis, the test statistic asymptotically follows a chi-squared (
 $ \chi^2 $
) distribution with degrees of freedom equal to the difference in the number of parameters between the null and alternative hypotheses.
Table 3 shows that adding the time trend to the static model and adding the frailty factor to the trend model significantly improve the model fit. By contrast, the additional autoregressive parameter, that was considered to capture the time series behaviour of the transition rates and improve the latent process, does not improve the goodness-of-fit. A random walk assumption for the latent process is adequate.
Test statistics of the likelihood ratio tests. Frailty (RW) means the latent process is modelled as a random walk process. Frailty (AR) means the latent process is modelled as an AR(1) process.

Note:
 $ ^{***}p<0.01 $
,
 $ p > 0.1 $
otherwise.
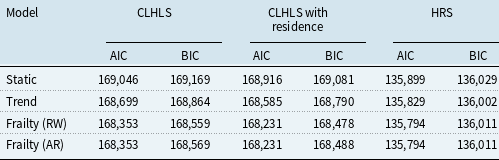
We also compute the Akaike information criterion (AIC) and Bayesian information criterion (BIC) to verify the likelihood ratio test results. The two information criteria are given by
 \[ \text{AIC} = 2\kappa - 2\ell, \quad\mathrm {BIC} = \kappa \ln(n) - 2\ell, \]
where
 $ \kappa $
is the number of estimated parameters in the model,
 $ \ell $
the maximum log-likelihood of the model and n the number of observations. A lower value of AIC or BIC implies a better fit. Table 4 shows that AIC and BIC results draw the same conclusion with the likelihood ratio test. In the light of the goodness-of-fit test results, the frailty model assumes a random walk process in the rest of the article.
Akaike information criterion (AIC) and Bayesian information criterion (BIC) of each model. Frailty (RW) means the latent process is modelled as a random walk process. Frailty (AR) means the latent process is modelled as an AR(1) process.

5. Model Reasonableness: Comparison with Other Studies and Population Data
We now assess the reasonableness of the estimation results by comparing (1) the fitted transition rates to the crude ones as well as prior literature, (2) the estimated life expectancy to external sources. Since the life expectancy is derived from the transition rates, we focus on comparing the fitted rates. The comparison of life expectancy can be found in Online Appendix B.
We first compare the fitted transition rates from the static model to the crude rates. Figures 7 and 8 plot the fitted static rates along with the crude rates based on the CLHLS sample and the HRS sample, respectively. The fitted rates can be seen to correspond closely with the crude ones, demonstrating a satisfactory model fit. For the CLHLS sample, the crude disability rates (top left panel of Figure 7), on the logarithmic scale, show some curvature, whereas the model assumes a linear age effect. Liu et al. (Reference Liu, Han, Feng, Dupre, Gu, Allore, Gill and Payne2019) include a quadratic age term that is not statistically significant at a 95% confidence level when modelling annual transition probabilities based on the CLHLS data in a logistic model. In our logarithmic model, as given in equation (4), we assume a linear age effect, which may overstate disability rates at the very old ages.
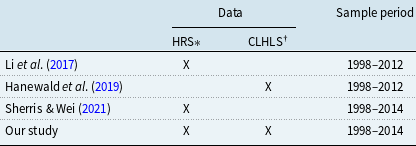
Our models are not fitted to the crude rates since, we fit our functional form of the transition rate that includes age and gender as covariates, also with time trends, using the individual-level observations. To compare our estimated transition rates from the static model with no time trends, we compare with the crude rates from the full dataset based on number of transitions and person-years of exposures. To assess the transition rates with time trend, we compare our fitted rates to those with time trends and the same set of covariates in prior literature. In particular, we compare our fitted transition rates with those computed with the estimated parameter values in Li et al. (Reference Li, Shao and Sherris2017), Hanewald et al. (Reference Hanewald, Li and Shao2019) and Sherris & Wei (Reference Sherris and Wei2021). Table 5 shows that these papers use the same data source and similar sample periods.
Comparison of data sources and their sample periods.

* HRS stands for US Health and Retirement Study.
† CLHLS stands for Chinese Longitudinal Healthy Longevity Survey.
Static model: estimated transition rates compared to the crude rates based on the selected CLHLS sample.

Static model: estimated transition rates compared to the crude rates based on the selected HRS sample.

Figure 9 compares the fitted rates with those in Hanewald et al. (Reference Hanewald, Li and Shao2019) based on the CLHLS sample. Hanewald et al. (Reference Hanewald, Li and Shao2019) fit separate models for different transition rates and for individuals in each gender and residence category and include a time trend. We use our fitted rates from the trend model with the residence covariate for comparison. Figure 9 shows that the results are broadly comparable with only differences in the disability rates (the four panels in the top row). The difference is caused by the quadratic age term included in Hanewald et al. (Reference Hanewald, Li and Shao2019). For all our transition rates we assume only a linear age effect in logarithmic transition rates. At older ages our model may overstate disability rates for China although the crude rates in Figure 7 shows this only occurs for the Chinese data.
Trend model with residence: estimated transition rates compared to the fitted rates in Hanewald et al. (Reference Hanewald, Li and Shao2019) for a cohort of Chinese who were 65 in 1998.

Figure 10 compares the fitted rates with those in Li et al. (Reference Li, Shao and Sherris2017) and Sherris & Wei (Reference Sherris and Wei2021) for females based on the HRS data. The comparison for males is given in Online Appendix B, and the results are similar to those for females. The top row of Figure 10 shows that the fitted rates from the static model align well with prior literature. There are small differences in the mortality rates, especially at younger ages (the two panels on the right in the top row of Figure 10). As discussed earlier, our improved model estimation provides more accurate estimates of these rates. The reason for this is that we allow the age covariate to change with each birthday, whereas Li et al. (Reference Li, Shao and Sherris2017) and Sherris & Wei (Reference Sherris and Wei2021) update the age covariate value on the interview dates or when a transition occurs. Improving the age change assumption shifts deaths to younger ages, leading to higher mortality at these younger ages as seen in the figures.
Static (first row), trend (second row) and frailty (last row) models: estimated transition rates compared to the fitted rates in Li et al. (Reference Li, Shao and Sherris2017) and Sherris & Wei (Reference Sherris and Wei2021). The average transition rate is shown for the frailty model. The rates apply to a cohort of females in the US who were 65 in 2010.

The two panels on the right in the bottom two rows of Figure 10 show our estimates have a faster increase in mortality with age compared to Li et al. (Reference Li, Shao and Sherris2017) and Sherris & Wei (Reference Sherris and Wei2021). Since we take into account the delay in death reporting and define the time covariate based on calendar years rather than interview waves, deaths are counted in earlier years, resulting in a faster increase in mortality with age for a cohort.
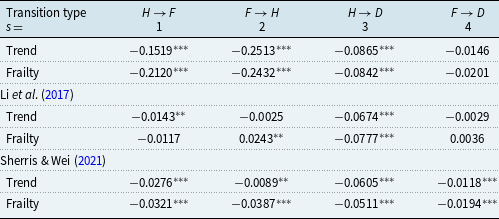
Figure 10 also shows a noticeable difference in the recovery rates of the trend and frailty models between our results and those in Li et al. (Reference Li, Shao and Sherris2017) and Sherris & Wei (Reference Sherris and Wei2021). The difference reflects the higher level of systematic uncertainty in the recovery rates estimated in Li et al. (Reference Li, Shao and Sherris2017) and Sherris & Wei (Reference Sherris and Wei2021). Table 6 shows that their estimated time trend coefficients of recovery rate (
 $ \hat{\gamma}^{\text{time}}_2 $
) are more sensitive to the frailty factor. After including the frailty factor,
 $ \hat{\gamma}^{\text{time}}_2 $
changes almost 10-fold in Li et al. (Reference Li, Shao and Sherris2017) and close to fivefold in Sherris & Wei (Reference Sherris and Wei2021). Our improved estimation of trends and uncertainty produces more accurate estimates of recovery rates.
Comparing the estimated time coefficient (
 $\hat{\gamma}^{\text{time}}_s$
) in the trend and frailty models.

Note:
 $ ^{*}p<0.1 $
;
 $ ^{**}p<0.05 $
;
 $ ^{***}p<0.01 $
. The estimated coefficients values in our models are not directly comparable to Li et al. (Reference Li, Shao and Sherris2017) and Sherris Wei (Reference Sherris and Wei2021) because the time covariate is defined differently.
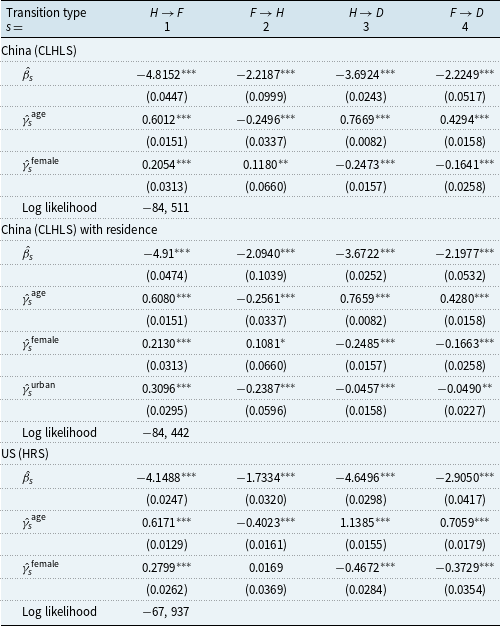
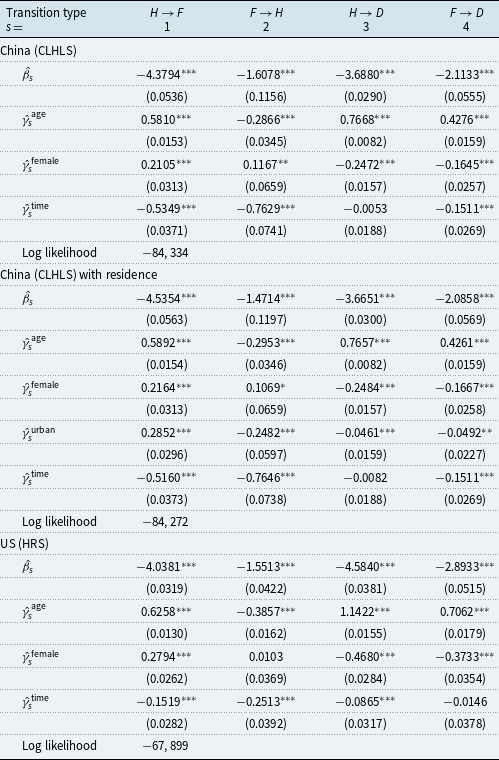
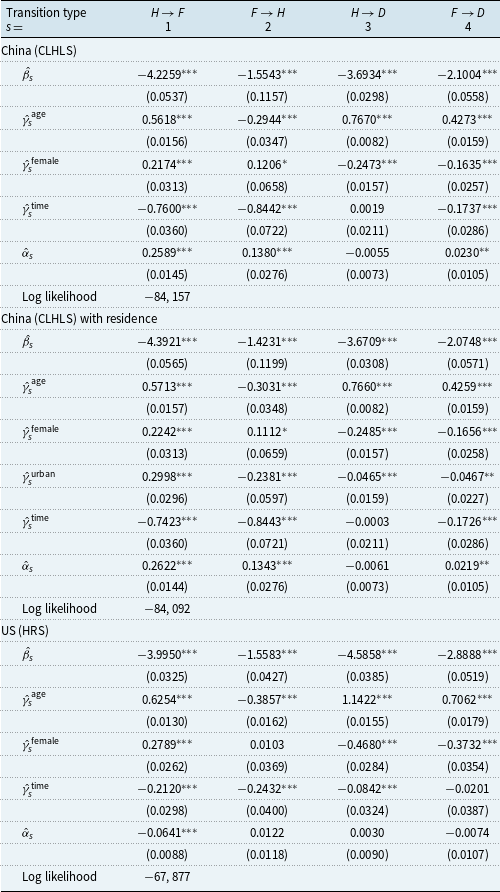
We have shown how our estimated transition rates compared with the estimated rates in prior literature and explained the differences in terms of model assumptions. The full details of the estimated parameter values are given in Tables 7–9.
Static model: estimated parameters with standard errors in parentheses.

Note:
 $ ^{*}p<0.1 $
;
 $ ^{**}p<0.05 $
;
 $ ^{***}p<0.01 $
.
The age covariate is
 $ {(x^{\text{last}}_k(t) - 65)}/{10} $
where
 $ x^{\text{last}}_k(t) $
represents the age last birthday. The time covariate t is
 $ {\textit{Time}}/{10} $
, where
 $ \textit{Time} $
is determined by the calendar year (see Table 1).
Trend model: estimated parameters with standard errors in parentheses.

Note:
 $ ^{*}p<0.1 $
;
 $ ^{**}p<0.05 $
;
 $ ^{***}p<0.01 $
.
The age covariate is
 $ {(x^{\text{last}}_k(t) - 65)}/{10} $
where
 $ x^{\text{last}}_k(t) $
represents the age last birthday. The time covariate t is
 $ {\textit{Time}}/{10} $
, where
 $ \textit{Time} $
is determined by the calendar year (see Table 1).
Frailty model: estimated parameters with standard errors in parentheses. The latent factor is assumed to follow a random walk process.

Note:
 $ ^{*}p<0.1 $
;
 $ ^{**}p<0.05 $
;
 $ ^{***}p<0.01 $
.
The age covariate is
 $ {(x^{\text{last}}_k(t) - 65)}/{10} $
where
 $ x^{\text{last}}_k(t) $
represents the age last birthday. The time covariate t is
 $ {\textit{Time}}/{10} $
, where
 $ \textit{Time} $
is determined by the calendar year (see Table 1).
We now use the estimated parameters to simulate health transitions in order to estimate implied survival curves and future life expectancy allowing for improvement trends and uncertainty. We compare the Chinese and US results and discuss implications.
6. Life Expectancy and Disability Prevalence: Comparison of China and the US
We use micro-simulation, simulating the health states of 10,000 homogeneous individuals whose health state transition rates are assumed to be the estimated transition rates in the static, trend or frailty model. To generate random health states from the frailty model, we first simulate 1,000 frailty paths, then for each of the frailty paths, we simulate the health states of the 10,000 individuals. We demonstrate how to simulate the health states given the transition rates, and how to simulate the future lifetime given the health state paths in Online Appendix C.
For the trend and frailty models, we simulate health states for two cohorts, one starting in the year 1998 at age 65 and the other starting in 2014 at age 65. We selected these 2 years because the data used for estimation started in 1998 and ended in 2014. For the simulated cohort aged 65 in 1998, we set the time equal to 1 in the transition model; for the simulated cohort aged 65 in 2014 we set the time equal to 17. As a result, the transition rates for the simulated cohort aged 65 in 2014 include the impact of trend between 1998 and 2014, whereas the transition rates for the simulated cohort aged 65 in 1998 do not. At the same age, these two cohorts have similar levels of mortality rates, whereas the disability and recovery rates vary significantly due to the stronger time trends associated with the two transitions. The detailed results can be found in Online Appendix D.1.
6.1. Survival curves
Figures 11 and 12 compare the Chinese and US survival curves, based on our model and the estimated transitions for a cohort of individuals who were healthy at 65. These survival curves allow for disability transitions and differences in disabled and healthy mortality rates. The survival curve of the trend model cannot be visually separated from the sample mean of the simulated survival curves from the frailty model, so the former is omitted from the figure. As expected, controlling for gender and time effects, the survival curve of the US is above that of China at almost all ages. The elderly in the US live longer on average than their counterparts in China. The impact of improvement over the sample period can also be discerned when comparing the survival curve of the static model with that of the trend model in both China and the US. Figure 12 shows that for the simulated cohort aged 65 in 2014, the survival curve of the static model is the lowest among the three models at all ages. As a result, assuming a static model without time trends will underestimate life expectancy and the underestimation is more severe for younger cohorts.
Survival curves of the static and frailty models for a cohort of individuals who were healthy at age 65 in the year 1998. Survival curve of the trend model virtually overlaps with the mean of the frailty model. Frailty 95% CI is determined by the 2.5
 ${\text{th}}$
and 97.5
 ${\text{th}}$
percentiles of the simulated survival curves from the frailty model. Frailty mean is determined by the sample mean of the simulated survival curves from the frailty model.

Survival curves of the static and frailty models for a cohort of individuals who were healthy at age 65 in the year 2014. Survival curve of the trend model virtually overlaps with the mean of the frailty model. Frailty 95% CI is determined by the 2.5th and 97.5th percentiles of the simulated survival curves from the frailty model. Frailty mean is determined by the sample mean of the simulated survival curves from the frailty model.

We also plot survival curves for the 75-year-old in Online Appendix D.2. Similar conclusions are drawn, except that these curves show a faster decrease with age and therefore have a less rectangular shape than the curves for the 65-year-old.
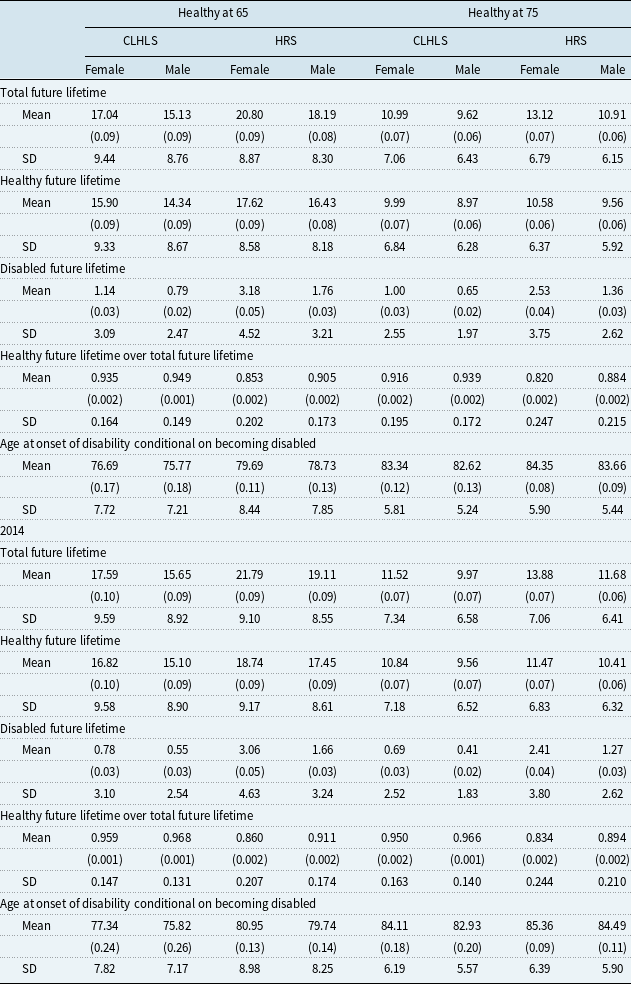
Table 10 shows estimates of life expectancy, healthy life expectancy, disabled life expectancy, the proportion of life expectancy spent in the healthy state (i.e. without functional disability) and the average age at the onset of disability, simulated from the static model. We show the estimates for the 65- and 75-year-old healthy individuals by gender and nation. The gap in total life expectancy between China and the US is about 3.6 years for healthy females at 65 and 2.8 years for healthy males at 65. Interestingly, the model estimates that the average age at onset of disability is very similar for Chinese and US males or females. Although Chinese healthy mortality is higher, the disability rates and disabled mortality compensate to produce similar expected ages for the onset of functional disability. Even more striking is that the Chinese elderly are expected to spend more time, as a proportion of their total future lifetime, in the healthy state without functional disability. So although Chinese life expectancy is lower than that of the US for both women and men, the CLHLS data suggests that seniors in China are likely to spend a greater proportion of their time free of functional disability than their US counterparts.
Static model: future lifetime statistics for 65- and 75-year-old healthy individuals, including mean, standard error of the mean in brackets and SD. The maximum attainable age is 110.

Table 11 shows the same simulated future lifetime statistics for the trend model with starting years of 1998 and 2014. For the simulated cohort aged 65 in 1998, the expected ratio of healthy future lifetime over total future lifetime is similar to that estimated with the static model. There are some increases in life expectancy for the trend model compared with the static model for the 1998 starting year, although these are not major. The increases in total life expectancy range from 1 month to less than 5 months among the 65-year-old. For the simulated cohort aged 65 in 2014, compared to the one aged 65 in 2014, we see increases in both life expectancy and healthy life expectancy in China and the US for both males and females. The increases provide an indication of the impact of trends between 1998 and 2014 on life expectancy and healthy life expectancy. The proportion of future healthy life expectancy increases in China and the US for both males and females. The model estimates morbidity compression based on functional disability when time trends are included in the transition model.
Trend model: future lifetime statistics for 65- and 75-year-old healthy individuals in 1998 and 2014, including mean, standard error of the mean in brackets and SD. The maximum attainable age is 110.

The simulated life expectancy results using the frailty model are comparable to those of the trend model, as expected, since the impact of the frailty factor, which follows a random walk process, is averaged out when calculating the expectation. The frailty model allows us to construct confidence interval (CI) of the mean and to measure the significance of time trend on life expectancy. We find that, for the simulated cohort aged 65 or 75 in 2014, regardless of gender or nation, the lower endpoint of the 95% CI of total life expectancy exceeds the corresponding total life expectancy estimated with the static model. By contrast, the total life expectancy estimated with the trend model lies within the interval of the frailty model. Disregarding the time trend, therefore, significantly underestimates the total life expectancy for the younger cohort. The detailed results can be found in Online Appendix D.2.
6.2. Health distribution
We have so far shown estimates from the model transitions for life expectancy, including disabled life expectancy which reflects how long on average an individual would need long-term care based on functional disability. We can also use the transition model to estimate the proportion of disabled elderly for a cohort of individuals as they age. This provides a more informative picture of functional disability than just an average time spent disabled or an average age of onset of disability.
Figure 13 shows the simulated proportion of older adults in the disabled state for a cohort of healthy individuals who were 65 years old in the year 1998. The estimates given by the trend and static models are within the 95% CIs of those given by the frailty model. The probability of being disabled increases initially with age since at younger ages, for healthy individuals, the chance of disability is greater than the chance of death. At more advanced ages, the healthy mortality rate exceeds the disability rate, so the proportion of disabled elderly declines.
Probability of being in the disabled state for a cohort of individuals who were healthy at age 65 in the year 1998. Frailty 95% CI is determined by the 2.5
 ${\text{th}}$
and 97.5
 ${\text{th}}$
percentiles of the simulated probabilities from the frailty model. Frailty mean is determined by the sample mean of the simulated probabilities from the frailty model.

Controlling for age and gender, the model simulations show that the estimated transition rates imply a higher chance of being disabled for the elderly in the US than those in China. Based on the frailty process, the 95% CI for the US is more or less symmetric around the mean, while that for China is skewed to higher proportions. Long-term care benefit payouts in China would be expected to have a heavier right tail, with larger-than-expected payments more likely to occur compared with the US.
Figure 14 shows the probability of being disabled for a cohort of healthy individuals who were 65 years old in the year 2014. In both China and the US, the trend model produces lower probabilities at all ages than those of the static model. The gaps tend to be larger when the probabilities are higher. Ignoring the time trend (i.e. the static curve) overestimates the probability of being disabled by a noticeable margin. For pricing long-term care insurance, it is critical to include time trend in the transition model to ensure actuarial premiums reflect expected trends. Our model allows these effects to be readily captured.
Probability of being in the disabled state for a cohort of individuals who were healthy at age 65 in the year 2014. Frailty 95% CI is determined by the 2.5
 ${\text{th}}$
and 97.5
 ${\text{th}}$
percentiles of the simulated probabilities from the frailty model. Frailty mean is determined by the sample mean of the simulated probabilities from the frailty model.

Similar conclusions can be drawn from the probabilities of being disabled for a cohort of healthy individuals who were 75 in 1998 and 2014. The plots are displayed in Online Appendix D.3.
6.3. Urban-rural differences in China
China has a unique urban–rural dual system that gives rise to social and economic inequality between the urban and rural populations (Chan & Wei Reference Chan and Wei2019). The socioeconomic differences, along with the disparity in the health care system (Hougaard et al. Reference Hougaard, østerdal and Yu2011) and long-term care expenditures (Li et al. Reference Li, Zhang, Zhang, Zhang, Zhou and Chen2013), have consequences for the elderly life expectancy and health distribution.
Figure 15 uses our estimated model for China to compare the survival curves for urban and rural residents who were healthy at age 65 in the year 1998. The urban–rural difference in the survival curves is small. A noticeable difference between the two panels in Figure 15 is the wider CIs for urban residents, suggesting greater health inequity within the urban population, similar to the results in Yang & Kanavos (Reference Yang and Kanavos2012) who show that the urban population is more prone to income-related health inequalities than their rural counterparts.
Survival curves of the static and frailty models (with the residence covariate) for a cohort of individuals who were healthy at age 65 in the year 1998. Survival curve of the trend model virtually overlaps with the mean of the frailty model. Frailty 95% CI is determined by the 2.5
 ${\text{th}}$
and 97.5
 ${\text{th}}$
percentiles of the simulated survival curves from the frailty model. Frailty mean is determined by the sample mean of the simulated survival curves from the frailty model.

Figure 16 gives the survival curve of Chinese who were healthy at 65 in the year 2014. Compared to Figure 15, the CIs of all the sub-populations are narrower in Figure 16, and the lower bound of the CI is closer to the mean. These changes result from the strong mortality improvement for the disabled population in China that increases the survival probability. The lower bound is affected more than the upper bound because for those living longer there is a higher-than-average risk of disability as shown in Figure 14.
Survival curves of the static and frailty models (with the residence covariate) for a cohort of individuals who were healthy at age 65 in the year 2014. Survival curve of the trend model virtually overlaps with the mean of the frailty model. Frailty 95% CI is determined by the 2.5
 ${\text{th}}$
and 97.5
 ${\text{th}}$
percentiles of the simulated survival curves from the frailty model. Frailty mean is determined by the sample mean of the simulated survival curves from the frailty model.

The survival curves for the 75-year-old Chinese show similar patterns in terms of urban-rural and cohort differences. They are shown in Online Appendix D.2.
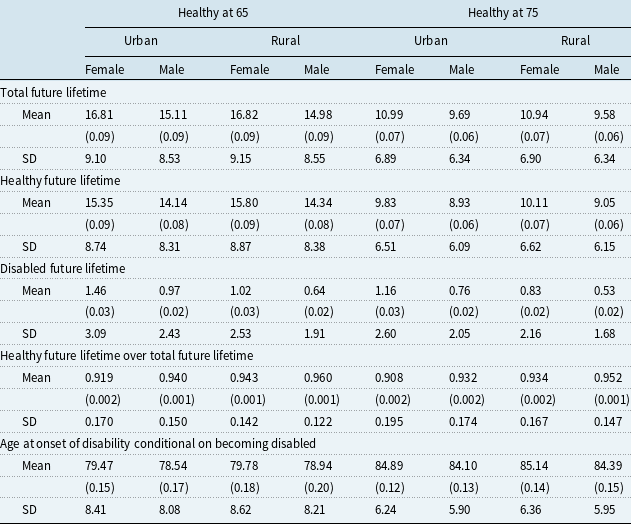
Table 12 shows the simulated life expectancy using the static model for the Chinese urban and rural residents. Urban residents generally have a longer total life expectancy, but they tend to spend fewer years in the healthy state and to become disabled at slightly younger ages. The urban residents have lower mortality as estimated in the transition model. This may also reflect that urban residents have better access to health care services that can improve life expectancy (Hao et al. Reference Hao, Xu, Dupre, Guo, Zhang, Qiu, Zhao and Gu2020). An interesting result, based on the CLHLS data and our transition model, is that urban residents are more likely to become disabled and less likely to recover from disability than their rural counterparts, which shortens their healthy life expectancy. These results are consistent with prior studies that find a significant association between rural residency and fewer ADL disabilities (see e.g. Zeng & Vaupel Reference Zeng and Vaupel2002; Zeng et al. Reference Zeng, Gu, Purser, Hoenig and Christakis2010; Zimmer et al. Reference Zimmer, Wen and Kaneda2010). Poorer environment quality (e.g. air and water pollution) and more sedentary lifestyle are possible factors that contribute to a higher disability rate among urban Chinese residents (Gong et al. Reference Gong, Liang, Carlton, Jiang, Wu, Wang and Remais2012).
Static model with residence: future lifetime statistics for 65- and 75-year-old healthy individuals, including mean, standard error of the mean in brackets and SD. The maximum attainable age is 110.

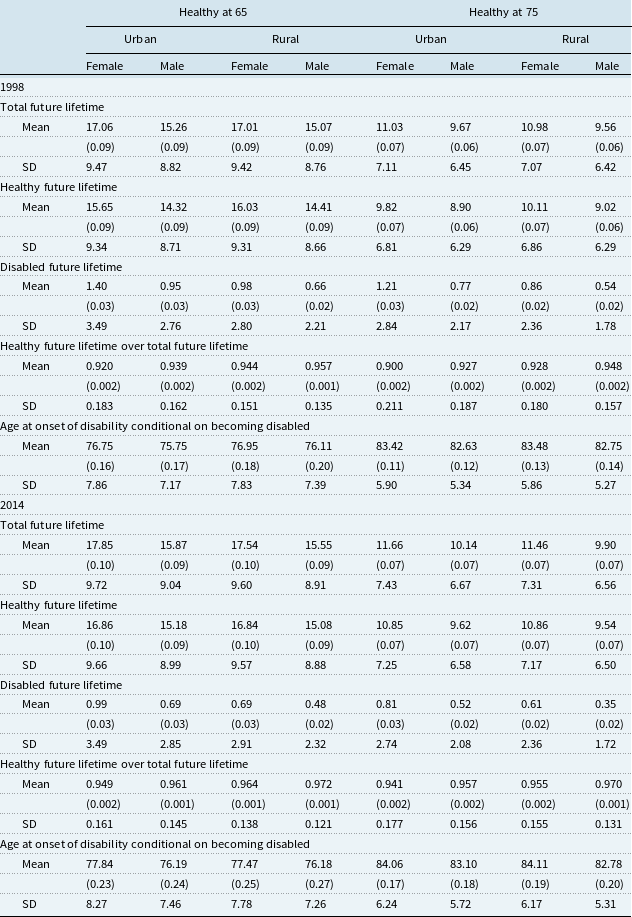
Table 13 shows the simulated future lifetime statistics using the trend model with residence. The urban–rural gap in total life expectancy widened between 1998 and 2014, increasing from 0.05 years to just below 0.4 years for healthy females at 65, and increasing from less than 0.2 years to more than 0.3 years for healthy males at 65. Both urban and rural residents enjoyed longer healthy life expectancy, and the gains were greater for urban residents. In 1998, the healthy life expectancy was lower for urban residents in both gender and age groups. The gap was closed, and in 2014, urban residents were expected to have a longer healthy life expectancy. Over the course of the data period, the average onset of disability conditional on being disabled was delayed by almost 1.1 years for 65-year-old healthy urban females while that for their rural counterparts was about 0.5 years. Including the time trend highlights a growing urban–rural disparity in longevity and health. The simulation results of the frailty model are similar to those of the trend model shown in Table 13 since the randomness of the frailty factor is averaged out across the simulations. They can be found in Online Appendix D.2.
Trend model with residence: future lifetime statistics for 65- and 75-year-old healthy individuals in 1998 and 2014, including mean, standard error of the mean in brackets and SD. The maximum attainable age is 110.

Figure 17 compares the probability of being disabled by gender and residence for a cohort of healthy individuals who were 65 years old in 1998. Controlling for age and gender, a higher proportion of urban residents are expected to be functionally disabled than their rural counterparts. Urban residents are more likely to become disabled, less likely to recover, and have lower mortality rates. Figure 13 shows that the Chinese population is subject to a higher degree of uncertainty in their disability risk. Decomposing the Chinese population into urban and rural residents reveals that urban residents account for this greater uncertainty, supporting the conclusion that health disparity is larger within the Chinese urban population.
Probability of being in the disabled state for a cohort of individuals who were healthy at age 65 in the year 1998. Frailty 95% CI is determined by the 2.5
 ${\text{th}}$
and 97.5
 ${\text{th}}$
percentiles of the simulated probabilities from the frailty model. Frailty mean is determined by the sample mean of the simulated probabilities from the frailty model.

Figure 18 shows the probabilities of being in the disabled state for the simulated cohort aged 65 and healthy in 2014. Using the static model consistently overestimates the probability of being disabled for both urban and rural residents. The degree of overestimation varies with gender and residence, but is most severe for urban females.
Probability of being in the disabled state for a cohort of individuals who were healthy at age 65 in the year 2014. Frailty 95% CI is determined by the 2.5
 ${\text{th}}$
and 97.5
 ${\text{th}}$
percentiles of the simulated probabilities from the frailty model. Frailty mean is determined by the sample mean of the simulated probabilities from the frailty model.

We plot the same curves for the 75-year-old showing urban residents continue to experience higher probabilities with greater uncertainty of being disabled. The figures are shown in Online Appendix D.3.
7. Conclusions
Declining family support and a growing need for private long-term care in China mean that the elderly Chinese will face long-term care financing issues, similar to their US peers. Since the demand for long-term care is largely driven by health status, in particular functional disability, a comparison of the functional disability and mortality experience between China and the US is critical in informing the development of the long-term care system in China. At the same time, understanding the driving factors for mortality and functional disability in both the US and China is important. We develop, apply and estimate transition models based on Li et al. (Reference Li, Shao and Sherris2017) and Sherris & Wei (Reference Sherris and Wei2021) to capture time trends and systematic uncertainty in health transitions among the Chinese elderly and compare the differences with the US using individual-level longitudinal survey data.
Based on the data between 1998 and 2014, we confirm how the elderly in the US have a longer life expectancy compared to their Chinese counterparts. The Chinese transition data indicates a smaller proportion of future lifetime will be spent functionally disabled. By including time trends, our model shows morbidity compression in both the US and China. Although the elderly Chinese are forecast to have lower probabilities of being disabled than the US elderly, they are estimated to have a higher level of variability in the probability of being functionally disabled.
Acknowledgements
The authors acknowledge financial support from the Society of Actuaries Center of Actuarial Excellence Research Grant 2017–2020: Longevity Risk: Actuarial and Predictive Models, Retirement Product Innovation, and Risk Management Strategies, the Australian Research Council Centre of Excellence in Population Ageing Research (CEPAR) project number CE170100005 and from Australian Research Council Discovery Grant DP170102275 Retirement Product Innovation. The authors would also like to thank Zixi Li and Pengyu Wei for sharing their code for transition model estimation and frailty process recovery with us. We have rewritten the code to improve estimation accuracy and computational efficiency. Our code is available at https://sites.google.com/view/mxu/code for download. We acknowledge the use of the computational cluster Katana supported by Research Technology Services at UNSW Sydney.
Supplementary Material
To view supplementary material for this article, please visit https://doi.org/10.1017/S1748499521000233.