Implications
The present study confirms that high levels of CP are not required in the diet under laboratory conditions, and that testing under field conditions should be performed. Another important factor is the possible adoption of differentiated nutritional management during the 30 days of larviculture in accordance with the nutritional requirements of the animals, which could lead to savings in feed costs. The influence of diet on gene expression and enzymatic activity found for tilapia larviculture in the present study is unprecedented and, contributes to a better understanding of nutritional issues at a stage of development that is considered critical in fish production.
Introduction
Nile tilapia (Oreochromis niloticus) is a native cichlid of Africa (Stiassny, Reference Stiassny1991). It is one of the most cultured fish species worldwide due to its fast growth, good market acceptance and high performance in intensive culture systems (Diógenes et al., Reference Diógenes, Fernandes, Dorigam, Sakomura, Rodrigues, Lima and Gonçalves2016). In addition, tilapia breeds throughout the year and is highly resistant to disease, high temperatures, high water ammonia levels, high stocking densities and low oxygen levels (Boscolo et al., Reference Boscolo, Hayashi and Meurer2002). In addition, larval tilapia can be fed a commercial diet beginning with their first exogenous feeding (Luz et al., Reference Luz, Ribeiro, Ikeda, Santos, Melillo Filho, Turra and Teixeira2012), which facilitates a stage of production that is considered critical for many freshwater species (Santos and Luz, Reference Santos and Luz2009).
The commercial feeds available for tilapia larviculture usually possess CP levels of 50% to 55%. Luz et al. (Reference Luz, Ribeiro, Ikeda, Santos, Melillo Filho, Turra and Teixeira2012) reported that juvenile tilapia displayed lower growth rates when they were fed a diet of 55% CP compared with diets with lower protein levels. This study, however, only evaluated fish growth, and much remains to be better understood regarding the effects of protein at the physiological level.
Protein is one of the most important nutrients in diet formulation because it is directly related to animal growth (El-Sayed, Reference El-Sayed1999). Providing an adequate protein level is essential for optimizing both feed costs for aquaculture and nitrogen release into the environment (Al-Hafedh, Reference Al Hafedh1999). Moreover, nutrients need to be properly digested to maximize feed efficiency, a process in which digestive enzymes play an essential role (Murashita et al., Reference Murashita, Fukada, Takahashi, Hosomi, Matsunari, Furuita, Oku and Yamamoto2015).
Enzyme activity can also be considered a biochemical indicator of feeding activity in larval fish (Cara et al., Reference Cara, Moyano, Zambonino-Infante and Fauvel2007). In addition, diet can modulate gene expression for digestive enzymes and their enzymatic activity (Lo and Weng, Reference Lo and Weng2006; Terova et al., Reference Terova, Rimoldi, Larghi, Bernardini, Gornati and Saroglia2007). These enzymes, together with their precursors, are associated with the degree of development of the organs that produce them (Morais et al., Reference Morais, Conceição, Rǿnnestad, Koven, Chantal, Zambonino and Dinis2007). Furthermore, digestive enzymes can be modulated by diet composition, mainly at the end of the larval stage (Rønnestad et al., Reference Rǿnnestad, Yúfera, Ueberschär, Ribeiro, Sæle and Boglione2013). Nonetheless, most previous research has been performed using live feed, leaving studies on the effects of formulated diets on digestive enzyme gene expression and their enzymatic activity in larval stages as scarce.
Another marker of the physiological state of an organism is their response to stress resistance tests, which can be useful for assessing the quality of larvae and juveniles (Luz et al., Reference Luz, Ribeiro, Ikeda, Santos, Melillo Filho, Turra and Teixeira2012; Piccinetti et al., Reference Piccinetti, Grasso, Maradonna, Radaelli, Ballarin, Chemello, Evjemo, Carnevali and Olivotto2017). Among such tests, the air exposure test has been used widely and applied to several fish species (Luz and Portella, Reference Luz and Portella2005; Trushenski et al., Reference Trushenski, Schwarz, Takeuchi, Delbos and Sampaio2010).
The objective of the present study was to evaluate the effects of different dietary CP levels on larval Nile tilapia. Specifically, performance, gene expression of digestive enzymes and hormones, activity of digestive enzymes and resistance to air exposure stress at different developmental periods (1 to 10 days, 11 to 20 days and 21 to 30 days after the first day of exogenous feeding) were evaluated.
The hypothesis was that varying CP levels will affect gene expression, digestive enzyme activity, hormone levels, growth performance and resistance to air exposure in larval Nile tilapia. High and low levels of dietary protein are expected to decrease the efficiency of tilapia larvae production.
Material and methods
Experimental design and facilities
Experiments were performed in the Aquaculture Laboratory (LAQUA) of the Veterinary School at UFMG (Belo Horizonte, Brazil). Five-day-old larval Nile tilapia (0.009±0.002 g), of the GIFT strain, were used in the experiments. Larvae were distributed at a density of five larvae/l into 16 tanks (30 l) in a water recirculation system equipped with mechanical and biological filters and with a water flow of ~40 ml/min. Water temperature, dissolved oxygen and pH were continuously monitored with a multiparameter probe (YSI 6920VZ2) and maintained at 27.80±1.23°C, 6.31±2.02 mg/l and 7.91±0.14, respectively. Total ammonia was evaluated every 2 days by means of commercial kits (Alcon®) and was kept at 0.29±0.22 mg/l throughout the experimental period.
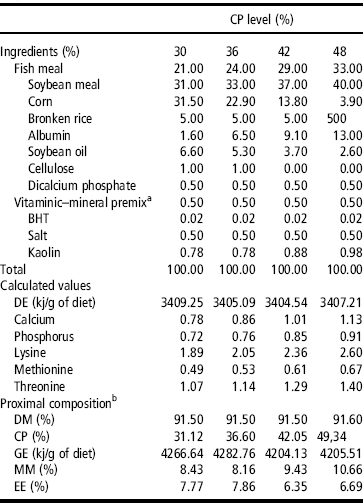
Four different diets that differed in CP level (30%, 36%, 42% and 48% CP) were used in the experiments (Table 1). Each diet was provided to four different tanks (n=4) of the total of 16 tanks used. Fish were fed four times a day (0800, 1100, 1400 and 1700 h) at a feeding rate of 20% of biomass during the first 10 days of experiment. The feeding rate for the subsequent 20 days was set at 10% of biomass. Thus, the larvae were fed the experimental diets for a total 30 days, starting with first day of exogenous feeding. Three different developmental periods were defined: 1 to 10 days, 11 to 20 days and 21 to 30 days after the first exogenous feeding. Sampling times were set at the last day of each phase.
Ingredients and composition of experimental diets for tilapia larvae

BHT=Butyl–Hydroxy–toluene (antioxidant); DE=digestible energy; DM=dry matter; GE=gross energy; MM=mineral matter; EE=ethereal extract.
a Vitamin and mineral supplement composition: vitamin A, 1 200 000 IU; vitamin D3, 200 000 IU; vitamin E, 12 000 mg; vitamin K, 2400 mg; vitamin B1, 4800 mg; vitamin B2, 4800 mg; vitamin B6, 4000 mg; vitamin B12, 4800 mg; folic Acid 1200 mg; pantothenic acid, 3750 mg; vitamin C, 48 000 mg; biotin, 48 mg; coline, 65 000 mg; niacin, 24 000 mg; Fe, 10 000 mg; Cu, 6000 mg; Mn, 4000 mg; Zn, 6000 mg; I, 20 mg; Co, 2 mg; Se, 20 mg.
b Values analyzed in laboratory, expressed on the basis of DM.
Experimental diets
The experimental diets were formulated and extruded in 4 to 6 mm pellets using an extruder machine (Labor PQ30, Inbramaq®, Ribeirão Preto, São Paulo, Brazil). The diets were subsequently analyzed to determine bromatological composition. Dry matter, CP (Kjedahl N × 6.25), crude energy (EB) (adiabatic caloric pump), mineral matter at 550°C for 5 h) and ethereal extract (Sohxlet method) were evaluated according to the methodologies described by the Association of Official Analytical Chemists (2012) (Table 1). During the first 20 days of the experiments the feed was mashed (<0.5 mm diameter) before providing it to the fish, whereas during the last 10 days it was crushed.
Sample collection
Samples collections were performed at sampling times 10, 20 and 30 days of the experimental period. For each sampling, 12 fish from each treatment were collected before the first feeding time; six for enzymatic analysis and six for gene expression analysis. However, at sampling time 10, pools containing two animals were made, thus providing three replicates per treatment for each purpose (gene expression and enzymes analysis). For sampling times 20 and 30, six animals per treatment for each purpose (gene expression and enzymatic) were used. Fish were euthanized with an overdose of eugenol (285 mg/l), weighted and measured. The fish were then rinsed with ethanol and saline solution, frozen in liquid nitrogen and stored at −80°C until analysis.
Fish performance
Larval survival was determined by direct visual counting at the end of the experimental period of 30 days. Biometric measurements of 15 animals were performed at the 10-, 20- and 30-day samplings. Fish length was measured with a digital pachometer (Starrett®, EC799A-8/200 mm, Athol, Massachusetts, USA) and weight with a digital scale (Oryon® AY-220, sensibility of 0.0001 g, Porto Alegre, Rio Grande do Sul, Brazil). Fish used in these procedures were anesthetized in eugenol (175 mg/l).
Data for weight were used to calculate specific growth rate (SGR) (%/day) according to the following equation:
 $${\rm SGR}\,{\rm {\equals}}\,{\rm 100}\,\left( {{\rm ln}\,{\rm Wt}\,{\rm -}\,{\rm ln}\,{\rm Wi}} \right){\rm \,/\,\Delta t}$$
where Wi is initial weight, Wt final weight and Δt the time (days) between weighings.
Gene expression analysis
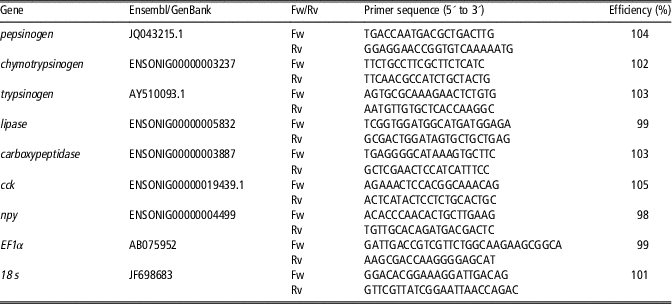
Whole larvae/pool of two larvae were used for gene expression analysis at the 10-day sampling time, while whole larvae were used at the 20- and 30-day sampling times. Samples were transferred to sterile tubes containing 0.5 ml of Trizol (Invitrogen, Carlsbad, Califórnia, USA) and mechanically homogenized (Ultra Turrax®, IKAWorks Inc., Wilmington, DE, USA) before performing total RNA extraction according to the manufacturer’s instructions (Invitrogen). The RNA pellet was dissolved in sterile DEPC water (Invitrogen) and the RNA concentration determined by spectrometry (DNOVIX DS11 Spectrofotometer, Hanby Building Wilmington, USA). Total RNA (1 µg) was then retrotranscribed using a commercial kit (QuantiTect Reverse Transcription Kit, Qiagen, Germany), which included a genomic DNA elimination step. Complementary DNA (cDNA) was subjected to quantitative PCR analysis in a light thermocycler (7500 Real-Time PCR system; Applied Biosystems, Foster City, Califórnia, USA) using the following protocol: 95°C for 15 min followed by 40 cycles of 95°C for 15 s and 60°C for 1 min. Quantitative PCR reactions were performed using the SYBR Green PCR Master Mix (Applied Biosystems). All samples were run in triplicate. Melting curves were run after amplification to ensure that only one DNA species was being amplified. The PCR reaction was performed in a final volume of 20 µl. Primers were designed with the Primer3 software (Untergasser et al., Reference Untergasser, Cutcutache, Koressaar, Ye, Faircloth, Remm and Rozen2012) and their sequences are shown in Table 2. The relative amplification efficiency of each gene was analyzed by cDNA dilution curve, while primer concentrations were determined by means of a primer dilution curve. The primers of pepsinogen, trypsinogen, cck, ef1a and 18 s were added at a final concentration in the reaction of 200 nM; primers of carboxypeptidase, lipase and npy were added at a final concentration of 400 nM; and the primers of chymotrypsinogen were added at a final concentration of 800 nM. Gene expression values were calculated as a relative expression by the Delta-Delta-CT method using ef1a and 18 s as housekeeping references (Yang et al., Reference Yang, Wang, Tian, Liu, Wu, Jiang and Wen2013). The CV of the housekeeping genes analyzed was checked before calculating the results to ensure that they were lower than 5%. All procedures were adapted from Costa et al. (Reference Costa, Serrano, Sánchez-Vázquez and López-Olmeda2016).
Primer sequences used in the quantitative PCR (qPCR) assays of tilapia

Fw=Forward; Rv=Reverse; cck=cholecystokinin; npy=neuropeptide Y; EF1α=elongation factor 1 alpha; 18 s=18 s ribosomal RNA.
Enzymatic activity
Whole larvae were homogenized in Tris-HCl 100 mM pH 7.8 buffer with 0.1% Triton X-100 and 0.1 mM Ethylenediamine tetraacetic acid (EDTA) at a ratio of 4 ml buffer per 1 g of sample. The homogenate was centrifuged for 30 min at 14 000 rpm and 4°C, and the supernatant was collected and stored at −80°C until analyzed. All enzymatic assays were performed in triplicate and determined in a microplate reader spectrophotometer (Multiskan Go, Thermo Scientific, Waltham, Massachusetts, USA). The concentration of total protein in the samples was determined by the Bradford method using bovine serum albumin as a standard (Bradford, Reference Bradford1976).
BApNA (Nα-benzoyl-L-arginine-4-nitroanilide) was used as the substrate for determining trypsin activity. To do this, 40 μl of the enzyme extract was diluted in 160 μl of 50 mM Tris-HCl pH 8.2 buffer containing 20 mM CaCl2. Next, 20 μl aliquots of this new solution were incubated with 100 μl of substrate solution containing 1 mM BApNA, 50 mM Tris-HCl pH 8.2 and 20 mM CaCl2 at 30°C using a 96-well acrylic microplate (CORNING, Incorporated, Corning, New York, USA). Activity was measured by reading the absorbance at 410 nm every 30 s for 30 min. The reaction rate was expressed as specific activity, defined as nmol of 4-nitroaniline produced per minute (U) per mg protein (mU−1 mg protein). The molar extinction coefficient of the 4-nitroaniline used to perform the calculations was 8800 M/cm.
To determine chymotrypsin activity, BTEE (N-benzoyl-L-tyrosine ethyl ester) was used as the substrate. For this, 20 μl of the enzyme extract was diluted in 160 μl of 100 mM Tris-HCl pH 7.8 buffer containing 25 mM CaCl2. Next, 20 μl aliquots of this new solution were incubated with 140 μl of substrate solution containing 1.13 mM BTEE, 100 mM Tris-HCl pH 7.8 and 25 mM CaCl2 at 30øC using 96-well UV treatment acrylic microplate (CORNING, Incorporated, Corning, New York, USA).
Activity was measured by reading the absorbance at 256 nm every 20 s for 20 min. The reaction rate was expressed as specific activity, defined as nmol of tyrosine produced per minute (U) per mg of protein (U/mg of protein). The molar extinction coefficient used to perform the calculations was 964 M.cm. Acid protease activity was determined using 0.5% hemoglobin as a substrate at pH 2, as described elsewhere (Montoya et al., Reference Montoya, López-Olmeda, Yúfera, Sánchez-Muros and Sánchez-Vázquez2010). One unit of protease activity was defined as 1 mg of tyrosine released per minute and mg of protein.
Stress test: air exposure
At the end of the experiment, 20 fish from each tank were placed in two 2-l tanks at a density of 10 fish per tank. Water temperature in the tanks was maintained at 27°C and fish were fasted for 12 h. After this period, the fish were removed from the water and exposed to air for a period of 5 or 7 min, being used 10 animals from each tank to each of the exposition times (Luz et al., Reference Luz, Ribeiro, Ikeda, Santos, Melillo Filho, Turra and Teixeira2012). After air exposure the fish were returned to the 2-l tanks and kept there for 24 h. The stress resistance rate (Rs) was subsequently calculated as the survival percentage.
Statistical analysis
All statistical analyses were performed using SAS Software, University Edition, 2016, with a significance threshold (P) of 0.05. Data subjected to statistical tests were first checked for normality (Kolmogorov–Smirnov test) and homoscedasticity (Bartlett’s test). Data of performance were subjected to one-way ANOVA followed by Tukey’s posthoc test. Data of gene expression were subjected to a Kruskall–Wallis test. Data of survival were first logarithm and square root transformed and then subjected to the Student Newman Keuls test. Statistical analyses for each variable were done separately for each sampling period (1 to 10, 11 to 20 and 21 to 30 days) in order to test for significant differences between diets within the same period. The rationale for this approach was that major changes occur in the physiology of tilapia during development and hence great variation in physiological parameters would be expected between the different periods (Tengjaroenkul et al., Reference Tengjaroenkul, Smith, Smith and Chatreewongsin2002). In addition, this allowed us to test whether the optimum protein level varied among developmental periods.
Results
Performance
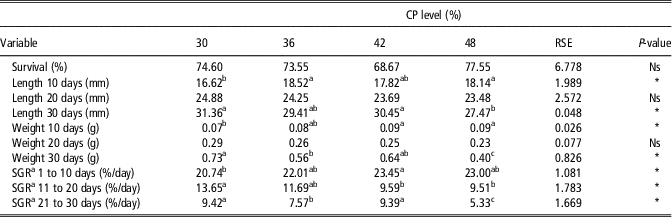
No statistically significant differences in survival rates were observed at the end of the experimental period (P>0.05) (Table 3). At the 10-day sampling, fish length and weight were significantly lower for the 30% CP diet (P<0.05). Neither length nor weight differed significantly among diets at the 20-day sampling (P>0.05). At the 30-day sampling, fish weight was higher for fish fed with 30% and 42% CP than for fish fed 48% CP (P<0.05), whereas fish length was significantly lower for the fish fed 48% CP than for the fish fed the other diets (P<0.05).
Mean values for survival, length, weight and specific growth rate (SGR) of tilapia larvae fed diets with different levels of CP over the course of 30 days

a,b,cDifferent letters in line indicate significant difference by ANOVA followed by the Tukey test (P<0.05).
RSE=Residual standard error; Ns=Not significant; n=15 animals from each treatment at 10, 20 and 30 days.
1 SGR (% BW gain/day)=((ln final BW)−(ln initial BW)/days)×100.
The highest SGR during the first 10 days was for the 42% CP diet, intermediate for the 36% and 48% CP diets and lowest for the 30% CP diet (P<0.05). Between days 11 and 20, SGR was higher for the 30% and 36% CP diets (P<0.05). For the last experimental period (days 21 to 30), SGR was higher for the 30% and 42% CP diets and lower in the 36% and 48% CP diets.
Gene expression of digestive enzymes
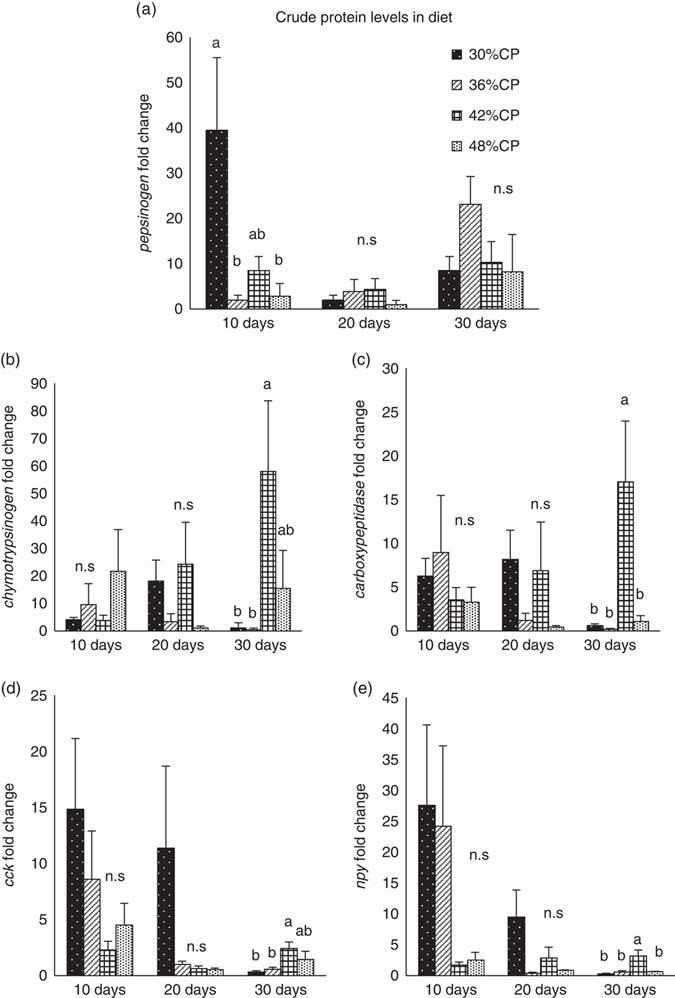
At the 10-day sampling, the relative expression of pepsinogen was highest in fish fed the 30% CP diet, intermediate in fish fed 42% CP and lowest in fish fed either 36% or 48% CP (P<0.05) (Figure 1a). No significant differences were observed at this sampling time for chymotrypsinogen, carboxypeptidase, cck and npy expression (Figure 1b and e) (P>0.05). At the 20-day sampling, there were no statistically significant differences among diet treatments for the expression of any of the genes analyzed (P>0.05) (Figure 1). At the 30-day sampling, the relative expression of chymotrypsinogen, carboxypeptidase and npy had their highest values in fish fed the 42% CP diet, compared with the rest of groups (Figure 1b, 1c and 1e). The relative expression of cck was highest for the 42% CP diet, intermediate for the 48% CP diet and lowest values in the other diets (P<0.05) (Figure 1d).
Means (± SEM) of the relative expression of messenger RNA (mRNA) for pepsinogen (a), chymotrypsinogen (b), carboxypeptidase (c), cholecystokinin (cck) (d) and neuropeptide Y (npy) (e) of tilapia larvae fed diets with different levels of CP measured at 10, 20 and 30 days. Data for each gene from each sampling time (10, 20 and 30 days) were subjected to statistical analysis (Kruskall–Wallis) separately, in order to test for significant differences among diets within the same experimental period. Different letters indicate statistically significant differences between groups (Kruskall–Wallis, P<0.05). ns not significant. n= at the 10-day sampling, six animals were collected and pools of each two animals were made, thus three replicates were analyzed per each treatment. n= for the 20 and 30-days samplings, six animals were used for each treatment.

No statistically significant differences were observed in the relative expression of trypsinogen and lipase, neither among diet treatments nor among samplings (P>0.05).
Digestive enzyme activity
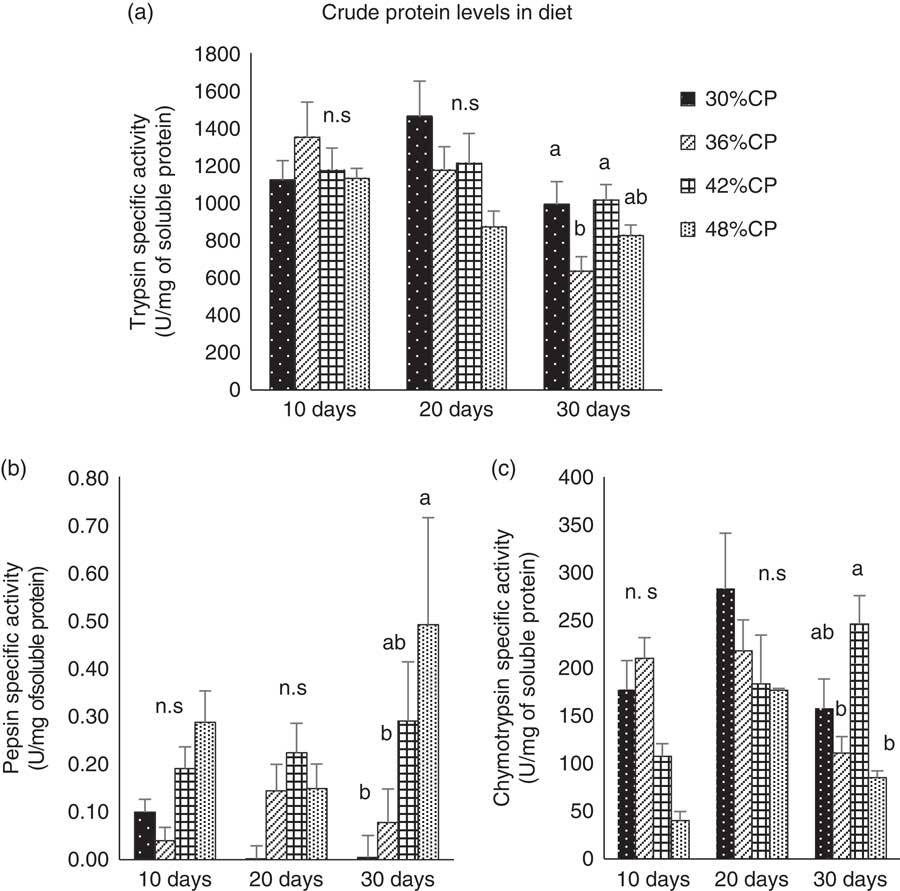
The specific activities for trypsin (Figure 2a), pepsin (Figure 2b) and chymotrypsin (Figure 2c) were similar among diets at both the 10- and 20-day samplings (P>0.05).
Means (± SEM) for specific enzymatic activity of trypsin (a), pepsin (b) and chymotrypsin (c) for tilapia larvae fed diets with different CP levels at samplings at 10, 20 and 30 days. Data for each gene from each experimental period (10, 20 and 30 days) were subjected to statistical analysis (Kruskall–Wallis) separately in order to test for significant differences among diets within the same experimental period. Different letters indicate statistically significant differences between groups (Kruskall–Wallis, P<0.05). ns not significant. n= at the 10-day sampling, six animals were collected and pools of each two animals were made, thus three replicates were analyzed per each treatment. n= for the 20 and 30-days samplings, six animals were used for each treatment.

At the 30-day sampling, trypsin activity was highest for the 30% and 42% CP diets, intermediate for 48% and lowest for the 36% CP diet (P<0.05) (Figure 2a). Pepsin activity was highest for the 48% CP diet, intermediate for 42% and lowest for the 30% and 36% CP diets (P<0.05) (Figure 2b). Finally, the highest chymotrypsin activity was found in fish fed the 42% CP diet, intermediate for the 30% diet and lowest for the 36 and 42% CP diets (P<0.05) (Figure 2c).
Stress test: air exposure
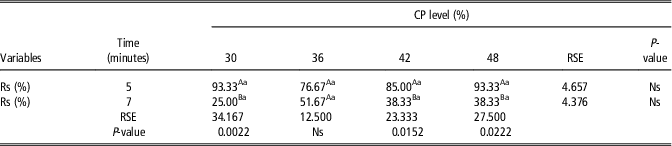
Survival after the air exposure test differed among diets and between the times tested (5 and 7 min) (Table 4) (Luz et al., Reference Luz, Ribeiro, Ikeda, Santos, Melillo Filho, Turra and Teixeira2012). When the different diets were compared within the same exposure time, fish fed the 36% CP diet had a higher survival rate than the other treatments.
Mean values of stress resistance rate (Rs) for tilapia larvae fed diets with different levels of CP and subjected to two different periods of air exposure after 30 days of feeding

A,B,aDifferent letters (lower case in line and upper case in column) indicate statistical difference by ANOVA followed by Student Newman Keuls (SNK) test (P<0.05).
RSE=residual standard error; Ns=not significant; n=10 animals for each time (20 animals for each CP level); SR=stress resistance rates.
Discussion
Commercial larviculture uses the same protein level throughout the first 30 days, whereas the results from scientific reports suggest that larviculture during this period could be performed in several phases, using diets of different nutritional content in each as needed. Such a practice would reduce feed costs, especially since protein is the most expensive ingredient of fish feed. Therefore, balancing the level of protein in the diet can help avoid unnecessary expenses (Ozorio et al., Reference Ozorio, Valente, Pousão-Ferreira and Oliva-Teles2006).
The results of the present study showed that diets with protein levels between 36 and 48% resulted in better performance during the first 10 days of feeding. Pepsinogen gene expression was influenced by diet during the same period, with its highest expression being observed for 30% CP. Pepsinogen expression is related to the development of the gastric glands (Huang et al., Reference Huang, Schreiber, Soffientino, Bengtson and Specker1998; Darias et al., Reference Darias, Murray, Martínez-Rodríguez, Cárdenas and Yúfera2005), which are responsible for extracellular protein digestion and replace less efficient protein digestion processes such as pinocytosis and intracellular digestion (Douglas et al., Reference Douglas, Gawlicka, Mandla and Gallant1999). According to Lo and Weng (Reference Lo and Weng2006), pepsinogen expression can be detected in tilapia larvae two days after hatching. Thus, the occurrence of the highest pepsinogen expression during the first 10 days of development may be indicative of the development of these gastric glands. Although pepsinogen expression was highest for 30% CP at the 10-day sampling, pepsin activity was similar among treatments in the same period. Therefore, increased expression of a gene does not necessarily demonstrate that the activity of a given enzyme is also increased.
At the 20-day sampling, performance and both enzyme expression and activity were not influenced by protein level. This finding can be explained by the fact that this stage seems to be a period of adaptation to diet (Tacon and Food and Agriculture Organization of the United Nations, Reference Tacon1990). In addition, these results suggest that diets with lower protein levels could be used without influencing either fish performance or physiology. This may also be indicated by the SGR results, which revealed that during the first period (days 1 to 10) diets with 30%, 36% and 48% CP exhibited lower SGRs, while during the second period (days 11 to 20) diets with 30 and 36% CP exhibited higher SGRs. Therefore, growth recovery was reflected in similar fish performance in all groups at the 20-day sampling.
At the 30-day sampling, the worst performance, for weight, length and SGR, was observed in the fish fed 36% and 48% CP diets, indicating that these CP levels may be detrimental for tilapia between 20 to 30 days of larviculture. Abdel-Tawwab et al. (Reference Abdel-Tawwab, Ahmad, Sakr and Seden2010) reported better performance with a diet of 45% CP after 30 days of larviculture. Similarly, Luz et al. (Reference Luz, Ribeiro, Ikeda, Santos, Melillo Filho, Turra and Teixeira2012) tested several tilapia commercial feeds and reported that diets with 40% CP induced higher weight and length, and that the use of diets with 55% CP resulted in lower performance and water quality. These results highlight the importance of protein levels in the feed used in tilapia larviculture.
At the 30-day sampling, the relative expression of chymotrypsinogen, trypsinogen, carboxypeptidase, cck and npy, as well as digestive enzyme activity, were influenced by dietary protein level. According to Jones et al. (Reference Jones, Kumlu, Le Vay and Fletcher1997), diet influences the expression and activity of enzymes, mainly at the end of the larval stage when the animals are more adapted to the diet. The highest specific pepsin activity for this period was in the fish fed with diets of 42% and 48% CP. This may be indicating that protein excess, which elicited poorer performance, requires increased production of enzyme to attenuate its excess.
Specific trypsin activity was also influenced by diet at the 30-day sampling. Wang et al. (Reference Wang, Shouqi, Xiaoming, Leia, Yanga and Liua2006) reported that the protein level of food influences trypsinogen expression in Pelteobagrus fulvidraco larvae. Thus, the activity of these enzymes seems to be related to the development of the digestive system and muscle protein synthesis.
Both chymotrypsinogen expression and chymotrypsin specific activity were also influenced by dietary protein level at the 30-day sampling. Chymotrypsinogen expression was highest for 42% CP, whereas the highest chymotrypsin specific activity was observed for 30% and 42% CP. In larvae of the marine fish Atractoscion nobilis, chymotrypsin-specific activity was detected in the first post-hatching feeding and continued to increase overtime, displaying higher activity after the first exogenous feeding (Galaviz et al., Reference Galaviz, García-Gasca, Drawbridge, Álvarez-González and López2011). Therefore, diet seems to exert an important influence on the activity of this enzyme.
Carboxypeptidase expression was highest for the 42% CP diet at the 30-day sampling. This timing coincides with the highest levels of chymotrypsinogen and npy observed in this study. Carboxypeptidases are proteolytic enzymes that have several functions in animals, ranging from catabolism to protein maturation (Galvão et al., Reference Galvão, Yamanaka, Fenerich-Verani and Pimentel1997). Therefore, these enzymes are important for development and responsible of the digestion of exogenous food.
At the 30-day sampling, both npy and cck had their highest expression for the diets with 42% and 48% CP. The enzyme npy is a neuroendocrine regulator of growth hormone, and stimulates food intake in vertebrates (Volkoff et al., Reference Volkoff, Unniappan and Kelly2009). Therefore, its production is influenced by diet composition, as observed in the present study. On the other hand, cck has been ascribed as having an important role in the control and stimulation of the secretion of pancreatic enzymes (Rønnestad et al., Reference Rǿnnestad, Yúfera, Ueberschär, Ribeiro, Sæle and Boglione2013), which coincides with the results of the present study with higher cck expression being correlated with higher enzyme expression and activity in tilapia fed with the diet of 42% CP.
In contrast to the observations for other enzymes, lipase expression was not influenced by variation in diet at the 30-day sampling. Lipase expression was detected at the 10-day sampling. The expression of this enzyme occurs before the first feeding (Murray et al., Reference Murray, Gallanta, Johnsona and Douglas2006), and suggests the existence of lipid digestion, which makes sources of energy other than protein available to larvae (Nunes et al., Reference Nunes, Cavero and Pereira-Filho2006).
At the 30-day sampling, survival among treatments was similar, regardless of the negative effects on fish performance induced by the diet with higher CP. Luz et al. (Reference Luz, Ribeiro, Ikeda, Santos, Melillo Filho, Turra and Teixeira2012) reported higher survival at 30-days for tilapia larvae fed with 32% CP, whereas fish fed diets with higher CP (40% and 55%) experienced worse survival. These data show, therefore, that low dietary protein levels can induce higher, or at least similar, survival rates than can higher protein levels.
As observed for survival rates, Rs was similar among treatments. Fish fed a diet with 36% CP exhibited similar Rs values for both 5 and 7 min of air exposure, whereas fish fed with the other diets tested had a lower Rs at 7 min than that for 5 min. This result suggests that fish fed with 36% CP have a greater resistance to situations of drastic stress. A previous study found tilapia exposed to two different time periods of air exposure (7 and 10 min) to have lower Rs values than when they were fed a diet with a high-protein level (55% CP) (Luz et al., Reference Luz, Ribeiro, Ikeda, Santos, Melillo Filho, Turra and Teixeira2012). Taken together, these results indicate that the air-exposure stress test is efficient at determining the quality of larval and juvenile fish fed different levels of CP.
Conclusions
The results of the present study showed that the best CP level for larviculture of tilapia varies according to developmental period. For the first 10 days post first exogenous feeding, levels of 36% and 48% CP are recommended. For days 11 to 20, any of the levels tested are suitable, while for days 21 to 30, levels between 30% and 42% CP are recommended. In addition, digestive enzyme gene expression and activity varies among diets and throughout the development of tilapia larvae.
Acknowledgments
The present research was funded by CNPq (Conselho Nacional de Desenvolvimento Científico e Tecnológico – CNPq 401117/2014-6 and PQ CNPq-305048/2015-5), CAPES (Coordenação de Aperfeiçoamento de Pessoal de Nível Superior) and FAPEMIG (Fundação de Amparo à Pesquisa de Minas Gerais - PPM-00250-15). The authors wish to thank the staff from the Departamento de Zootecnia of the Universidade Federal de Lavras (UFLA), especially to Prof. Priscila Vieira Rosa, for kindly providing the Laboratories of Enzymology and Molecular Biology.
Declaration of interest
The authors declare that there is no conflicts of interest related to this article.
Ethics committee
All experimental procedures were approved by the UFMG Commission for Ethics in the Use of Animals (Comissão de Ética no Uso de Animais da UFMG, Protocolo CEUA 248/2016).
Software and data repository resources
None of the data were deposited in an official repository.