Recent reports highlight the importance of addressing antimicrobial resistance (AMR) through collaborative efforts involving public health, healthcare, industry, prescribers, and consumers of antibiotics. 1–Reference Tang, Caffrey and Nóbrega3 According to the Centers for Disease Control and Prevention (CDC), antimicrobial-resistant bacteria and fungi are responsible for almost 3 million illnesses and 35,000 deaths annually in the United States. 1 The CDC updated its 2013 report on AMR in 2019, wherein action plans for the control and prevention of AMR infections are outlined. 1,4 Recommendations include surveillance of AMR through active case finding, identification of epidemiological trends, and coordination among public health agencies and healthcare systems.
Hospital microbiology laboratories routinely perform antimicrobial susceptibility testing on bacterial pathogens isolated from clinical specimens. The results of these tests are then aggregated into summary tables called antibiograms. Antibiograms have long been used by hospitals to monitor and identify antibiotic resistance trends and to provide empiric treatment guidance to clinical practitioners within their facilities. Reference Hindler and Stelling5,Reference Fernández and Vazquez6 In the United States, many states aggregate institutional antibiograms for AMR surveillance to identify trends, coordinate with hospitals and long-term care facilities to reduce the spread of antibiotic resistance and to support antimicrobial stewardship programs (ASPs). Reference Guarascio, Brickett, Porter, Lee, Gorse and Covvey7–Reference Boehme, Somsel and Downes9 However, statewide antibiogram aggregation for public health purposes is still new, and the strengths and limitations of these data have not been fully examined.
The Massachusetts Department of Public Health (MDPH) was among the earliest to explore the use of routinely produced antibiograms for public health surveillance and has the longest US history of collecting hospital-specific antibiograms from >50 acute-care facilities for 20 years. In 1999, MDPH began requesting annual submission of institutional antibiogram data from acute-care facilities across the state on a voluntary basis. Since 2012, facilities have been asked to report using a standardized grid format (fillable pdf) provided by the MDPH in place of facility produced antibiograms and, since 2013, reporting has been mandatory by regulation. By 2018, all acute-care facilities (100%) in Massachusetts were included in the statewide cumulative antibiogram report. Statewide antibiogram reports are routinely prepared and present the percentage of bacterial species susceptible to various antimicrobial agents. The following organisms are routinely reported: Acinetobacter baumannii, Pseudomonas aeruginosa, Escherichia coli, Serratia marcescens, Enterobacter cloacae, Klebsiella aerogenes, Staphylococcus aureus, methicillin-resistant Staphylococcus aureus, Klebsiella pneumoniae, Stenotrophomonas maltophilia, Klebsiella oxytoca, and Streptococcus pneumoniae. Although these antibiograms are produced to guide empirical therapy in healthcare facilities, our goal was to determine the ability of these aggregated antibiograms to identify changes in antimicrobial resistance trends at the state level. We examined trends in the susceptibility of E. coli and K. pneumoniae to particular antibiotics to look for evidence of inflection in trends broadly related to multiple changes in antibiotic utilization recommendations, including from the Infectious Diseases Society of America (IDSA) and Society for Healthcare Epidemiology of America (SHEA), issued in 2007 and 2016, and the US Food and Drug Administration (FDA) black box warnings (ie, warnings on a prescription drug’s label designed to call attention to serious or life-threatening risks) on fluoroquinolones in 2008, 2013, 2016, and 2018. Reference Dellit, Owens and McGowan10–Reference Food and Administration12
Methods
Data
Clinical laboratories report drug susceptibility data to the MDPH in aggregated form. Each year, the MDPH summarizes and disseminates relevant Clinical Laboratory and Standards Institute (CLSI) recommendations 13 on constructing antibiograms along with the antibiogram request letter to all clinical laboratories. The organism or drug combination annual percent susceptibilities are reported as facility-level data. Variables reported include the total number of isolates for each organism tested at the facility that year (denominator) and the total number of isolates that were susceptible to a specific antibiotic (numerator). Patient-level data are not reported, but the data included reflect the first isolate per patient per year (per CLSI guidelines). Data cleaning and quality control measures are performed by MDPH staff on an annual basis by checking for duplicate reporting and obtaining missing data in collaboration with the reporting facility. Reports are then distributed back to facilities in the form of a statewide antibiogram, with facility-specific benchmarking, allowing hospitals to compare their susceptibility data to statewide aggregate data (by organism and drug). These routinely collected, de-identified, hospital-level data are used for public health surveillance purposes; therefore, the work reported here did not require human studies approval.
Analysis
Summary statistics were used to characterize hospitals reporting antibiograms to MDPH during the study period. We conducted state-level trend analyses of E. coli and K. pneumoniae susceptibility to carbapenems (meropenem and imipenem), fluoroquinolones (levofloxacin and ciprofloxacin), gentamicin, and ceftriaxone over the period 2008–2018. The organisms were selected because they were the most frequently tested across a wider variety of antibiotic classes and agents. Mean annual percent of susceptible isolates were calculated using aggregated antibiogram data from all reporting Massachusetts acute-care hospitals, weighted by the number of isolates reported per hospital.
Multivariable regression analyses via generalized linear mixed models (GLMMs) were used to examine associations between hospital characteristics and trends of E. coli and K. pneumoniae susceptibility to ciprofloxacin and ceftriaxone. Categorical covariates included hospital size, hospital region, hospital type (ie, teaching vs nonteaching, based on survey data provided to the National Healthcare Safety Network), and patient population. Hospital size was categorized by bed size into small (<100 beds), medium (100–300 beds), and large (>300 beds). Hospital location was categorized by city or town into regions defined by the MDPH Office of Preparedness and Emergency Management. 14 Patient population from which organisms were isolated was categorized as all, inpatient, outpatient, and pediatric and/or other. Time trend was included as a continuous covariate in the models. Interactions between hospital type, hospital size, and patient population were assessed on the multiplicative scale.
Sensitivity models
Sensitivity analyses were used to examine differences in mean susceptibility between antibiograms reported prior to 2012 to those using the standardized grid format initiated in 2012 to explore surveillance artefact that might be related to reporting method. We applied GLMM methods to examine differences in organism to drug susceptibilities between the 2 years prior to 2012 (2010–2011) to the 2 years after 2012 (2013–2014). In addition, a bootstrap analysis of 1,000 repetitions was performed to compare the distribution and variability in antibiogram results to examine the impact of variations in completeness of reporting over time. Finally, trends in susceptibilities for hospitals reporting consistently (9–11 years of data) over the study period were compared to hospitals that reported less consistently (≤8 years of data). All statistical analyses were performed using SAS version 9.3 software (SAS Institute, Cary, NC).
Results
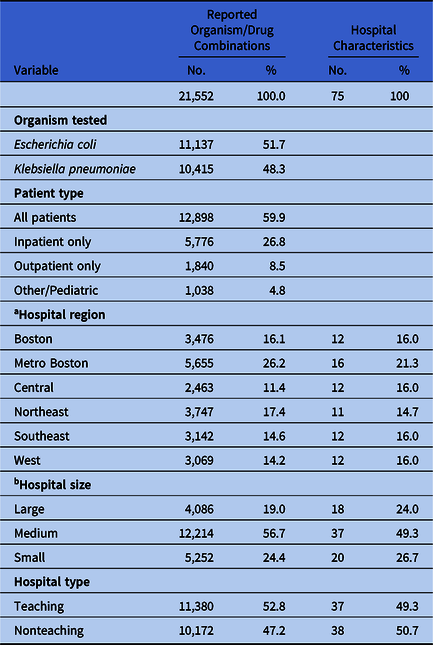
During 2008–2018, the MDPH received an average of 54 hospital antibiograms per year (range, 51–75). These antibiograms represented antimicrobial susceptibility testing of 7.5 million isolates of E. coli and 1.3 million isolates of K. pneumoniae, with 11,137 E. coli and 10,415 K. pneumoniae organism–drug combination annual percent susceptibilities available for analysis. Results (percent susceptible) for these 2 organisms included susceptibility to levofloxacin (n = 560 for E. coli and n = 528 for K. pneumoniae), ciprofloxacin (n = 615 and n = 583, respectively), imipenem (n = 494 and n = 465), meropenem (n = 339 and n = 321), gentamicin (n = 669 and n = 640), and ceftriaxone (n = 649 and n = 620). Baseline characteristics of hospitals reporting antibiograms remained consistent over the study period (Table 1). Most antibiograms were reported from medium-sized hospitals (57% of reporters, 49% of all hospitals) and the largest proportion was reported from Boston and metropolitan Boston hospitals (42% of reporters and 37% of all hospitals). Hospitals were approximately equally distributed between teaching hospitals (53% of reporters and 49% of all hospitals) and nonteaching hospitals (47% of reporters and 50% of all hospitals). Most hospitals did not differentiate reporting by patient population types, reporting all patients combined (60%). For this reason, and because we found an interaction between patient population and hospital size, patient population was excluded from the final model.
Reporting of E. coli and K. pneumoniae Susceptibility Testing via Antibiograms, Massachusetts, 2008–2018

a Defined by the Massachusetts Department of Public Health Office of Preparedness and Emergency Management.
b Hospital size: large, ≥300 beds; medium, 100–300 beds; small <100 beds.
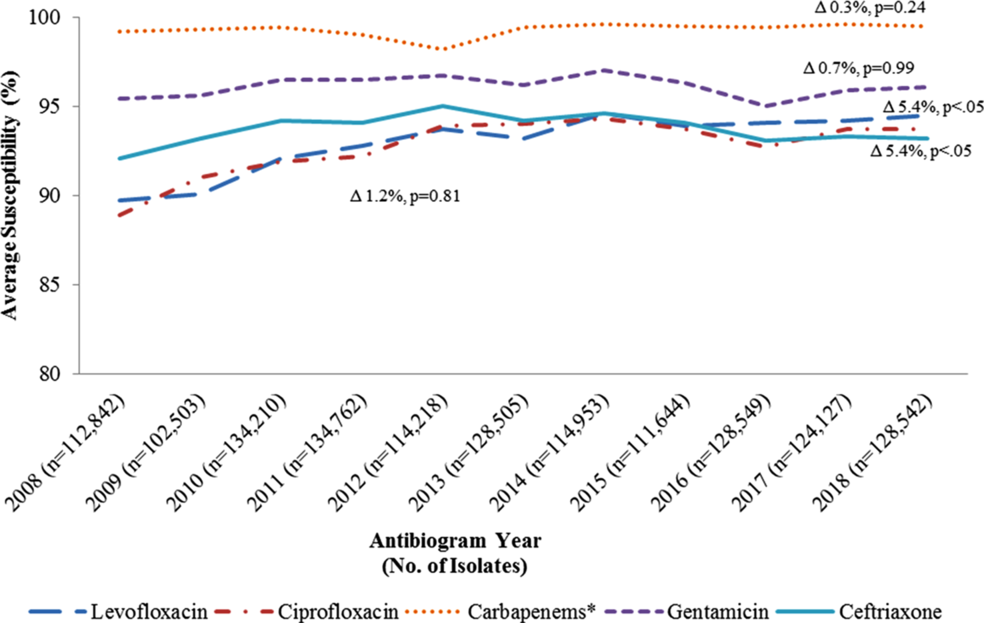
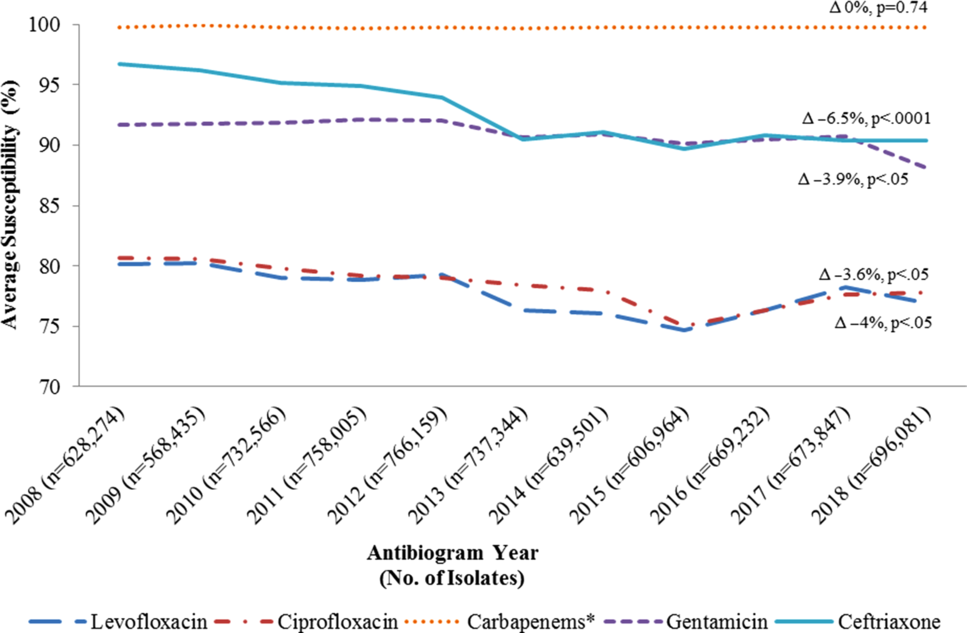
Escherichia coli and K. pneumoniae showed inverse trends in drug susceptibility over time. K. pneumoniae susceptibility to fluoroquinolones increased by 5% between 2008 and 2018 (P < .05) (Fig. 1). In contrast, E. coli susceptibility declined during the same period to ceftriaxone (6%), gentamicin (4%), and fluoroquinolones (4%) (P < .05) (Fig. 2). We detected no changes in susceptibility to carbapenems (imipenem and meropenem) for either organism. We detected small inflections in the E. coli susceptibility trends for several drug combinations. E. coli susceptibility to levofloxacin decreased by 3% between 2012 and 2013. Its susceptibility to gentamicin decreased by 2.6% between 2017 and 2018. We detected small increases in E. coli susceptibility between 2015 and 2016 to levofloxacin (1.6%), ciprofloxacin (1.3%), and ceftriaxone (1.1%). We also detected a 2% increase in K. pneumoniae susceptibility to ciprofloxacin between 2008 and 2009.
Trends in the mean annual percent of Klebsiella pneumoniae susceptibility to antibiotics reported from acute-care hospitals in Massachusetts, 2008 through 2018. *Includes meropenem and imipenem. **Δ represents the absolute relative change in average susceptibility.
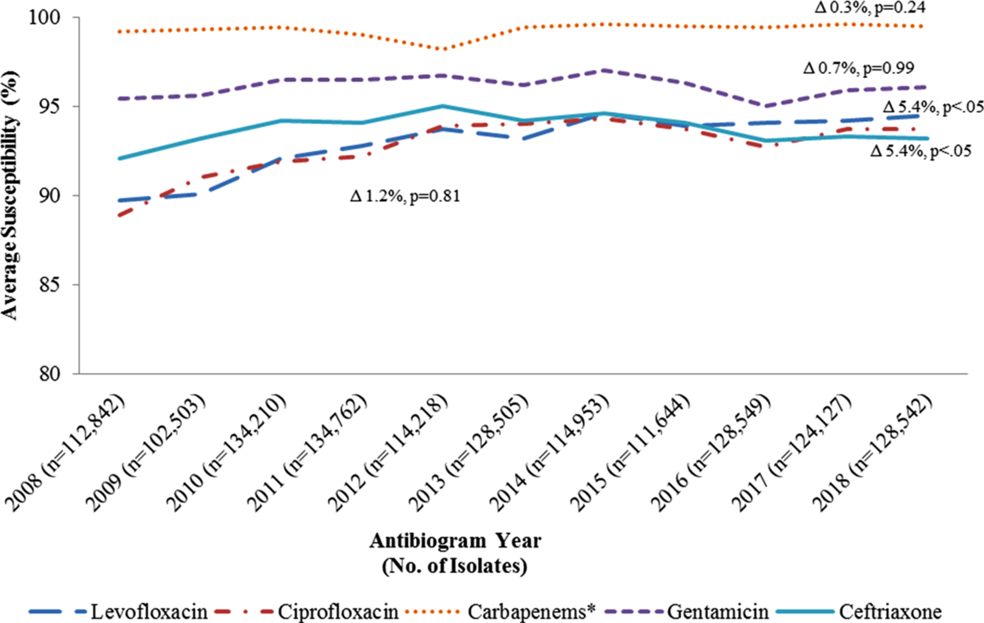
Trends in the mean annual percent of Escherichia coli susceptibility to antibiotics reported from acute-care hospitals in Massachusetts, 2008 through 2018. *Includes meropenem and imipenem. **Δ represents the absolute relative change in average susceptibility.

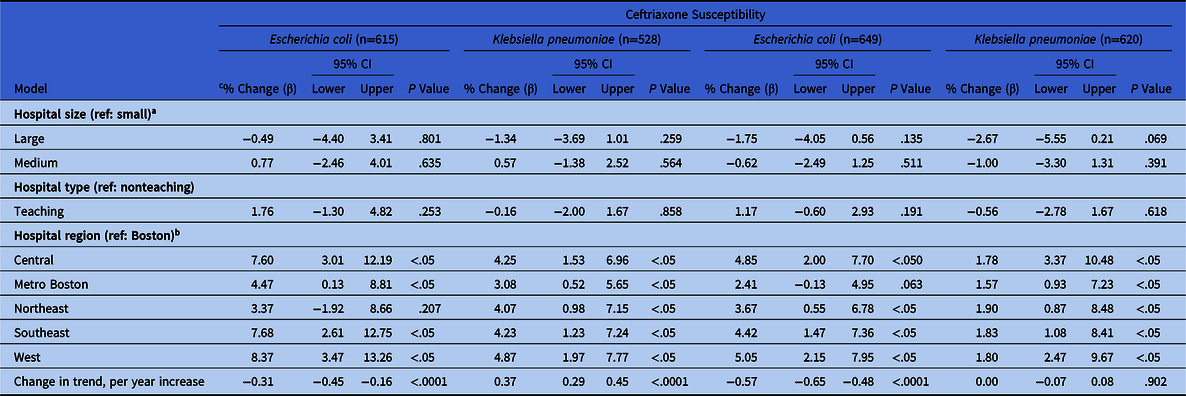
When controlling for time trend in the mixed-effects models on primary measures of ciprofloxacin and ceftriaxone susceptibility, hospital region was associated with changes in mean susceptibility trends measured by the β coefficient estimate (Table 2). Compared to Boston hospitals, E. coli isolates from hospitals in the Central, Metro Boston, Southeast, and West regions showed >4% increased susceptibility to ciprofloxacin: Central (β = 7.6; 95% CI, 3.0–12.2), Metro Boston (β = 4.5; 95% CI, 0.1– 8.8), Southeast (β = 7.7; 95% CI, 2.6–12.7), West (β = 8.4; 95% CI, 3.5–13.3). Hospitals in the Central, Northeast, Southeast, and West regions also reported higher susceptibility to ceftriaxone for E. coli (>3%). Isolates of K. pneumoniae showed higher susceptibility to ciprofloxacin (>3%) and ceftriaxone (>1.5%) in all regions when compared to Boston (P < .05). Per-year decreases were observed for susceptibility of E. coli to both ciprofloxacin (−0.3% per year; β = −0.3; 95% CI, −0.4 to −0.2) and ceftriaxone (−0.6% per year; β = −0.6; 95% CI, −0.6 to −0.5). K. pneumoniae showed a per-year increase in susceptibility to ciprofloxacin (0.4% per year, β = 0.4; 95% CI, 0.3–0.4).
Trends in Mean Susceptibility to Ciprofloxacin and Ceftriaxone via Linear Mixed Models, Massachusetts, 2008–2018

a Hospital size: large, ≥300 beds; medium, 100–300 beds; small <100 beds.
b Defined by the Massachusetts Department of Public Health Office of Preparedness and Emergency Management.
c β = beta coefficient. Estimates >1 represent greater susceptibility. Estimates represent the change in percent susceptibility when the predictor is increased by 1 unit and the other predictors are held constant.
Sensitivity models
We detected no significant changes in the time-dependent mean susceptibility after 2012 for K. pneumoniae and E. coli. No significant trend differences occurred among hospitals that reported consistently over the study period (n = 42, 56%) and those that reported less consistently (n = 33, 44%).
Discussion
Public health surveillance using hospital-generated antibiograms can illuminate antimicrobial susceptibility trends at the public health jurisdictional level. Divergent trends in E. coli and K. pneumoniae susceptibility to fluoroquinolones and cephalosporins were discernable at both state and regional levels. These trends mirror national trends in drug susceptibility for both organisms. 15 We observed decreases in E. coli susceptibility to 4 antibiotics from 2008 to 2018. The largest decrease in susceptibility occurred for ceftriaxone (6%). In the United States, quinolone resistance rates of Enterobacteriaceae, including E. coli, are 10%–30%, Reference Spellberg and Doi16 and this rate is >50% in other countries. Reference Dalhoff17 Pathogen factors, such as the global spread of a multidrug resistant E. coli subclone (ST131) Reference Pitout and DeVinney18 and use and misuse of antibiotics are associated with these increases. Reference Cusini, Herren, Bütikofer, Plüss-Suard, Kronenberg and Marschall19
In contrast to our findings with E. coli, K. pneumoniae showed increased susceptibility to fluoroquinolones (5%) and ceftriaxone (1.2%) over time. This trend may be the result of improved infection control practices targeting extended-spectrum β-lactamase (ESBL)–producing bacteria. Reference Abat, Raoult and Rolain20,Reference Kochar, Sheard and Sharma21 The differences in trends between E. coli and K. pneumoniae in our sample may reflect differences in pathogen prevalence: K. pneumoniae is more commonly associated with healthcare-associated infections, Reference Calfee22 whereas E. coli is prevalent in a variety of infections in the community and exposed to natural selection from use of antibiotics in the community, as well as in facilities. Reference MacFadden, Fisman, Hanage and Lipsitch23 E. coli is considered a more sensitive indicator of appropriate and inappropriate uses of antimicrobial drugs because it is the most common gram-negative pathogen in humans and in environments that relate to human activity. Reference Spellberg and Doi16,Reference Collignon24
In multivariable models that controlled for hospital bed size, time trend, and hospital type, regional differences in susceptibility to ciprofloxacin and ceftriaxone were observed over time. When compared to hospitals in Boston, hospitals in other Massachusetts regions showed 3%–10% higher E. coli and K. pneumoniae susceptibility rates to ciprofloxacin and ceftriaxone over time. These findings are unsurprising given that Boston has the largest number of tertiary-care hospitals in the state and that they serve a larger number of international patients. 25 Our analyses allowed us to discern trends at both the state and regional levels while controlling for other hospital characteristics. Hospital size, defined by number of beds, and hospital type (teaching vs nonteaching) were not associated with differences in susceptibility trends for ceftriaxone and ciprofloxacin. It has been argued that regional antibiogram reporting provides a more accurate baseline for comparison among hospitals serving different communities within the state and more accurately reflects infections in their patient populations. Reference Var, Hadi and Khardori26–Reference Peña and Estes28 Our results show that aggregate antibiograms created from acute-care hospital antibiograms can be used to monitor trends in antimicrobial susceptibility both statewide and in regions within the state.
Identifying trends in antimicrobial susceptibility can inform clinical practice and public health policy. The multivariable analyses examined 2 primary outcomes: susceptibility to ciprofloxacin and ceftriaxone. We looked at trends in susceptibility to other drugs (1) to visualize changes over time, and (2) to examine whether inflection points in 1 class of antibiotics (eg, fluoroquinolones) are reflected in changes in another class of antibiotics (eg, carbapenems). Our study provides one of the longest and most representative trend analyses of longitudinal hospital-level antibiotic susceptibility data at the state level. We detected no significant differences in susceptibility trends based on reporting years and inclusiveness of Massachusetts acute-care facilities for the period examined. In addition, we found no differences in susceptibility trends when we stratified by the number of years of antibiogram reporting to the MDPH.
Our study has a number of limitations. Because our analysis was ecological, we cannot infer whether these long-term trends were influenced by any particular policy or guideline changes. Although a number of inflection points were observed in our trend analyses, we cannot pinpoint associations with adoption of guidelines or changes in prescription practices, or differences between inpatient and outpatient practices at the facility level. E. coli showed an increased susceptibility (2%–5%) to fluoroquinolones between 2015 and 2017 coinciding with the Centers for Medicare & Medicaid Services (CMS) 2016 ASP requirement for hospitals receiving CMS reimbursement. 29 It is possible that implementation of clinical mandates for antimicrobial stewardship may be responsible for changes in utilization and that this might be reflected in susceptibility results, but changes in use out of concern regarding adverse effects with fluoroquinolone treatment may also be a factor.
In 2002, the National Committee for Clinical Laboratory Standards (now CLSI) developed guidelines to assist microbiology laboratories in generating standardized antibiograms. 30 A 2005 study by Zapantis et al Reference Zapantis, Lacy and Horvat31 showed that many institutions did not follow the recommended CLSI guidelines. We did not verify CLSI guideline compliance at all 75 acute-care facilities because it was beyond the scope of this study. However, all data reflect testing of 30 isolates or more and the first isolate per patient per year (as per CLSI guidelines). MDPH staff perform routine data quality and assurance checks in collaboration with reporting facilities, and sensitivity analyses did not detect any substantial change in trends by year. Internal quality checks at MDPH found that, as of 2008, 93% of antibiograms submitted excluded duplicate isolates. By 2010, >80% of hospitals reported aggregate susceptibility data in a standardized grid format, and almost all (89%) hospitals used the MDPH standardized grid format after 2012.
Lastly, isolates reported in antibiograms represent the first isolate cultured from each patient and may therefore underestimate the emergence of AMR during therapy. In addition, in vitro susceptibility tests depend on the performance of bacterial cultures in response to the clinical manifestations of infection and thereby may not represent community prevalence depending on selection of patients in whom cultures are obtained. We were unable to stratify our analyses by patient population or clinical source of isolates reported because most sites combined patient susceptibility results. Antibiogram data are aggregated across all patient types and specimen sources at the hospital level. For example, the proportion of isolates cultured from urine, as opposed to other sources, was indeterminate. The objective of our study was to explore the ability of aggregated antibiograms to convey baseline large-scale and regional susceptibility trends. Future research on the utility of antibiograms for susceptibility trend analysis should explore the validation of aggregated antibiograms as a proxy for population-level AMR. An evaluation to measure the effect of selective nonculturing on the frequency and distribution of resistance in the community is warranted.
A primary function of public health agencies is to conduct public health surveillance. Antibiograms provide public health agencies and clinicians with baseline AMR rates and indications of regional variation in these rates. Currently, routine antibiograms are one of the most available tools for monitoring AMR. Reference Fridkin, Edwards, Tenover, Gaynes and McGowan32-Reference El-Azizi, Mushtaq and Drake35 Many health departments are now investing in mechanisms to monitor multidrug-resistant organisms (MDROs) in healthcare and community settings. 36-38 Increasingly, jurisdictions are adopting or considering the use of aggregated antibiograms. Our experience shows that cumulative antibiograms can be used to monitor antimicrobial resistance, discern regional and facility differences, and detect changes in trends. With the increasing capture of antibiotic use data, Reference van Santen, Edwards and Webb39,Reference Watson, Wang, Klima, Moore-Clingenpeel, Gleeson, Kelleher and Jaggi40 the potential to combine these data to provide important information to stewardship teams and examine associations over time is also expanding.
Supplementary material
To view supplementary material for this article, please visit https://doi.org/10.1017/ice.2020.395
Acknowledgments
The authors are grateful to the microbiology laboratory staff of the acute-care facilities of Massachusetts for their time, dedication, and continued collaboration.
Financial support
No financial support was provided relevant to this article.
Conflicts of interest
The authors have no conflicts of interest related to this manuscript.