INTRODUCTION
The National Institutes of Health (NIH) Magnetic Resonance Imaging (MRI) Study of Normal Brain Development is a landmark study that documents structural brain development and behavior longitudinally from birth to young adulthood in a population-based sample of healthy children targeted to the United States 2000 census distribution. The goal is to establish a public database of pediatric anatomic MRI, magnetic resonance spectroscopy (MRS), and diffusion tensor imaging (DTI) with coordinated neuropsychological, neurological, and psychiatric data. The database will be used to describe the normative structural development of the human brain and to correlate developmental and individual variation in brain structure with behavior and cognition. This database will be released to the scientific and clinical community at a future date.
The findings from the neuropsychological testing are themselves of interest, independent of the imaging data, because they portray the neuropsychological status of this healthy, diverse, and representative sample of children of the United States as a point of reference for both developmental and clinical studies. A comprehensive description of the data will also support users of the database.
Children were carefully screened for medical, neurological, genetic, and psychiatric conditions that could influence brain development. Although development of a truly normative database was considered, the sample would have been substantially larger than resources allowed, and so we focused on describing a healthy population. The data collection sites are located in six urban regions. The sample is generally representative of the healthy United States population and provides a baseline for comparison with clinical groups where the primary questions involve suspected neurological, developmental, genetic or psychiatric impairment or disorder.
The project is divided into two “Objectives.” Objective 1 includes children from 4 years 6 months through 18 years at the time of recruitment. Objective 2 includes children from birth to 4 years 5 months at recruitment (Almli et al., 2006). Children between the ages of 4 years 6 months and 5 years 11 months are excluded from this report because the test battery differed from that of the rest of the Objective 1 children.
The present manuscript describes the first wave of cross-sectional neuropsychological data from Objective 1. The sample, test battery, and descriptive results are presented for children between the ages of 6 and 18 years. The imaging and database procedures are described in detail elsewhere (Evans, 2006).
The neuropsychological evaluation was developed to sample a range of cognitive and behavioral functions that are typically included in a standard neuropsychological assessment: intellectual level, language, visuospatial function, memory, executive functions, academic skills, and psychosocial adjustment. The battery included both performance based testing and questionnaires. In general, the tests chosen are widely used, have good reliability and validity, and can be administered reliably across sites. Some measures that did not meet all these criteria were chosen because they measure aspects of cognition relevant for brain-behavior correlation. A rigorous quality control procedure guarantees consistency across sites.
The present report has two aims: (1) to document the methods used to acquire the sample and collect the neuropsychological data and (2) to present descriptive data on the neuropsychological battery and to evaluate effects of age, sex, and income level on performance.
Because the primary goal of this project is to describe processes of structural and functional brain development, we focused on raw scores rather than standard scores in our evaluation of age effects. Standard scores convey the standing of an individual relative to peers of the same age. Although they effectively capture individual differences, they are necessarily insensitive to developmental differences, which will be best correlated with absolute performance on the task.
METHODS
Study Organization
Data are collected at 6 Pediatric Study Centers (PSCs) across the United States: Children's Hospital, Boston; Children's Hospital Medical Center of Cincinnati; Children's Hospital of Philadelphia; University of California at Los Angeles; University of Texas, Houston; and Washington University, St. Louis. A Clinical Coordinating Center (CCC) at Washington University, St. Louis coordinates the clinical/behavioral aspects of the project, including sampling plan and methods, recruitment, implementation of inclusion/exclusion criteria, screening and assessment, and quality control (QC) for all clinical and behavioral measures. The Data Coordinating Center (DCC) at the Montreal Neurological Institute, McGill University, coordinates the image acquisition protocols, imaging data quality and control, and image analysis and maintains a purpose-built database that consolidates and analyzes clinical/behavioral and structural MRI data.
Design
Participants were evaluated at baseline and followed at two-year intervals spanning a total of four years, ultimately accruing longitudinal data across the range from 4–22 years. More children are recruited in age ranges when rapid developmental changes are expected, and fewer when development is believed to be more stable. Power analyses were conducted to determine the minimum sample size in relation to potential change in the size of a brain structure in standard deviation units based on growth curve analyses spanning 3 time points. With 80% power, 340 subjects are required to detect 5% change and 532 to detect 4% change. The actual number of subjects was midway between these two target numbers. This report describes the baseline evaluation for children between the ages of 6 and 18 years.
Participants
The sample was recruited between February 2001 and October 2003 using a population-based sampling method that seeks to minimize biases that can be present in samples of convenience. The sampling plan was based on US Census (“Distribution of Income by Families and Race/Nationality, Census 2000,”) data to define low, medium, and high income categories for families in the overall population and to divide the United States income distribution for families into approximately equal thirds (∼33% in each category): less than $35,000 per year; $35,000 to $75,000 per year; and over $75,000 per year and to subdivide these groups based on the expected distribution of race/ethnicity within each income category. These race/ethnicity × income categories were then distributed across age, based on the planned age distribution, with males and females represented equally for each age category. The result was a table comprised of cells representing a target sample distributed by age, sex, race/ethnicity, and income.
Regionally specific target tables were then created in a multi-step process for each PSC. First, the demographics in the region of each PSC were characterized based on postal code census data to yield a local PSC race/ethnicity distribution table with specific age- and sex-based demographic targets. These tables were then adjusted so that they collectively approximated the national target distribution. The actual sample was recruited to match these targets as closely as possible.
Census data were used to identify postal codes within a 30 to 60 mile radius (depending on site) of each PSC that could be targeted to reach families likely to meet specific demographic criteria. Addresses of families within postal codes were obtained from a direct marketing agency (InfoUSA). Each PSC recruited to its target table until approximately 50% of the total sample had been accrued, after which recruiting was pooled across sites. The CCC maintained a real-time record of “open” and “filled” cells, and sites obtained approval for each new candidate. Because filled “cells” were closed to recruitment, some families who met eligibility criteria and were willing to participate could not be recruited. Because the recruitment period was ending, some participants were enrolled whose characteristics only approximated those of open cells.
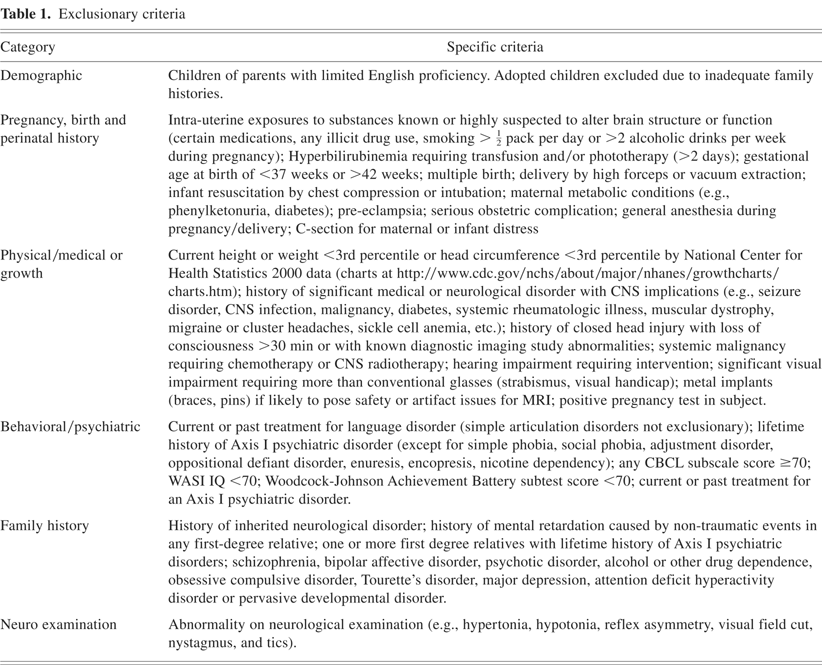
Families were carefully screened for potential exclusionary criteria, as detailed in Table 1. Children with a condition that could pose safety or artifact issues for MRI scanning (e.g., metal implants) were also excluded.
Exclusionary criteria

As families were screened for recruitment, further adjustments were made to account for regional differences in cost of living. Methods established by the Department of Housing and Urban Development (HUD) were used to adjust family income levels based on regional cost of living and family size. These “HUD-adjusted” incomes better equate income across sites and regions, thus providing a more meaningful indicator of socioeconomic status.
Families whose child met all inclusion and no exclusion criteria and whose demographic characteristics were compatible with an available cell were invited to the PSC for neurological evaluation, neuropsychological testing, and structural MRI imaging, typically performed in one day. Informed consent was obtained in compliance with research standards for human research for all participating institutions and in accordance with the Helsinki Declaration.
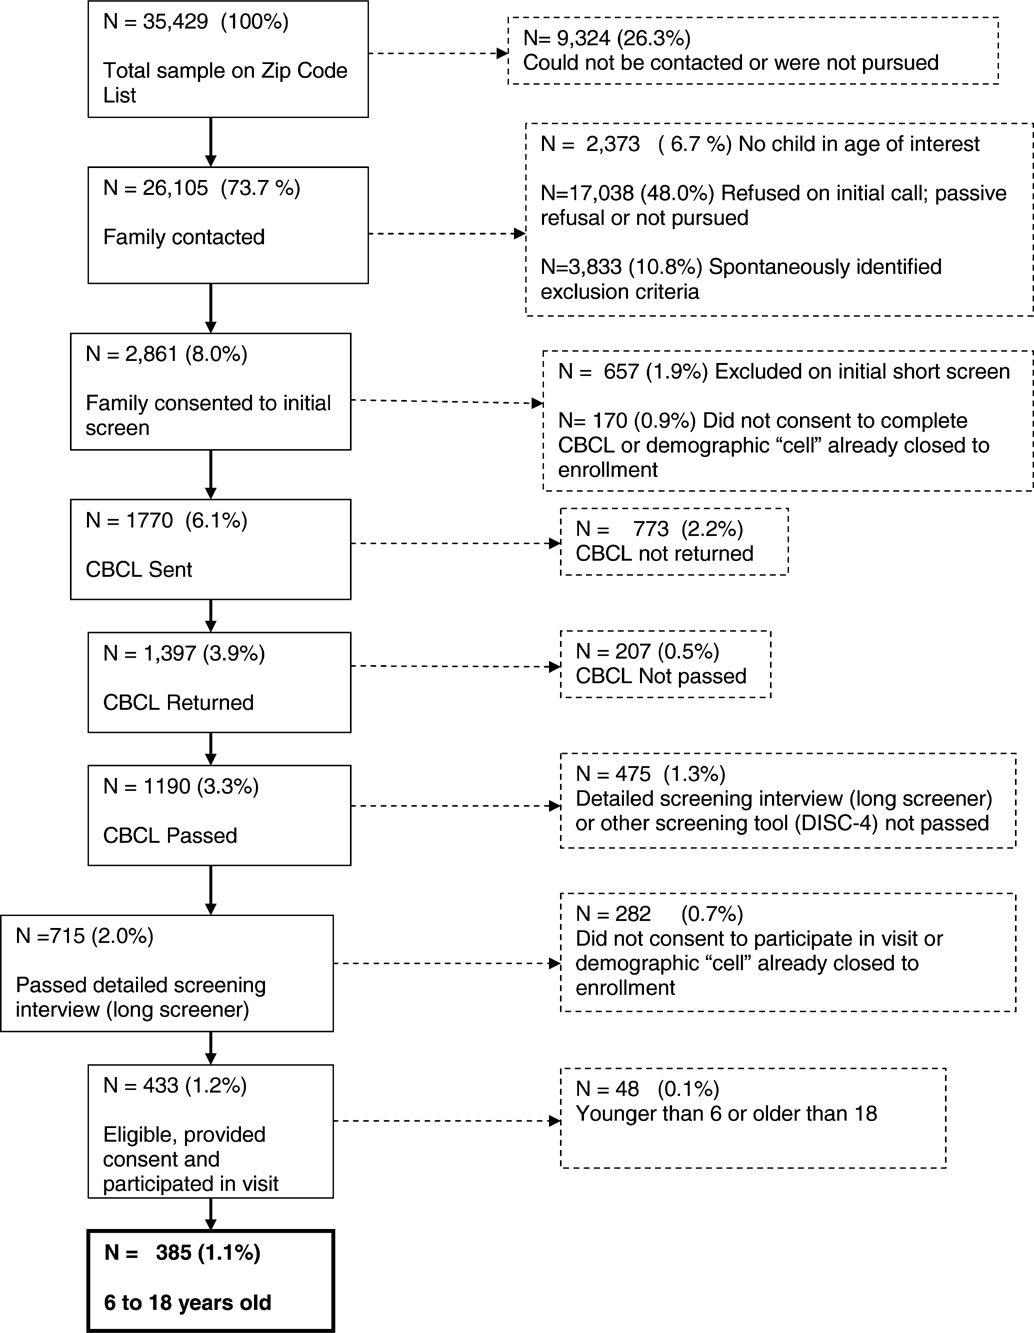
Figure 1 displays a schematic of the recruitment process, starting from the more than 35,000 packets sent to target families and ending with the 385 participants who are the subject of this report. Approximately 75% of the families contacted either actively or passively declined to participate or were not pursued, and another 21% met at least one exclusion criterion. The final sample comprised approximately 1.2% of the initial zip code based mailed letters, and 1.1% were in the age range included in the present report.

Recruitment scheme illustrating derivation of sample from initial zip code lists. Note that because the children were recruited to meet certain demographic criteria to fill specified “cells,” there were several points at which recruitment was not pursued because of sampling criteria and not exclusionary factors. Dashed lines indicate families that were excluded or chose not to continue with the process.
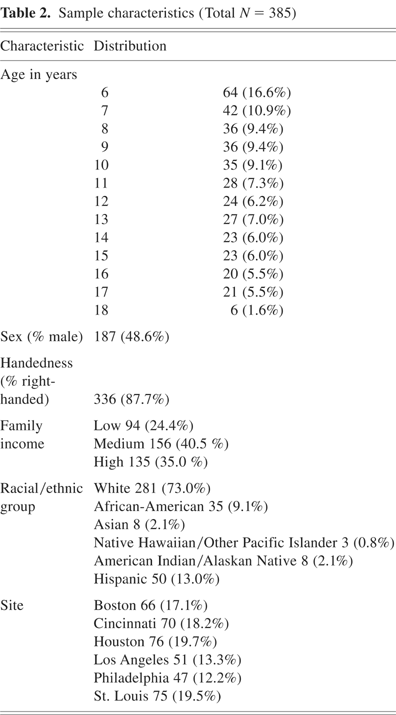
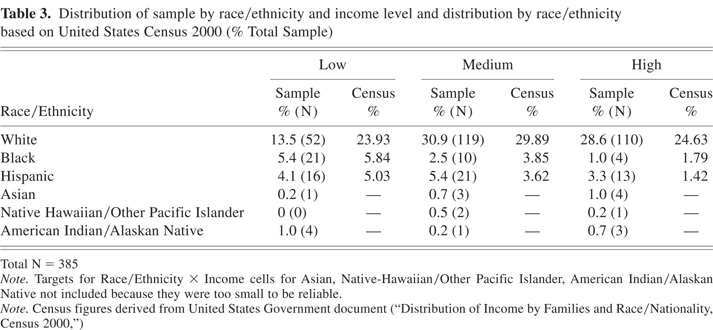
Table 2 displays the demographic characteristics of the sample, and Table 3 shows the sample distribution by race/ethnicity and income against the target distribution. Overall, the actual distribution nicely tracks the targets. Low income white children, however, are somewhat under-represented and high income white children over-represented. These deviations may reflect the relatively lower prevalence of low income white families in urban areas and the minor adjustments made to accrue the sample within time limitations, as indicated later.
Sample characteristics (Total N = 385)

Distribution of sample by race/ethnicity and income level and distribution by race/ethnicity based on United States Census 2000 (% Total Sample)

Children were screened on several behavioral and cognitive instruments in addition to the extensive history-based screening. The following test score criteria were exclusionary: T-score greater than 70 on any sub-scale from the Child Behavior Checklist (CBCL, Achenbach, 2001); Axis I psychiatric disorder based on the Diagnostic Interview Schedule for Children (C-DISC-4, Shaffer et al., 2003), except for simple phobia, social phobia, adjustment disorder, oppositional defiant disorder, enuresis, encopresis, and nicotine dependency (not exclusionary because no evidence was found linking these to structural brain development); Full Scale IQ below 70 on the Wechsler Abbreviated Scale of Intelligence (WASI, 1999); standard score below 70 on any of the administered subtests (Letter-Word Identification, Passage Comprehension, Calculation) from the Woodcock-Johnson III (WJ-III, Woodcock, et al., 2001). The Full Scale IQ lower limit was set at 70 to allow for inclusion of as broad a range of cognitive variability as possible but to exclude children with frank mental retardation. No child was excluded based on the WASI or Woodcock-Johnson test scores or the DISC-IV, presumably because those who would have met exclusionary criteria had already been screened out. (One child who obtained a score of 69 on one WJ-III subtest was retained because the child deviated by only one standard score point on only one subtest).
Although the rates of successful contact were similar across income groups, higher income families had higher rates of combined active and passive refusal (high, 60.8%; medium, 55.9%; low 44.1%). In contrast, lower income children were more likely to be excluded based on either the early screening interview (high, 21.8%, medium, 27.0%; low, 37.9%) or elevated CBCL subscale scores (High, 8.7%; Medium, 15.0%; Low, 19.4%), reflecting the greater morbidity in lower income populations.
A standardized clinical neurological examination screened children for abnormalities (e.g., hypertonia, reflex asymmetry, visual field cut). No child was excluded based on the neurological examination.
Measures
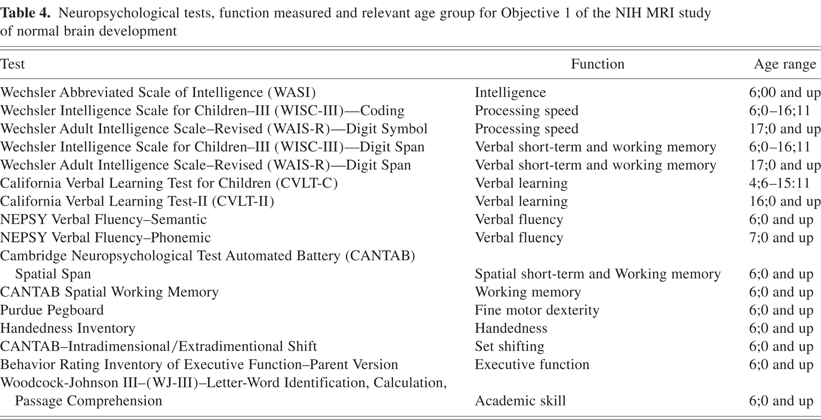
Table 4 displays the instruments used, the function measured, and the age range to which it was applied. The battery needed to be comprehensive but sufficiently brief that the child could complete it on the same day as the neurological examination and the MRI scan. The final battery typically took approximately three hours to administer.
Neuropsychological tests, function measured and relevant age group for Objective 1 of the NIH MRI study of normal brain development

Measures were chosen to be representative of a broad range of functions, to be familiar and widely available to pediatric neuropsychologists, to have good reliability and validity and to have appropriate norms provided by the test publisher. Some instruments were modified for this study (Handedness, NEPSY Verbal Fluency). For others, published norms were incomplete across the age range (Purdue Pegboard) or derived from samples of convenience (CANTAB), but the instrument measured a sufficiently important function to merit inclusion. Although the CANTAB is not widely used clinically, it was included because it measures functions that lend themselves well to brain-behavior correlation and potentially to future functional neuroimaging paradigms. There was no conflict of interest on the part of any of the investigators in the choice of any of the measures.
A quality confirmation (QC) procedure was implemented by the CCC. Videotapes from the PSCs were systematically reviewed to assure that all testers adhered to the procedures in the study manuals. Examiners were required to administer the tests to practice cases and submit materials to the CCC for review before testing actual subjects. Once testers achieved 90% agreement with QC reviewers, they were certified. Ongoing QC review guarded against drift. For each examiner, full QC was carried out for the first five study participants, and thereafter for every sixth. Comparison of data for children whose protocols were and were not submitted for QC review did not differ for any test, indicating that there had been no drift.
Further QC was implemented at the Data Coordinating Center (DCC). Sites submitted a hard copy of every third protocol, which was then reviewed against database entries and examined for scoring errors and errors in table look-up. The rate of errors was very low, .01% for scoring errors and .5% for input errors. In addition, for some tests the database automatically computed summary and standard scores, which were then compared to manual look-up of derived scores.
Specific measures are as follows:
Intelligence
Wechsler Abbreviated Scale of Intelligence (WASI) (Wechsler, 1999). The WASI provides a brief measure of intelligence. It yields a Verbal IQ (Vocabulary, Similarities), Performance IQ (Matrix Reasoning, Block Design), and Full Scale IQ score. Raw scores are available for the individual subtests: Vocabulary (number and quality of correct definitions); Similarities (number and quality of semantic concepts correctly described); Matrix Reasoning (number of matrices correctly solved); Block Design (number and speed of correctly solved items).
Processing speed
Wechsler Intelligence Scale for Children-III (WISC-III) Coding (Wechsler, 1991). This task requires that the child transcribe symbols that correspond to digits in a random field. Both speed and accuracy of transcription are reflected in the score. Raw scores indicate number of symbols accurately transcribed within time limit.
Wechsler Adult Intelligence Scale–III (WAIS-III) Digit Symbol (Wechsler, 1997). This is the adult version of the Coding task from the WISC-III. Raw scores indicate number of symbols accurately transcribed within time limit.
Verbal memory and fluency
Wechsler Intelligence Scale for Children-III (WISC-III) Digit Span (Wechsler, 1991). This task requires that the child repeat random digit strings of increasing length. There is a forward condition, in which the digits are repeated as presented (a measure of short-term memory), and a backward condition, in which the child must repeat the digits backward (a working memory task). Raw scores reflect the number of strings correctly repeated.
Wechsler Adult Intelligence Scale–III (WAIS-III) Digit Span (Wechsler, 1997). This is the adult version of the Digit Span task from the WISC-III. Raw scores reflect the number of strings correctly repeated.
California Verbal Learning Test for Children (CVLT-C) (Delis et al., 1994). Children are asked to learn a list of 15 concrete nouns that is presented five times. Short and long-delay retrieval, recognition memory, proactive interference from a new list, and clustering are also assessed. Raw scores reflect number of nouns correctly recalled for each condition.
California Verbal Learning Test-II (CVLT-II) (Delis et al., 2000). This is the adult version of the CVLT-C. The structure of the task is similar, but the categories are different and the list is longer, 16 words. Raw scores reflect number of nouns correctly recalled for each condition.
Verbal fluency
This task is based on the NEPSY Verbal Fluency Test. In the semantic component, children name as many animals as possible in one minute and similarly for a food/drink category. In the phonemic component, they name words starting with particular letters (F,A,S), each within a one-minute time limit. As in the NEPSY, we started the phonemic component at 7 years of age; however, we extended administration through adolescence, whereas the NEPSY stops at 12 years. The raw score for each is the number of correct words.
Spatial Short-Term and Working Memory
Cambridge Neuropsychological Test Battery (CANTAB) (CeNeS, 1998). This is a computer based neuropsychological test battery. Tasks are all non-verbal and children respond using a touch screen. The test developer does not provide a demographically balanced and comprehensive set of norms, but normative data are compiled from a variety of published and unpublished data sets. The following subtests were administered:
Spatial Span. This task is modeled on the Corsi Block Tapping Test (Milner, 1971), which is a spatial analogue of the Digit Span task. The child is presented with boxes, some of which change color one by one. The child is to point to the boxes that changed color in the same order. The raw score is the length of the longest sequence correctly recalled.
Spatial Working Memory. This is a serial order pointing task (Petrides & Milner, 1982). The child is to point to the boxes one by one to discover which ones contain a blue square, without pointing to the same box more than once. The number of boxes increases from two to a maximum of eight. However, children who were 6 or 7 years old were administered a maximum of six boxes based on prior reports (Luciana & Nelson, 1998) as well as experience with the measure early in the study in order to avoid undue frustration and fatigue. The raw score is the total number of return errors, both within and between items.
Fine motor dexterity
Purdue Pegboard (Gardner & Broman, 1979; Tiffin & Asher, 1948). Children place pegs with the dominant hand, the non-dominant hand, and both hands simultaneously within a time limit. The score is the number of pegs placed. For purposes of analysis, scores were converted to z-scores based on age in years and sex for each condition, using the Gardner and Broman (1979) norms, which extend only to age 15. The raw score is the number of pegs accurately placed within the time limit.
Handedness
Handedness inventory. The measure of hand preference is loosely based on the Edinburgh Handedness Inventory (Oldfield, 1971). It includes handwriting and seven gestural commands (use a hammer, throw a ball, use a toothbrush, point, eat with a spoon, cut with scissors, drink from a cup). The score distribution was clearly bimodal. Based on this distribution, the criterion for dominant hand preference was defined as at least seven of eight responses with the same hand.
Executive Functions
Intradimensional/Extradimensional Shift. This CANTAB task is similar to the Wisconsin Card Sorting Test. The child is shown two patterns and asked to choose the correct one by guessing. The relevant dimension shifts without a signal, and the child is to indicate the “correct” answer based on feedback (correct/incorrect) provided on the screen. For 6- and 7-year-olds, the task could be terminated after the Intradimensional Shift section because the Extradimensional Shift trials were too difficult and frustrating for many (Luciana & Nelson, 1998), especially in the context of a whole day evaluation. The raw score is number of stages successfully completed.
Behavior Rating Inventory of Executive Functions (BRIEF) (Gioia et al., 2000). This questionnaire measures dimensions of executive function as manifest in everyday life. The parent version was administered. The BRIEF generates three summary indices: Behavioral Regulation, Metacognition, and the Global Executive Composite. T-scores are generated for each index.
Academic skills
The Woodcock-Johnson III (Woodcock et al., 2001) is a well-standardized test of academic achievement. Three subtests were employed:
Letter-word identification. The child is asked to identify letters and then single real words of increasing difficulty, measuring single word reading competency. Raw score is the number of letters or words accurately read.
Passage Comprehension. The child is asked to read brief passages and respond to a question by providing the missing word (cloze procedure), measuring comprehension. Raw score is the number of items accurately completed.
Calculation. The child is given a series of calculation problems of increasing difficulty and asked to solve them, measuring calculation skills. Raw score is the number of problems successfully completed.
Psychosocial function
Child Behavior Checklist (Achenbach, 2001). This questionnaire asks parents to endorse child behavioral problems. It yields composite Internalizing and Externalizing scales, as well as a total behavior problems score. As indicated earlier, children were excluded from the study based on a T-score above 70 on any subscale (anxious/depressed, withdrawn/depressed, somatic complaints, social problems, thought problems, attention problems, rule breaking behavior, aggressive behavior). Although there was no laboratory measure of attention, the Attention Problems scale serves as an indicator of attentional processes.
Procedure
After screening and enrollment were completed, children were scheduled for a visit to the PSC. Neuropsychological testing was typically carried out on the day of the MRI scan or, in some instances, on a different day (within a 28 day window).
Statistical methods
Means, standard deviations, and ranges were computed for each measure for the entire sample and for individual integer ages, using standardized scores for descriptive purposes. To determine the influence of demographic characteristics, we regressed scores for each measure on age, sex, and income simultaneously. For composite scales (e.g., IQ), standardized scores were regressed on sex and income. Analysis of residuals and other indices of fit indicated a nonlinear relationship between a number of the raw score measures and age. Therefore, we modeled age using cubic regression splines.
Cubic regression splines represent a flexible approach to regression modeling that allows modeling of complex functions with the loss of relatively few degrees of freedom. They can be fitted and tested using any statistical software that includes standard linear regression. To fit cubic regression splines, the range of the predictor variable is divided into several contiguous regions. Separate cubic polynomials are then fitted to each region, but constrained so that the separate polynomials are joined smoothly where the contiguous regions meet. Standard regression procedures are then used to evaluate statistical significance and goodness of fit of the fitted line. The smoothing and other constraints allow a minimum of degrees of freedom to be expended in the modeling process while maintaining a clinically plausible function between predictor and outcome. Cubic polynomials have been recommended for use in epidemiologic research as a flexible means of fitting complex functions that avoid the loss of power associated with categorizing covariates (Greenland, 1995). Using the cubic spline regression models, we plotted the fitted regression lines for raw score measures to facilitate interpretation.
RESULTS
Descriptive Data
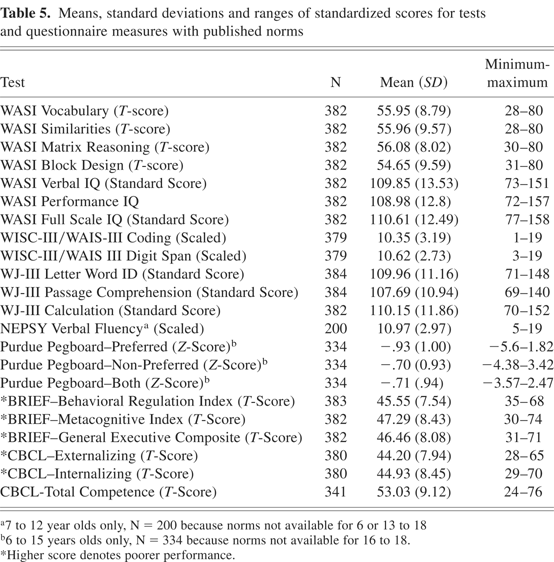
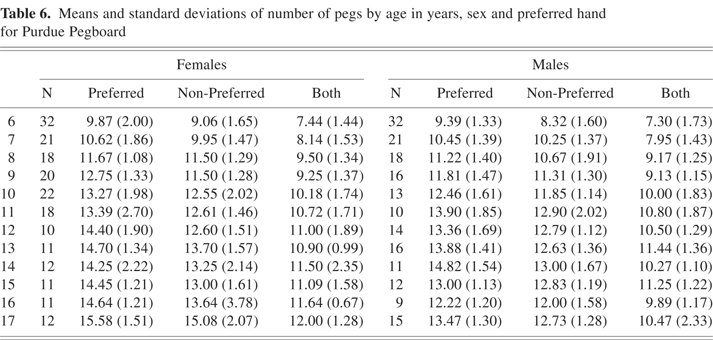
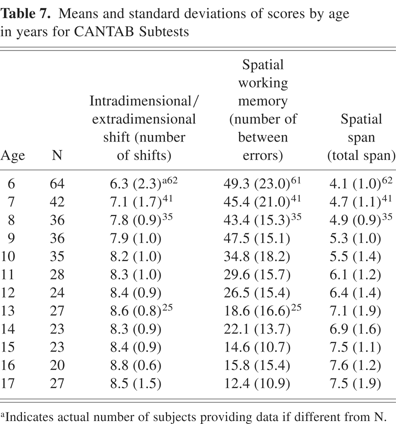
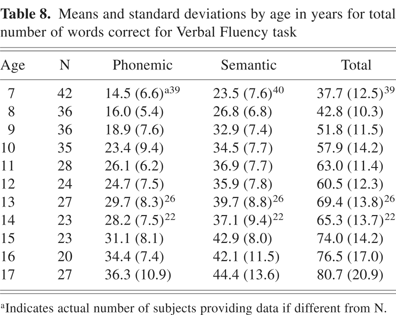
Descriptive statistics for the standardized measures for the sample as a whole are displayed in Table 5. These means are consistently superior to published means by t-tests (p < .0001). The WISC Coding subtest was somewhat closer to the mean (p < .05). The only exception to this pattern was the Purdue Pegboard, for which scores were well below published means (p < .0001). Means and standard deviations are presented by age (Table 6, Table 7, and Table 8) for measures for which existing norms are less reliable (Purdue Pegboard, CANTAB) or have a narrower age range than obtained here (Verbal Fluency).
Means, standard deviations and ranges of standardized scores for tests and questionnaire measures with published norms

Means and standard deviations of number of pegs by age in years, sex and preferred hand for Purdue Pegboard

Means and standard deviations of scores by age in years for CANTAB Subtests

Means and standard deviations by age in years for total number of words correct for Verbal Fluency task

Effects of Sex and Income Level on Performance
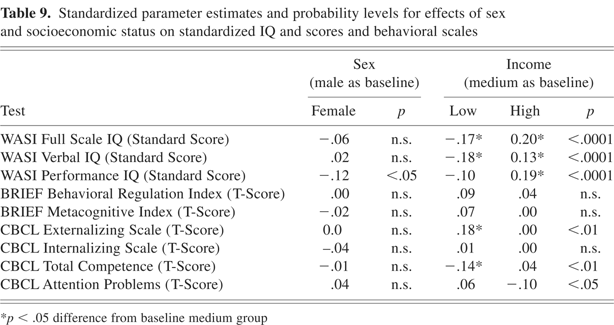
Table 9 displays the regression model for sex and income level for the composite IQ and behavior rating scales. Sex predicted only the WASI Performance IQ, boys achieving higher scores. There was a substantial effect of income level for all three IQ scales. The CBCL Externalizing and Total Competence scales, were also related to income level, as was the Attention Problems scale. Although lower income was associated with lower IQ, more externalizing behaviors and lower social competence, the mean performance of the Low Income group was better than the population means. Mean scores for Full Scale IQ [Mean (SD) Low, 105.1(12.8); Medium, 110.8 (11.9); High, 115.1(11.4)] and CBCL Externalizing [Mean (SD), Low, 46.8(8.5); Medium, 43.3(7.7); High 43.4(7.5)] are representative.
Standardized parameter estimates and probability levels for effects of sex and socioeconomic status on standardized IQ and scores and behavioral scales

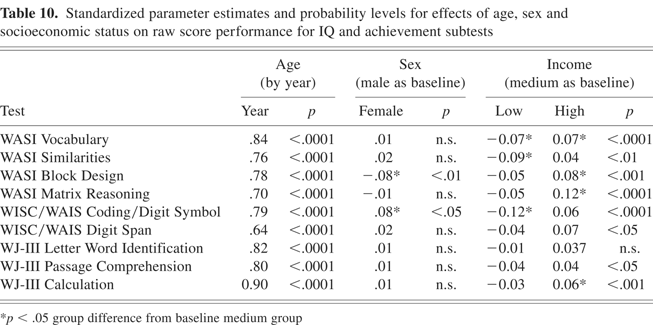
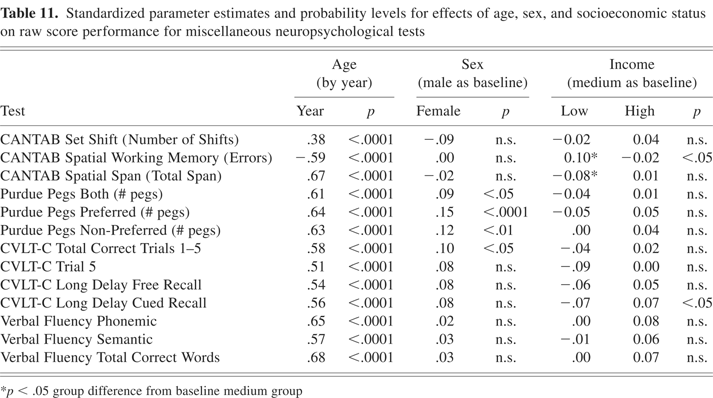
Tables 10 and 11 display comparable models for raw scores for specific subtests and cognitive measures, with age in the model. Age, of course, was a highly significant predictor for every measure. Sex was a significant predictor for WASI Block Design (males higher), as well as for Coding/Digit Symbol, Pegboard, and CVLT total correct (females higher). Income predicted all the WASI IQ subtests, as well as Coding and to a lesser extent Digit Span. In terms of academic achievement, income predicted Passage Comprehension and calculation but not Letter-Word ID. In contrast, income was only weakly associated with the specific neurocognitive measures, predicting only CANTAB Spatial Working Memory and CVLT Long Delay Cued Recall, with modest effect sizes.
Standardized parameter estimates and probability levels for effects of age, sex and socioeconomic status on raw score performance for IQ and achievement subtests

Standardized parameter estimates and probability levels for effects of age, sex, and socioeconomic status on raw score performance for miscellaneous neuropsychological tests

For some measures, the effect of age was modified by either sex or income, detected by significant interactions. Interactions of age with income were detected for WASI Matrix Reasoning (p < .01), Pegboard Preferred Hand (p < .05), and Verbal Fluency Phonemic (p < .05). Interactions with sex were detected for CANTAB ID/ED, Pegboard Preferred Hand, and the CVLT variables (all p < .05). The interactions are described below in the discussion of the cubic spline regression analyses.
Effects of Age on Raw Score Performance
The cubic spline regression analyses estimate the shape of the function relating age to performance, adjusting for the effects of sex and income level. Where interactions with sex or income level were detected, as outlined earlier, the spline regressions were also calculated separately for these groups. In addition to the linear effects of age cited earlier, non-linear effects emerged for most measures. The quadratic effect was significant (p < .01) for every measure except WASI Block Design, Wechsler Coding and Digit Span, CANTAB Spatial Span, and Verbal Fluency Phonemic Condition. The quadratic effects were somewhat weaker (p < .05) for W-J III Calculation, CANTAB Spatial Working Memory, and Purdue Pegs (Both Hands, Preferred Hand).
A significant cubic effect of age (p < .01) was documented for WASI Matrix Reasoning, W-J III Letter-Word ID and Passage Comprehension, CANTAB ID/ED Shift, Purdue Non-Preferred Hand, and Total Verbal Fluency. Weaker cubic effects were detected for CANTAB Spatial Working Memory and Verbal Fluency Semantic condition (p < .05).
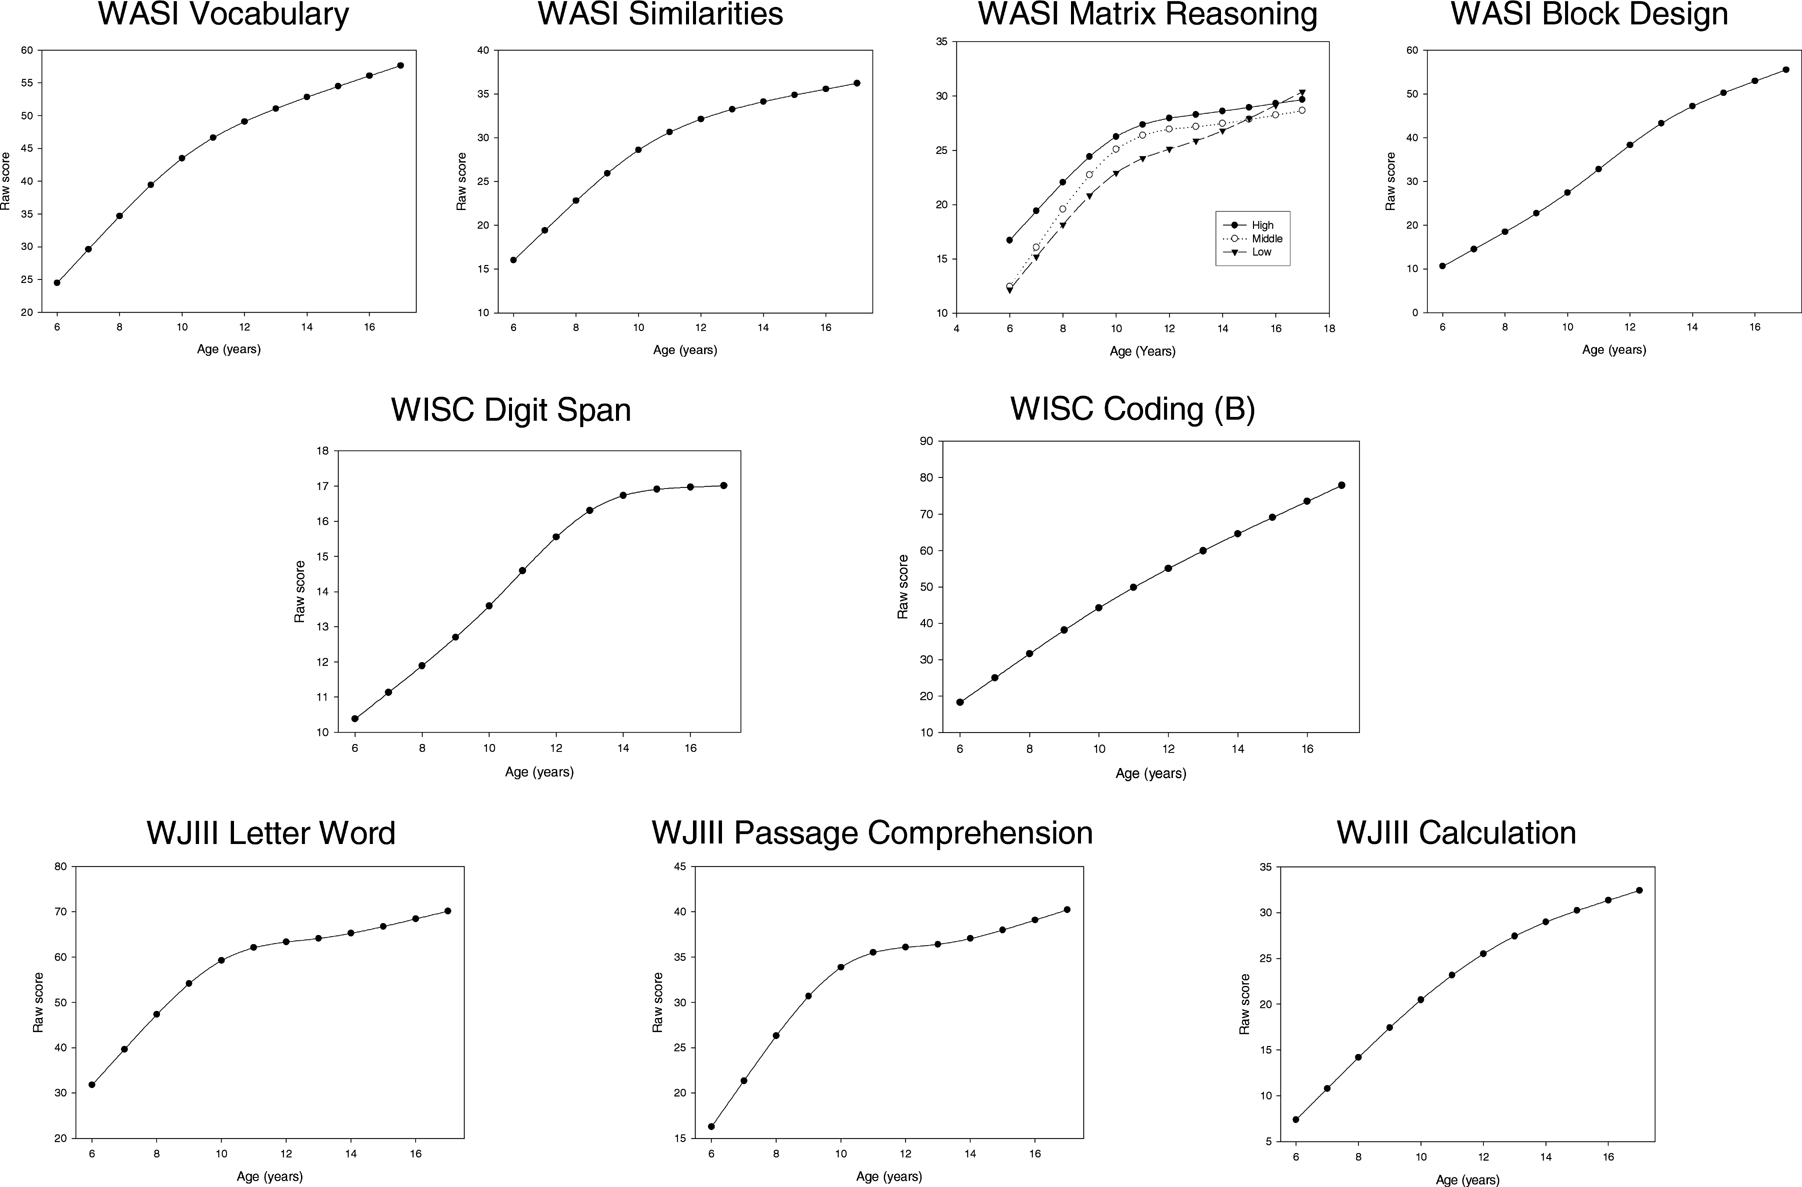
Functions for the WASI, WJIII, and WISC-III are displayed in Fig. 2. For the WASI and WJ-III subtests, performance climbed steeply from age 6, decelerating between 10 and 12 years of age. For Coding and Digit Span, there is a linear effect through the entire period. For Matrix Reasoning, the functions are illustrated separately by income level, reflecting apparent catch up of the middle and low income groups to the high income group by late adolescence.

Estimated relationship of age to raw scores for Wechsler Abbreviated Scale of Intelligence (WASI) and Woodcock-Johnson III (WJ-III) subtests adjusted for sex and income level. In addition to the linear effects of age, there were significant quadratic effects of age for WASI Vocabulary, Similarities, and Matrix Reasoning, as well as WJ-III Letter-Word (all p < .01) and WJ-III Calculation (p < .05). Significant cubic effects were present for WASI Matrix Reasoning and WJ-III Letter-Word and Passage Comprehension (p < .01). The function for WASI Matrix Reasoning is displayed separately by income groups (adjusted only for sex), reflecting the significant interaction of age with income for that variable.
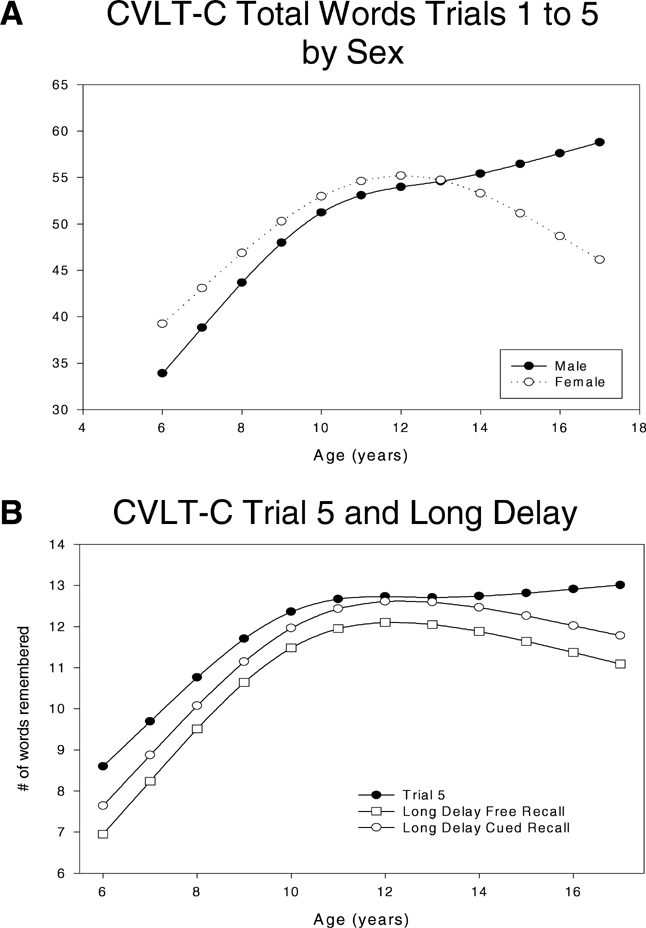
Figure 3 shows trajectories for the CVLT-C. For total words correct (Trials 1–5), the curve similarly decelerates between ages 10 and 12 and then shifts direction, with performance actually declining somewhat between 12 and 16. The same pattern emerges also for Long Delay Free and Cued Recall. The interaction with sex is illustrated for the Trials 1 to 5 variable only but was present for all four variables. Whereas the performance of the males rises monotonically throughout the age period, that of females actually declines throughout adolescence.

Estimated relationship of age to raw scores for California Verbal Learning Test for Children (CVLT-C). In addition to linear effects of age, there were significant quadratic effects for all outcomes (p < .01). (A) Estimated relationship of age to raw scores for Total Words Trials 1–5 displayed separately for males and females (adjusted for income) and (B) Estimated relationship of age to raw scores for Trial 5, Long Delay Free and Long Delay Cued Recall. Although the Age × Sex interaction is not displayed the CVLT variables in Fig. 3B in the interest of simplicity, this interaction was in fact significant for each of them and the shape of the functions for males and females is very similar to that displayed in 3A for Total Words Trials 1 to 5.
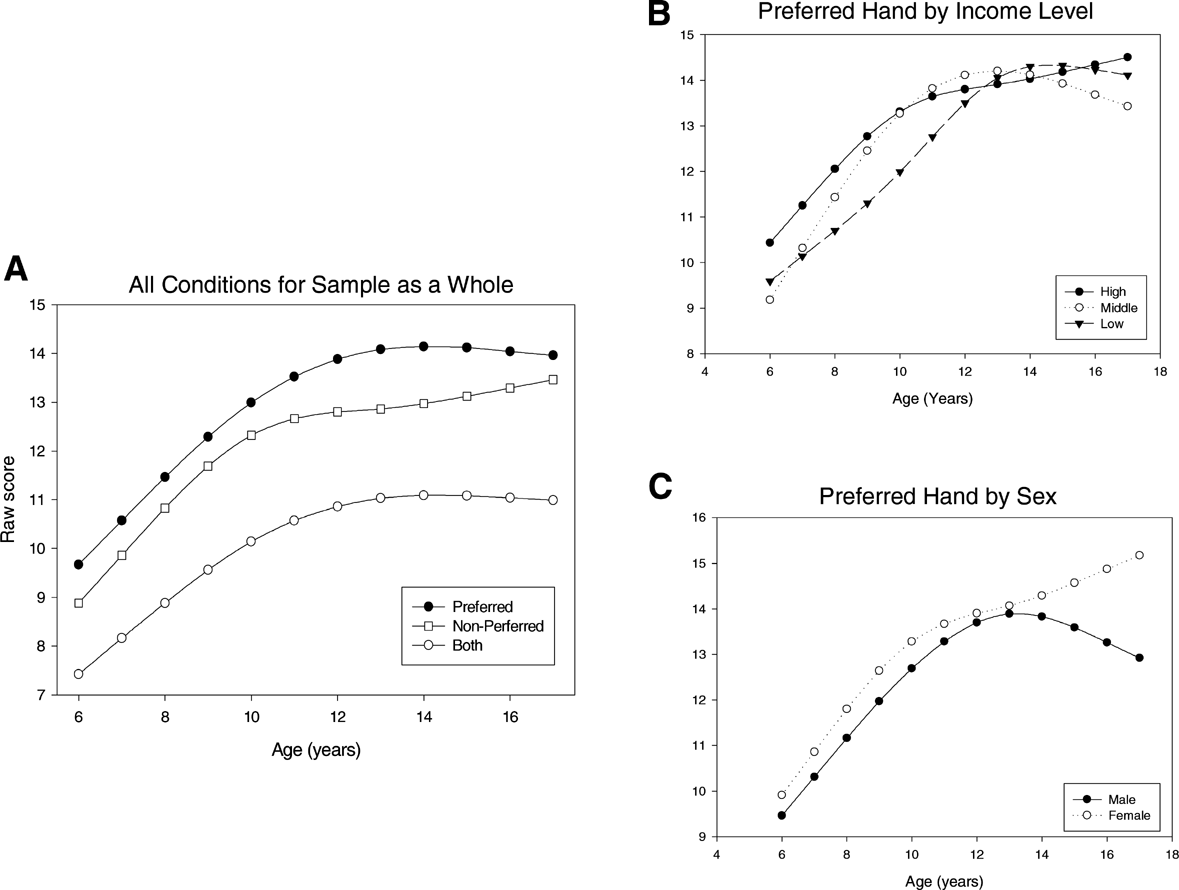
For the Purdue Pegboard (Fig. 4), performance increases steeply until 10 and then decelerates between ages 10 and 12 for all three conditions. For the non-preferred hand, performance further improves during adolescence, so that the non-preferred hand approaches the dexterity of the preferred hand late in adolescence. Interactions were observed for the preferred hand condition only. As the figure illustrates, the low income group catches up with the higher income group by adolescence. The performance of females improves monotonically throughout the adolescent period, but that of males declines.

Estimated relationship of age to number of pegs correctly placed on Purdue Pegboard. (A) Estimated relationship of age to number of pegs for preferred hand, non-preferred hand, and both hands adjusted for sex and income level. In addition to linear effects of age, there were significant quadratic effects for the preferred and both conditions (p < .05); a significant cubic effect was documented for the non-preferred condition (p < .05). Interactions of age with sex and income level were observed for the Preferred Hand condition only. (B) Estimated relationship of age to number of pegs correctly placed with preferred hand displayed separately for income level (adjusted for sex). (C) Estimated relationship of age to number of pegs correctly placed with preferred hand displayed separately for males and females (adjusted for income).
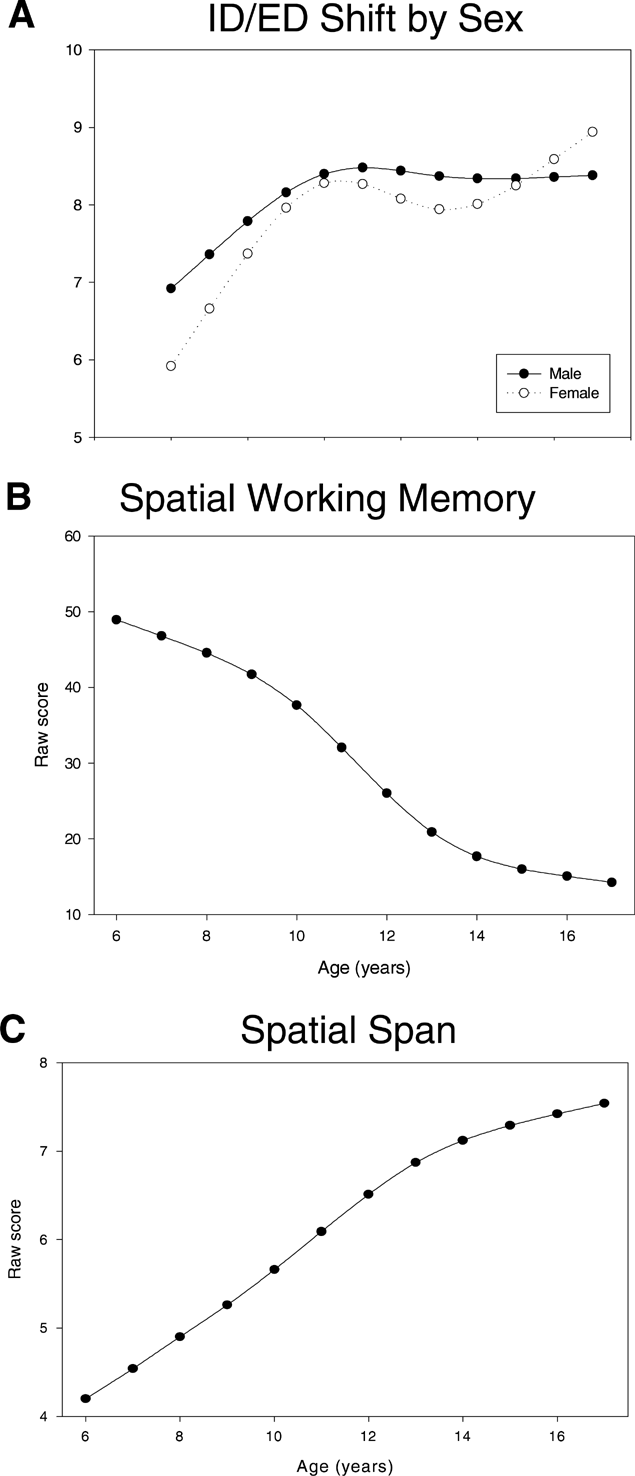
The CANTAB tasks are displayed in Figs. 5a to 5c. For ID/ED Shift (5a), the number of correct shifts increases steeply until about 10 years of age, levels off and then increases again beginning around age 14. The interaction illustrated in the Figure indicates that the shape of this function is largely because of the performance of the females. In contrast to the pattern for other measures, Spatial Working Memory errors decrease most rapidly between ages 10 and 14, not between 6 and 10. After age 14, the rate of decrease in errors slows. Spatial Span shows a strikingly similar pattern to Digit Span, increasing linearly through late adolescence.

Estimated relationship of age to outcomes for CANTAB subtests. (A) Estimated relationship of age to Intradimensional/Extradimensional Shift number of set shifts achieved displayed separately for males and females (adjusted for income); (B) Estimated relationship of age to spatial working memory total errors (adjusted for sex and income); (C) Estimated relationship of age to Spatial Span length of memory span (adjusted for sex and income). In addition to linear effects of age, there were significant quadratic (p < .01) and cubic (p < .01) effects for ID/ED Shift number of shifts. Fig. 5A suggests that this cubic effect is accounted for primarily by the females. There were also significant quadratic (p < .05) and cubic (p < .05) effects for Spatial Working Memory errors.
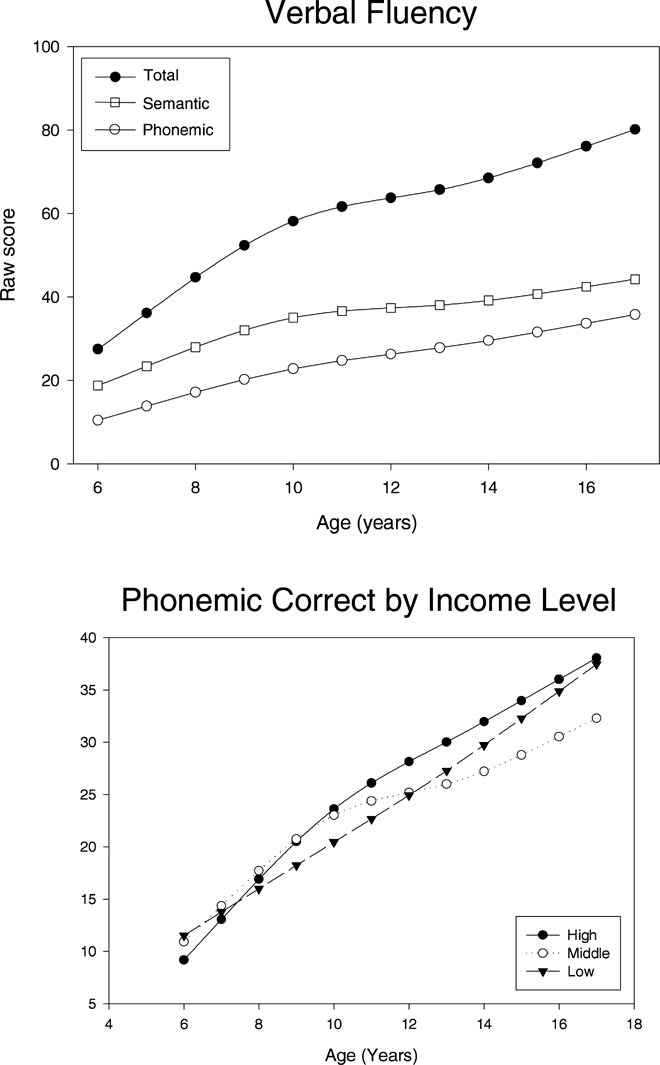
Finally, Verbal Fluency total words increases up to age 10, then levels off, but increases again later in adolescence (Fig. 6). The semantic and phonemic conditions similarly increase throughout the age span to late adolescence, with the semantic condition showing a trajectory like the total score. The interaction with income for the phonemic condition indicates somewhat different shapes of the trajectories for the three income groups, but the interpretation of this finding is not clear, and so this interaction is not illustrated in the Figure.

Estimated relationship of age to number correct words adjusted for sex and income level for Verbal Fluency task (Phonemic, Semantic, and Total). There were significant quadratic effects (p < .01) and cubic effects (p < .05) for Semantic and Total. The interaction between age and income level (adjusted for sex) for the Phonemic condition is depicted below.
DISCUSSION
This report describes the sampling strategy, demographic characteristics, and performance of the healthy school-age children who participated in the NIH MRI Study of Normal Brain Development on a standard neuropsychological battery. The racial/ethnic and income distribution of the sample generally approximates that of the 2000 United States census. Not surprisingly, these children consistently outperformed published norms, presumably because sources of morbidity were screened out by the exclusionary criteria. The only exception was the Purdue Pegboard; children in our sample placed fewer pegs than did those in the large normative sample of Gardner and Broman (1979). The reasons for this difference are not obvious. Because Gardner and Broman (1979) recruited their sample from a suburban community, the difference could be related to socioeconomic influences. We did not, however, find performance to be related to income level. The difference is also unlikely to reflect improper administration because of our rigorous quality control procedures. Another possibility is a cohort effect of unknown origin. In any event, the Gardner and Broman (1979) norms appear to overestimate normative performance, and caution should be used in applying them.
Effects of Sex on Task Performance
Girls performed better on measures of processing speed and motor dexterity, and boys better at perceptual analysis, consistent with prior studies (Halpern, 1997; Maccoby & Jacklin, 1974). Consistent with data localizing the sex-related cognitive operation to decompositing the perceptual cohesiveness of the designs (Waber, 1985), the findings suggest that perceptual analysis (Block Design) is sensitive to sex but perceptual reasoning (Matrix Reasoning) is not. Girls showed a slight advantage on verbal learning, but their performance actually declined through adolescence relative to boys, an unexpected finding. Sex-related differences in verbal fluency are reported in children and adults (Hines, 2004; Kraft & Nickel, 1995; Rahman et al., 2003), although not consistently (Harrison et al., 2000; Levin et al., 1991). Our sample did not demonstrate such a difference, nor were there differences for Calculation, indicating that at least at the procedural level of mathematics, boys and girls in this healthy sample do not differ.
Income Effects on Task Performance
Although household income level, not unexpectedly, predicted IQ, our low-income group nevertheless outperformed population norms. In terms of achievement, income level was related to reading comprehension and calculation but not to single word reading. The latter result is surprising given the consistent association between socioeconomic indicators and reading (Chatterji, 2006; Hecht et al., 2000). Income level reliably predicted IQ and achievement, but was only a weak predictor of performance on other cognitive measures, such as verbal learning or set shifting. Thus, income effects were more prominent for tasks requiring greater integration (e.g., reading comprehension and calculation versus single word reading), suggesting that integrative skills are more vulnerable to experiential influences associated with income. Screening out morbidity, which occurred at a higher rate in the low income families, may have allowed competencies of the healthy low income children, like single word reading, to emerge.
In terms of behavioral outcomes, the low income children exhibited more externalizing problems and lower social competence ratings than either the medium or high income groups. This difference was necessarily dimensional since children with scores in the clinical range on any CBCL scale were ineligible for the study. Scores on the BRIEF, the behavioral measure of executive function, were not, however, significantly related to income level. This result is somewhat surprising, given reports of poorer executive capacities in low income children (Howse et al., 2003; Mezzacappa, 2004; Noble et al., 2005; Waber et al., 2006). These reports, however, may reflect higher rates of morbidity in samples that were not as thoroughly screened as this one.
Age-Related Trajectories of Cognitive Task Performance
Perhaps most intriguing are the age-related trajectories for raw score performance. For most tasks, proficiency improved dramatically between 6 and 10 years of age, leveling off during early adolescence (approximately 10 to 12 years of age), suggesting that for many neurocognitive tasks, children approach adult levels of performance at that age. For a few measures, scores increased linearly throughout the age range. These were tasks that assessed basic information processing, such as Coding, Digit Span, and Spatial Span. Still others were associated with a non-linear component during adolescence. Some showed a flattening of the curve followed by another period of acceleration, suggesting another spurt in mid-adolescence. Verbal learning actually reversed direction with performance declining in later adolescence. Moreover, this effect appeared to be attributable to the performance of females. For a number of other measures as well, these age trajectories were modified by either sex or income level, in ways that may prove to be of greater interest vis-à-vis possible neural substrates.
Because these data are cross-sectional, these age-related functions must be viewed as preliminary. We cannot discriminate whether non-linear age profiles are typical of most individuals, or whether differentiation occurs in adolescence such that some children continue to progress, whereas others level off, yielding the observed group patterns. We also do not know whether specific effects, especially those related to sex or income level, are truly developmental or reflect the performance of the particular individuals who provided data at specific ages. Potential ceiling effects for some measures also merit consideration. Longitudinal data from the second and third visits will allow us to disambiguate these questions.
These age-related functions highlight epochs of potential interest for brain-behavior correlation. The forthcoming longitudinal data set will provide an opportunity to examine the natural course of development of these functions in tandem with structural brain development.
Limitations
This study provides normative behavioral and neuroimaging data on a diverse sample of healthy US children. A wide range of general intellectual functioning (WASI IQ scores ranged from 77 to 158) as well as economic and ethnic diversity is represented. Nonetheless, the thorough screening procedure resulted in a sample that is not representative of the population at large since children with potential threats to brain development were screened out. The direct marketing lists may have introduced bias because they are not epidemiologically compiled, and families without wire-line telephones could not be contacted, another potential source of bias. Another limitation is that only 1.5% of the more than 35,000 families initially solicited actually participated. Furthermore, because PSCs were located in urban centers, families from rural communities were less likely to be recruited, possibly resulting in the observed under-representation of low income white children.
Any strategy for recruiting healthy children for a study requiring multiple trips to the medical center and a lengthy evaluation, however, is inevitably vulnerable to self-selection bias. This bias was potentially minimized by the population-based sampling strategy, rather than recruiting samples of convenience or volunteers to advertisements. The rigorous screening procedures also limited the potential overrepresentation of families who volunteer because of concerns about their children.
CONCLUSION
Clinically, these data provide several points of reference. First, the norms from this healthy sample differ from typical norms, which include children with varying degrees of risk and morbidity. These data thus provide a benchmark for the performance of healthy children. Clinicians may wish to use them as an adjunct to standard norms, in which the prevalence of morbidity is not well documented, but they should not replace standard norms. They are, however, likely to be more informative than norms acquired from samples of convenience. Second, these norms provide estimates of the effects of sex and income level, so that performance of an individual can be referenced not only to age, but also to these other characteristics. Finally, the analysis of raw scores portrays age-related variation in absolute levels of performance, unlike standard scores, which mask developmental change, providing a more informed basis for estimating developmental trajectories in the clinical setting. From a research perspective, these data provide a better estimate of developmental trajectories than published norms because unknown sources and rates of morbidity are eliminated and socioeconomic characteristics of subgroups are specified.
In sum, the NIH MRI Study of Normal Brain Development provides a well documented normative description of the behavioral and neuroanatomical development of a large population-based sample of healthy children from diverse backgrounds and regions of the United States. This database will serve as an invaluable public resource for investigators for many years to come.
ACKNOWLEDGMENTS
The authors are grateful to the anonymous reviewers for their constructive insights and comments.
Researchers who are interested in using the database resulting from this project are encouraged to contact rozie@bic.mni.mcgill.ca. Deborah P. Waber, Department of Psychiatry, Children's Hospital, Boston and Harvard Medical School; Carl de Moor, Department of Psychiatry and Clinical Research Program, Children's Hospital, Boston and Harvard Medical School, Children's Hospital, Boston; Peter W. Forbes, Clinical Research Program; C. Robert Almli, Program of Occupational Therapy, Neurology and Psychology, Washington University School of Medicine; Kelly N. Botteron, Department of Psychiatry, Washington University School of Medicine; Gabriel Leonard and Denise Milovan, Cognitive Neuroscience Unit, McGill University; Tomas Paus, Montreal Neurological Institute and Brain & Body Centre, University of Nottingham; Judith Rumsey, National Institute of Mental Health.
The MRI Study of Normal Brain Development is a cooperative study performed by six pediatric study centers in collaboration with a Data Coordinating Center (DCC), a Clinical Coordinating Center (CCC), a Diffusion Tensor Processing Center (DPC), and staff of the National Institute of Child Health and Human Development (NICHD), the National Institute of Mental Health (NIMH), the National Institute for Drug Abuse (NIDA), and the National Institute for Neurological Diseases and Stroke (NINDS), Rockville, Maryland. Investigators from the six pediatric study centers are as follows: Children's Hospital Medical Center of Cincinnati, Principal Investigator William S. Ball, M.D., Co-Investigators Anna Weber Byars, Ph.D., Richard Strawsburg, M.D., Mark Schapiro, M.D., Wendy Bommer, R.N., April Carr, B.Sc., April German, B.A.; Children's Hospital Boston, Principal Investigator Michael J. Rivkin, M.D., Co-Investigators Deborah Waber, Ph.D., Robert Mulkern, Ph.D., Sridhar Vajapeyam, Ph.D., Abigail Chiverton, B.A., Peter Davis, S.B., Julie Koo, S.B., Jacki Marmor, M.A., Christine Mrakotsky, Ph.D., M.A., Richard Robertson, M.D., Gloria McAnulty, Ph.D; University of Texas Health Science Center at Houston, Principal Investigator Michael E. Brandt, Ph.D., Co-Principal Investigators Jack M. Fletcher, Ph.D., Larry A. Kramer, M.D., Co-Investigators Kathleen M. Hebert, Grace Yang, Vinod Aggarwal, M.D., Sushma V. Aggarwal; Washington University in St. Louis, Principal Investigators Kelly Botteron, M.D., Robert C. McKinstry, M.D., Ph.D., Co-Investigators William Warren, Tomoyuki Nishino, M.Sc., C. Robert Almli, Ph.D., Richard Todd, Ph.D., M.D., John Constantino, M.D.; University of California Los Angeles, Principal Investigator James T. McCracken, M.D., Co-Investigators Jennifer Levitt, M.D., Jeffrey Alger, Ph.D., Joseph O'Neil, Ph.D., Arthur Toga, Ph.D., Robert Asarnow, Ph.D., David Fadale, Laura Heinichen, Cedric Ireland; Children's Hospital of Philadelphia, Principal Investigator Dah-Jyuu Wang, Ph.D., Co-Principal Investigator Edward Moss, Ph.D., Co-Investigators Robert A. Zimmerman, M.D., Brooke Bintliff, B. Sc., Ruth Bradford, Janice Newman, M.BA. The Principal Investigator of the data coordinating center at McGill University is Alan Evans, Ph.D., Co-Investigators G. Bruce Pike, Ph.D., D. Louis Collins, Ph.D., Gabriel Leonard, Ph.D., Tomas Paus, M.D., Alex Zijdenbos, Ph.D., Rozalia Arnaoutelis, B.Sc, Lawrence Baer, M.Sc., Matt Charlet, Samir Das, B.Sc., Jonathan Harlap, Matthew Kitching, Denise Milovan, M.A., Dario Vins, B.Com., and at Georgetown University, Thomas Zeffiro, M.D., Ph.D. and John Van Meter, Ph.D. Nicholas Lange, Sc.D., Harvard University/McLean Hospital, is a statistical study design and data analysis Co-Investigator to the data coordinating center. The Principal Investigator of the Clinical Coordinating Center at Washington University is Kelly Botteron, M.D., Co-Investigators C. Robert Almli Ph.D., Cheryl Rainey, B.Sc., Stan Henderson M.S., Tomoyuki Nishino, M.S., William Warren, Jennifer L. Edwards M.SW., Diane Dubois R.N., Karla Smith, Tish Singer and Aaron A. Wilber, M.Sc.. The Principal Investigator of the Diffusion Tensor Processing Center at the National Institutes of Health is Carlo Pierpaoli, MD, Ph.D., Co-Investigators Peter J. Basser, Ph.D., Lin-Ching Chang, Sc.D., and Gustavo Rohde. The Principal Collaborators at the National Institutes of Health are Lisa Freund, Ph.D. (NICHD), Judith Rumsey, Ph.D. (NIMH), Laurence Stanford, Ph.D. (NIDA), and from NINDS, Katrina Gwinn-Hardy, M.D., and Giovanna Spinella, M.D. Special thanks to the NIH contracting officers for their support. We also acknowledge the important contribution and remarkable spirit of John Haselgrove, Ph.D. (deceased).