


Introduction
Forecasting the response of ice sheets to environmental variation is of considerable importance when investigating the worldwide effects of climate change. Ice-sheet modelling demonstrates that changes to ice-accumulation rates affect the flow and form of ice sheets. In order to model the current ice sheet properly, past changes in accumulation, as well as the present-day distribution, need to be understood. Accumulation records in East Antarctica are sparse. At ridge B, the object of this study, they are entirely absent. Past rates of accumulation can be established, however, from analysis of internal isochronous radar layers. In this paper, the englacial structure of the East Antarctic ice divide across ridge B is extracted from airborne ice-penetrating radar data acquired in the 1970s (Fig. 1), and this infor-mation is used to calculate the accumulation history of the ridge B region.
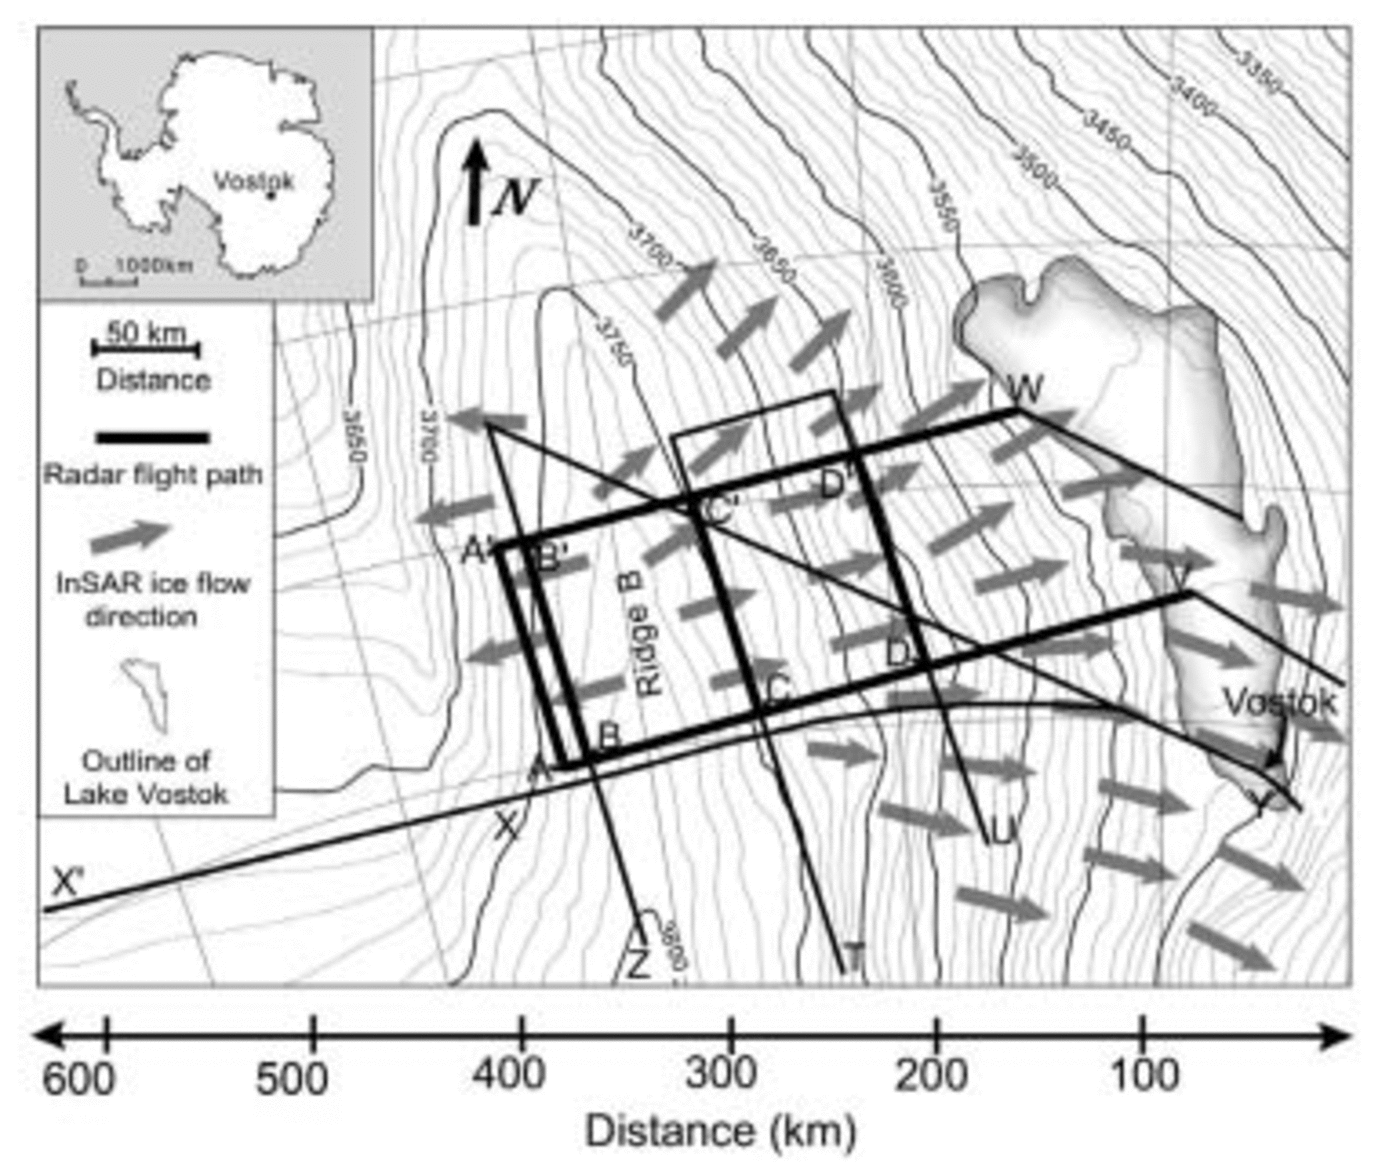
Overview of the radar flight paths around ridge B. The flight paths shown with a thick line are used for accumulation calculation in this study. The radar profiles and their traced layers are shown in Figure 2.
Methods
To calculate the accumulation rates from radar data, the depth (below the surface) and the age of internal layers are needed (e.g. Reference SiegertSiegert, 2003). At ridge B, internal radar layers are traced along four transects between Vostok lake and the ice divide (Fig. 1). The depth–age relationship defined by the layers is identified by dating the isochrons at their intersection with Vostok ice core (Reference PetitPetit and others, 1999). From these surfaces the averaged accumulation rate can be calculated using a variety of similar methods (e.g. Reference NyeNye, 1959, Reference Nye1963; Reference Dansgaard and JohnsenDansgaard and Johnsen, 1969; Reference Fahnestock, Abdalati, Joughin, Brozena and GogineniFahnestock and others, 2001a, Reference Fahnestock, Abdalati, Luo and Goginenib). In this paper, estimates of averaged accumulation rates are derived by fitting the age–depth relationship to a Dansgaard–Johnsen (D-J) model (Reference Dansgaard and JohnsenDansgaard and Johnsen, 1969) with a minimization technique used by Reference Fahnestock, Abdalati, Joughin, Brozena and GogineniFahnestock and others (2001a, Reference Fahnestock, Abdalati, Luo and Goginenib).
Radar data
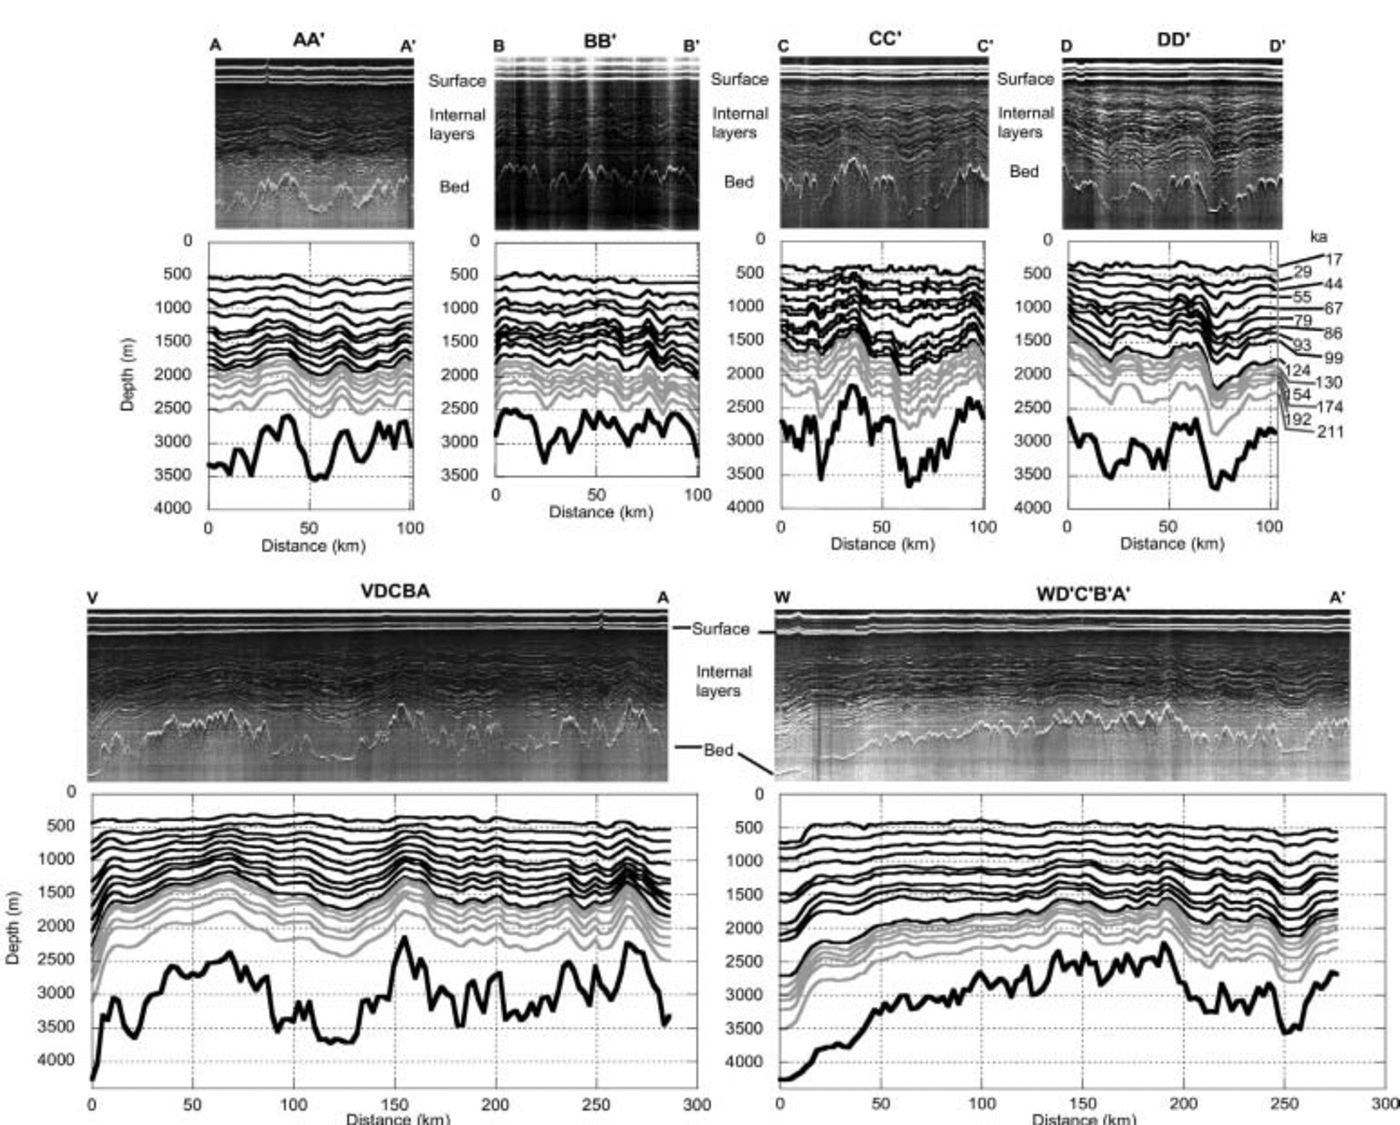
The raw radar data used in this study are illustrated in Figure 2 (top diagram in each transect), where the reflecting internal layers appear as bright lines. Strong reflecting layers were identified by hand. Fifteen layers were traced, and their intersection at transect crossovers was used to verify depth positions. The digitized layers from six radar line sections (AA′, BB′, CC′, DD′, VDCBA and WD′C′B′A′) are shown in Figure 2 (bottom diagram in each transect). The layers were dated at their intersection within line XY, which is linked directly to the Vostok ice core and its depth–age function (Fig. 1). Dated internal layers were then used to establish the depth–age relationship along the radar transects, across the whole ridge B region.
The raw radar data (top diagram in each transect) as well as the digitized layers (bottom diagram in each transect) are shown for the six radar flight sections around ridge B. Parallel to ridge B are the sections AA′ and BB′ on the west side and CC′ and DD′ on the east side (Fig. 1). Perpendicular to ridge B are VDCBA and WD′C′B′A′ crossing ridge B (Fig. 1). Digitized layers in black refer to those used in calculations of past accumulation, and grey lines denote additional layers extracted from the raw data. The age of the layers is shown for the section DD’ and is identical for the other sections.
Data errors
The reflection of an internal layer is not usually constant in its intensity or its quality along a radar flight-line. Depending on the angle and altitude of the aeroplane with respect to the ice surface, individual layers can vanish, which can result in the erroneous following of layers above or below the original. This mistake can also occur when layers fork, as happens on occasion. The more gaps and forks that occur along a radar line, the likelier it is that a large absolute error will occur while tracing a particular layer. Since internal layers cannot cross each other, however, the maximum error caused by tracing is restrained by the positions of neighbouring layers. This error is reduced by tracing as many layers as possible because we would expect the error to be, at most, the half-distance between adjacent layers. The averaged vertical depth between layers is about 100m at the Vostok ice core, so we are confident that we can identify and trace layers to within 50m at this location. Further, by matching layers at the intersection of radar lines, this error is reduced still further.
Models
A D-J model was used to calculate ice accumulation rates from dated radar layers. Along the radar transects the spatial distribution of averaged accumulation was calculated without accounting for the temporal change in thickness by minimizing the misfit between the traced record and the calculated position.
The D-J model fits the horizontal ice-flow velocity with depth with two linear functions and assumes no slip at the glacier bed. It follows that the ice in the top layer deforms at a maximum constant vertical strain rate and that the vertical strain rate in the bottom shear layer of thickness h drops linearly to zero. The modelled age t m of the ice layer at depth d = H = y is given by Reference Dansgaard and JohnsenDansgaard and Johnsen (1969, equations 12 and 15):


where y and H are the present and initial distance (equivalent to the ice thickness) from the bed (y is positive upwards from the bed). ʎH is the averaged accumulation rate we are interested in and th is the age of the ice at y = h given by Equation 1.
To obtain the averaged accumulation rate ʎH over a specific time period we minimize the misfit function f as in Reference Fahnestock, Abdalati, Joughin, Brozena and GogineniFahnestock and others (2001a, Reference Fahnestock, Abdalati, Luo and Goginenib) by:

where t ˚(i) is the observed age of the layer and n is the number of traced layers. To obtain a mean thickness for the shearing zone h, we estimated the value of h for each location by finding an optimized fit for the D-J model. Averaging at all locations led to a mean value of h = 484 m, which is approximately one-sixth of the mean ice thickness of the investigated area. Consequently, in this paper, h = (1/6)H. The results presented here must be viewed with this approximation in mind.
Results
General pattern of ice accumulation
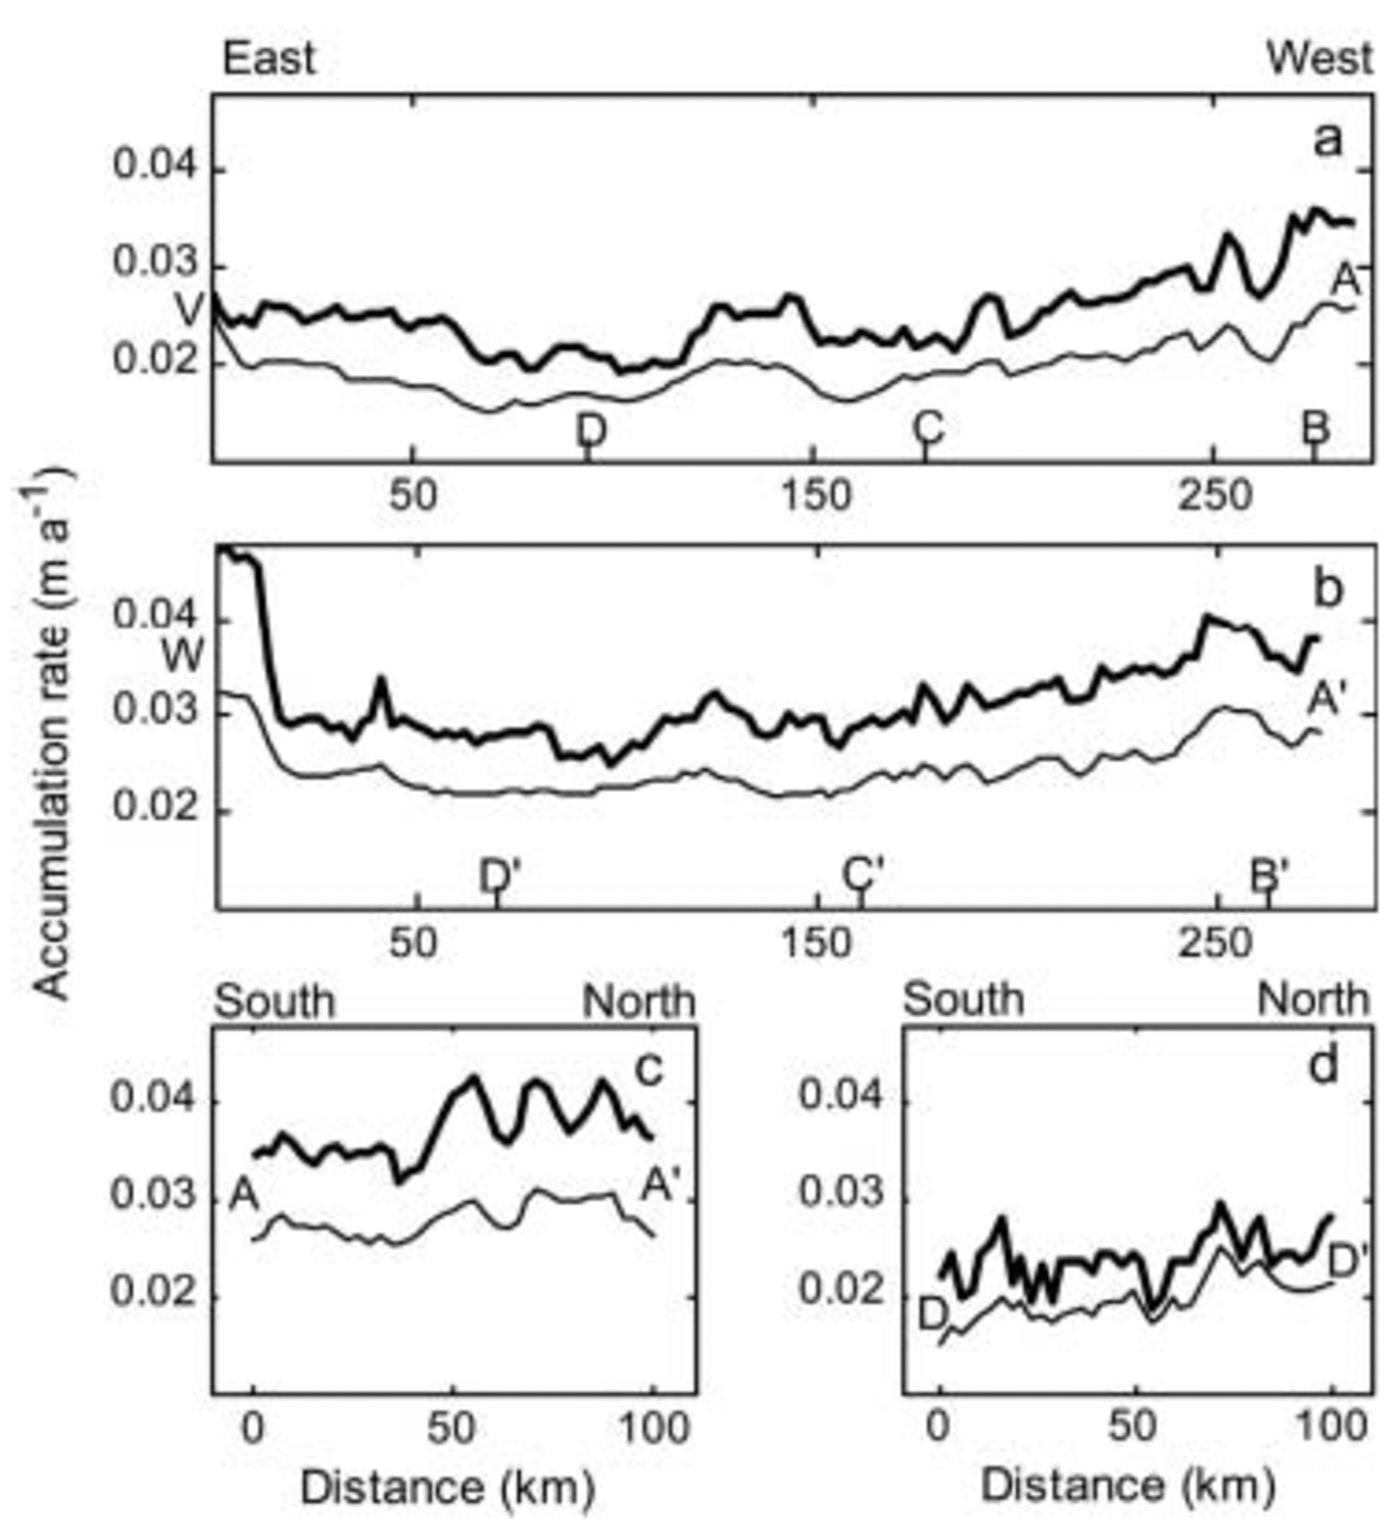
The D-J model was initially applied on two radar lines parallel to the axis of the ridge B ice divide (AA′ and DD′; Fig. 1) and on two sections perpendicular to ridge B (VDCBA and WD′C′B′A′; Fig. 1), for two time periods (0–17 000 and 0–99 000 years respectively). The results show a slight initial decrease followed by a general increase in the spatial distribution in accumulation from Vostok lake to ridge B (in accordance with Reference SiegertSiegert, 2003), and beyond into the Lambert drainage basin (see VDCBA and WD′C′B′A′; Fig. 3 and b). It should be noted that at site W the model is not applicable due to changes in flow regime associated with the grounding line at the western margin of Vostok lake (see Fig. 2 section WD′C′B′A′). The general increase in accumulation from Vostok lake to ridge B is approximately 0.006–0.008ma–1. However, along transect WD′C′B′A′ (Fig. 3) the accumulation rate is systematically 0.003–0.005 ma–1 greater than on section VDCBA located further to the south (Fig. 3), revealing an increase in accumulation from south to north. This accumulation pattern is also shown in two ridge-parallel sections AA′ and DD′ (Fig. 3 and d). To ensure that this pattern of accumulation is independent of the individual radar transects, we compared the accumulation rates at the end-points of section DD′ (Fig. 3; radar profile TU, Fig. 1) with the ones from VDCBA and A′B′C′D′W at its intersections with DD’ (Fig. 3 and b). The accumulation rates at these positions match well, which allows us to be confident about the results presented here.
Calculated accumulation rates averaged for the last 17 000 years (thick line) and the last 99 000 years (thin line) are shown along the radar flight path VAA′W (Fig. 1) for the sections (a) VDCBA, (b) WD′C′B′A′ and (c) AA′. In (d) the accumulation rate of the section DD′ from the radar flight path TU is shown. The right border of (a) and (b) is the western side of the section, and the right border of (c) and (d) is the northern side.
Temporal changes in ice accumulation
To investigate if the spatial pattern in ice accumulation has changed with time, we calculated the averaged accumulation rates for five different time slices along AA′, BB′, CC′ and DD′ (Figs. 1, 2 and 4). These time slices were chosen to allow the construction of an accumulation history since the Eemian interglacial. Only the upper ten traced layers, as shown with black lines in Figure 2, were used in these calculations. The accumulation for each time slice is given by:
Accumulation rates along four sections, (a) AA′, (b) BB′, (c) CC′ and (d) DD′, for five time slices in the past. The flight paths of (a–d) are shown in Figure 1, and the radar profiles and their traced layers in Figure 2. The right margin is the northern side of each section. flow of ice across Vostok lake (downstream of DD′), whose volume will be dictated by the flow of the overriding ice. Ice-sheet modelling investigations, using our accumulation data as input, could be used in future work to quantify the influence of ice-accumulation changes on the volume history of this large subglacial lake.


where ʎH 1 and ʎH 2 are the averaged accumulations obtained by the D-J model for layers to the depth of the respective ages t 1 and t 2.
The results show how the accumulation changes through time since the Eemian and with distance from the ridge B ice divide. Along DD′, the ice-accumulation rates for the last 17 000 years are around 0.005 ma–1 higher than those within the full glacial (around 70 000 years; Fig. 4 time period 67 000–99 000 years). However, as one moves toward ridge B, the accumulation rate is observed to vary far more with time, such that at AA′ (Fig. 4) the difference between the time-dependent maximum and minimum accumulation rates is > 0.01ma–1 (about twice as much as in DD′). This difference can be best explained by the Holocene (recent) accumulation-rate increases, compared to the full glacial conditions.
The rates of increase of ice accumulation from south to north are observed to change through time. For example, along DD′ (Fig. 4), recent accumulation rates are distinctly higher than earlier ones in the south (0–20 km). However, further north (60–100 km) older accumulation rates are quite similar to the recent values. In other words, the south–north lapse rate of ice accumulation has changed subtly along DD′ through the last glacial cycle.
Discussion
Use of the D-J model
The D-J model is only a one-dimensional model and by using it to calculate the accumulation rate we neglect the effect of the horizontal flow. This is mainly of significance in terms of the spatial accumulation pattern. The horizontal velocity increases from 0 ma–1 near ridge B to around 3 ma–1 on the western margin of Vostok lake. The general flow field is perpendicular to the surface elevation contours of grounded ice upstream of Vostok lake (Reference Kwok, Siegert and CarseyKwok and others, 2000). Along radar transects CC′ and DD′ the horizontal velocity is around 1 and 2 ma–1, respectively (Reference Kwok, Siegert and CarseyKwok and others, 2000). Assuming that the horizontal velocity was 1 ma–1, and that it has remained constant over time, the ice within a layer aged 100 000 years would originate from 100 km up-glacier, and a layer aged 17 000 years from only 17 km up-glacier. The four ridge-parallel sections AA′, BB′, CC′ and DD′ are approximately 50, 30, 40 and 110km away from ridge B, respectively. Considering that the four sections parallel to ridge B are within a region where we expect the surface velocity to be <2ma–1, the accumulation responsible for the upper radar layers could only have come from a few tens of kilometres upstream of the transects in which they were measured. The accumulation pattern shows a distinctive east–west and a slightly smaller south–north increase. This is seen in the accumulation rate for all time slices to various degrees, and leads us to believe that the inferred accumulation pattern is real and not affected adversely by the absence of horizontal flow in our model. It should be noted, however, that the south–north accumulation lapse rate on the Lambert side of ridge B, which is far greater than on the Vostok side, is in part due to the decrease in elevation along the transects in this area (AA′ and BB′) (see Fig. 1). The ridge-parallel transects across the Vostok side of the ice divide are not affected significantly by elevation changes.
To further investigate whether the observed spatial trend is real or merely an artefact of h, we re-ran the experiments using alternative values for h. The same accumulation trends were observed in all model runs. Large local changes in accumulation were observed when non-physical values for h were used, but even these extreme cases did not affect the predicted spatial trends in accumulation.
The applicability of the D-J model needs to be discussed in two further ways. Firstly, the kinematic boundary at the ice surface means that, in steady state, the surface vertical velocity will be the sum of the mass balance and a term related to the horizontal advection of surface elevation (Reference PatersonPaterson, 1994, p. 260, equation 49). Calculations using observed horizontal surface velocities indicate that the horizontal advection is an order of magnitude smaller than the mass balance, so that the latter is a good approximation to surface vertical velocity. Therefore, ignoring horizontal advection is unlikely to induce significant changes in the results of the calculated ice-accumulation rate. Secondly, the role of shear and vertical strain in the annual-layer thinning with depth (Reference PatersonPaterson, 1994, p. 280, equation 76) is given by the difference between vertical strain and horizontal shear strain (which in turn is related to the slope of the isochrons). This latter term is estimated at about an order of magnitude less than the vertical strain rate. Consequently we do not expect the absence of horizontal shear strain in the D-J model to affect the results presented here.
Implications for ice-flow changes
Accumulation rates, and their changes in time and space, will have consequences for the flow direction of ice. For the flow direction to be unchanged over glacial–interglacial cycles, the rates and patterns of ice accumulation would also need to be constant. Our calculations show that this is not the case upstream of Vostok lake. While the general pattern of ice accumulation (increasing from east to west and from north to south) is consistent through time, small perturbations to this pattern are noticed (e.g. along DD′; Fig. 4d). Such time-dependent change to accumulation will affect the flow pattern of the ice sheet. This has implications for the
Conclusions
Internal radar layers were traced across the ridge B ice divide, dated at their intersection with the Vostok ice core and used as input to a simple ice-flow model to calculate the ice-accumulation history for this region of East Antarctica. The main result of this investigation is a generalized view of the spatial and temporal variation in ice accumulation and thickness over the last 124 000 years. These results allow the following conclusions to be drawn.
Ice-accumulation rates increase from east to west (a range of 0.005–0.01ma–1) from Vostok lake and Vostok station, to the ridge B ice divide and beyond into the Lambert drainage basin.
Ice-accumulation rates also increase from south to north across all radar lines by 0.003–0.005ma–1.
Ice accumulation across the ridge B ice divide is noticeably asymmetrical over the last glacial cycle, with far more accumulation (0.023–0.04ma–1) on the western (Lambert) flank than on the Vostok side (0.017–0.03 ma–1) (see Fig. 3a and b).
Although general ice-accumulation patterns do not change much during the full glacial, there is a significant transition from glacial accumulation rates to Holocene accumulation rates over the Lambert side of ridge B (where a 50% increase is calculated) compared with the Vostok side (Fig. 4).
Small time-dependent changes to the south–north lapse rate of accumulation were identified over the last 124 000 years (e.g. DD’; Fig. 4d). Such changes will influence the flow direction of ice, which in turn could affect the flow of ice over Vostok lake and thus the volume of this subglacial lake.
Acknowledgements
The manuscript benefited significantly from thoughtful reviews by E. D.Waddington, M. Fahnestock, an anonymous reviewer and the Scientific Editor Weili Wang. Funding for this study was provided by UK Natural Environment Research Council grants NER/A/S/2001/01011 and NER/A/S/2000/01144.



