



1. Introduction
The study of two-dimensional (2-D) and quasi-2-D turbulence has a long history (Boffetta & Ecke Reference Boffetta and Ecke2012), from the discovery of the dual inverse energy, forward enstrophy cascade phenomenology (Fjørtoft Reference Fjørtoft1953; Kraichnan Reference Kraichnan1967) to early numerical simulations (Lilly Reference Lilly1969) and laboratory experiments (Sommeria Reference Sommeria1986). Such problems are of interest as idealized models of geophysical fluid dynamics (Pedlosky Reference Pedlosky1987) and, more recently, active fluid flows where energy-consuming microswimmers can drive vortices and jets (Dombrowski et al. Reference Dombrowski, Cisneros, Chatkaew, Goldstein and Kessler2004). In a finite system, the nonlinear transfer of kinetic energy from small to large scales in an inverse cascade generates large-scale coherent structures, typically vortices or jets, called condensates (Smith & Yakhot Reference Smith and Yakhot1993). Inverse energy cascades are also observed in simulations of highly anisotropic three-dimensional (3-D) flows within thin layers (Smith, Chasnov & Waleffe Reference Smith, Chasnov and Waleffe1996; Celani, Musacchio & Vincenzi Reference Celani, Musacchio and Vincenzi2010), rapidly rotating turbulence (Deusebio et al. Reference Deusebio, Boffetta, Lindborg and Musacchio2014), strongly stratified flows (Sozza et al. Reference Sozza, Boffetta, Muratore-Ginanneschi and Musacchio2015) and can arise in magnetohydrodynamic systems as well (Seshasayanan, Benavides & Alexakis Reference Seshasayanan, Benavides and Alexakis2014; Dallas & Alexakis Reference Dallas and Alexakis2015; Pouquet et al. Reference Pouquet, Rosenberg, Stawarz and Marino2019). Such quasi-2-D inverse energy cascades can also lead to large-scale condensation if large-scale damping is weak (Seshasayanan & Alexakis Reference Seshasayanan and Alexakis2018; van Kan & Alexakis Reference van Kan and Alexakis2019; Musacchio & Boffetta Reference Musacchio and Boffetta2019). Moreover, condensation is known to occur in rapidly rotating convection (Julien et al. Reference Julien, Rubio, Grooms and Knobloch2012; Favier, Silvers & Proctor Reference Favier, Silvers and Proctor2014; Guervilly, Hughes & Jones Reference Guervilly, Hughes and Jones2014; Rubio et al. Reference Rubio, Julien, Knobloch and Weiss2014) and convection driven by an imposed heat flux (Vieweg, Scheel & Schumacher Reference Vieweg, Scheel and Schumacher2021), and has been reported in active fluid flows (Linkmann et al. Reference Linkmann, Boffetta, Marchetti and Eckhardt2019, Reference Linkmann, Marchetti, Boffetta and Eckhardt2020; Puggioni, Boffetta & Musacchio Reference Puggioni, Boffetta and Musacchio2022). There is also extensive literature on experimental studies of quasi-2-D large-scale condensation (Sommeria Reference Sommeria1986; Paret & Tabeling Reference Paret and Tabeling1997; Xia et al. Reference Xia, Byrne, Falkovich and Shats2011; Xia & Francois Reference Xia and Francois2017; Fang & Ouellette Reference Fang and Ouellette2021). Recent reviews of quasi-2-D turbulence are provided by Alexakis & Biferale (Reference Alexakis and Biferale2018) and Alexakis (Reference Alexakis2023).
In addition to structure formation at the largest scales, another type of self-organisation widely observed in fluid flows is the vortex crystal, a regular array of smaller-scale vortices. For instance, such structures are observed in rotating convection (Boubnov & Golitsyn Reference Boubnov and Golitsyn1986, Reference Boubnov and Golitsyn1990; Zhong, Ecke & Steinberg Reference Zhong, Ecke and Steinberg1991; Vorobieff & Ecke Reference Vorobieff and Ecke2002; Boubnov & Golitsyn Reference Boubnov and Golitsyn2012), in rotating body-forced turbulence (Di Leoni et al. Reference Di Leoni, Alexakis, Biferale and Buzzicotti2020), in experiments on magnetised electron columns (Driscoll et al. Reference Driscoll, Schecter, Jin, Dubin, Fine and Cass1999; Schecter et al. Reference Schecter, Dubin, Fine and Driscoll1999) and quantum fluids (Tosi et al. Reference Tosi, Christmann, Berloff, Tsotsis, Gao, Hatzopoulos, Savvidis and Baumberg2012), as well as in active fluids, including dense suspensions of microswimmers such as sperm cells (Riedel, Kruse & Howard Reference Riedel, Kruse and Howard2005). The polar vortices on Jupiter (Adriani et al. Reference Adriani2018; Siegelman, Young & Ingersoll Reference Siegelman, Young and Ingersoll2022) provide another particularly compelling example. Vortex crystals have also been found in 2-D turbulence subject to spectral truncation at large scales (Smith & Yakhot Reference Smith and Yakhot1994) or forced with a mixture of random and deterministic forcing (Jiménez & Guegan Reference Jiménez and Guegan2007). The emergence and melting of active fluid vortex crystals has already been investigated (James et al. Reference James, Suchla, Dunkel and Wilczek2021), with a focus on the 2-D case. More generally, 2-D chiral lattices, which also arise in the study of active solids (Baconnier et al. Reference Baconnier, Shohat, López, Coulais, Démery, Düring and Dauchot2022), are currently of great interest in physics because they support topologically protected edge states (Nash et al. Reference Nash, Kleckner, Read, Vitelli, Turner and Irvine2015; Mitchell Reference Mitchell2018; Mitchell, Nash & Irvine Reference Mitchell, Nash and Irvine2018), and fluid dynamical vortex crystals provide, in principle, a simple laboratory realisation of such systems.
Sustaining any fluid flow in a stationary state against dissipation requires the injection of energy by a forcing mechanism. To facilitate a detailed analysis of the complexities of turbulence, highly idealized forcing functions are often considered. For instance, one can choose a time-independent forcing, as in the case of Kolmogorov flow (Arnol'd & Meshalkin Reference Arnol'd and Meshalkin1960; Meshalkin & Sinai Reference Meshalkin and Sinai1961; Borue & Orszag Reference Borue and Orszag1996; Gallet & Young Reference Gallet and Young2013), or a stochastic forcing with a constant energy injection rate (Novikov Reference Novikov1965). The latter choice in particular has been widely adopted in numerous studies of forced 2-D turbulence, see e.g. Smith & Yakhot (Reference Smith and Yakhot1993), Boffetta (Reference Boffetta2007), Chan, Mitra & Brandenburg (Reference Chan, Mitra and Brandenburg2012), Laurie et al. (Reference Laurie, Boffetta, Falkovich, Kolokolov and Lebedev2014) and Frishman & Herbert (Reference Frishman and Herbert2018). In both cases, the forcing is specified independently of the flow state, a property that makes the problem more amenable to a comprehensive analysis. However, many real fluid flows result from instabilities, for instance of convective, shear or baroclinic type (Chandrasekhar Reference Chandrasekhar1961; Salmon Reference Salmon1980; Vallis Reference Vallis2017), which are explicitly flow-state dependent. Similarly, models of active fluid flows feature scale-dependent viscosities which can be negative at certain scales (Słomka & Dunkel Reference Słomka and Dunkel2017), a fact consistent with the measured rheology of such flows (López et al. Reference López, Gachelin, Douarche, Auradou and Clément2015). Such scale-dependent viscosities also arise in eddy viscosity modelling, where the molecular viscosity  $\nu$ is modified by terms involving small-scale velocities to represent the effect of smaller-scale motions on larger-scale motions. Eddy viscosity, including that with a negative sign, has been studied in a variety of 2-D and 3-D flows (Kraichnan Reference Kraichnan1976; Sivashinsky & Yakhot Reference Sivashinsky and Yakhot1985; Bayly & Yakhot Reference Bayly and Yakhot1986; Yakhot & Sivashinsky Reference Yakhot and Sivashinsky1987; Dubrulle & Frisch Reference Dubrulle and Frisch1991; Gama, Vergassola & Frisch Reference Gama, Vergassola and Frisch1994; Alexakis Reference Alexakis2018). Negative eddy viscosities are also encountered in applications within the context of backscatter parametrisations (Prugger, Rademacher & Yang Reference Prugger, Rademacher and Yang2022, Reference Prugger, Rademacher and Yang2023). Schemes of this type are used in ocean modelling (Jansen & Held Reference Jansen and Held2014; Juricke et al. Reference Juricke, Danilov, Koldunov, Oliver and Sidorenko2020). In addition, negative-viscosity forcing has been considered in a study of axisymmetric turbulence (Qin et al. Reference Qin, Faller, Dubrulle, Naso and Bos2020), while linearly forced isotropic turbulence at moderate Reynolds numbers has been studied by Bos, Laadhari & Agoua (Reference Bos, Laadhari and Agoua2020).
For flows driven by instabilities, the driving explicitly depends on the velocity field and the injection rate of kinetic energy is proportional to the squared velocity amplitude of the forcing-scale modes. Flows resulting from instabilities can differ starkly from flows driven by random stirring. For instance, it is known that the transition to two-dimensional turbulence is non-universal and depends qualitatively on the choice of the forcing function (Linkmann, Hohmann & Eckhardt Reference Linkmann, Hohmann and Eckhardt2020). Moreover, instability-driven turbulence can deviate significantly from Kraichnan's picture of the inverse cascade and condensation. For instance, active flows typically do not display an inverse cascade, but form mesoscale vortices (Wensink et al. Reference Wensink, Dunkel, Heidenreich, Drescher, Goldstein, Löwen and Yeomans2012). Such coherent vortices are observed to form spontaneously in 2-D turbulence driven by a negative eddy viscosity forcing (Gama, Frisch & Scholl Reference Gama, Frisch and Scholl1991) and are often associated with screening (Grooms et al. Reference Grooms, Julien, Weiss and Knobloch2010; Jiménez Reference Jiménez2021). In nearly inviscid, inertial fluid flows, the resulting shielded vortices typically evolve into tripoles (Carton, Flierl & Polvani Reference Carton, Flierl and Polvani1989) consisting of a central vortex and two satellite vortices of opposite sign  $180^\circ$ apart, as seen in both laboratory experiments (Van Heijst, Kloosterziel & Williams Reference Van Heijst, Kloosterziel and Williams1991) and direct numerical simulation (DNS) (Orlandi & van Heijst Reference Orlandi and van Heijst1992). In instability-driven 2-D turbulence, the formation of such tripolar shielded vortices has been found to facilitate the spontaneous suppression of the inverse cascade (van Kan et al. Reference van Kan, Favier, Julien and Knobloch2022).
A particular challenge for flows driven by spectrally localised negative viscosities is that the resulting linear instability may grow without bound despite the presence of an advective nonlinearity. This fact was remarked upon in the context of early direct numerical simulations of 2-D turbulence (Gama et al. Reference Gama, Frisch and Scholl1991; Sukoriansky et al. Reference Sukoriansky, Chekhlov, Orszag, Galperin and Staroselsky1996), and continues to be discussed in the context of geophysical fluid models with backscatter (Prugger et al. Reference Prugger, Rademacher and Yang2022). In the presence of a nonlinear damping term, this unphysical unbounded growth is readily saturated. Different physical considerations may lead to such nonlinear damping terms depending on the application. In the context of active matter, a cubic damping term appears in the classical Toner–Tu model of flocking (Toner & Tu Reference Toner and Tu1998), derived from symmetry considerations and renormalization arguments. The Toner–Tu model, which continues to be the subject of theoretical and numerical investigations (Gibbon et al. Reference Gibbon, Kiran, Padhan and Pandit2023), was later adapted to the study of active fluid flows by the addition of a fourth-order spatial derivative term reminiscent of the Swift–Hohenberg equation (Dunkel et al. Reference Dunkel, Heidenreich, Bär and Goldstein2013a,Reference Dunkel, Heidenreich, Drescher, Wensink, Bär and Goldsteinb). The resulting Toner–Tu–Swift–Hohenberg model describes active stresses in terms of a scale-localised negative viscosity and has been of great interest (James et al. Reference James, Suchla, Dunkel and Wilczek2021; Puggioni et al. Reference Puggioni, Boffetta and Musacchio2022; Kiran et al. Reference Kiran, Gupta, Verma and Pandit2023). A review of recent progress based on these and other models of active turbulence is given by Alert, Casademunt & Joanny (Reference Alert, Casademunt and Joanny2022). In the geophysical context, many studies of nearly two-dimensional turbulence assume a linear Rayleigh drag law to model the effect of bottom friction (Boffetta & Ecke Reference Boffetta and Ecke2012). However, there is also a large body of work which considers a quadratic (turbulent) bottom drag law, see e.g. Jansen et al. (Reference Jansen, Adcroft, Hallberg and Held2015) and Gallet & Ferrari (Reference Gallet and Ferrari2020). Such a quadratic drag law may be obtained from dimensional considerations and is widely used in theoretical and numerical ocean models (Gill Reference Gill1982; Willebrand et al. Reference Willebrand, Barnier, Böning, Dieterich, Killworth, Le Provost, Jia, Molines and New2001; Egbert, Ray & Bills Reference Egbert, Ray and Bills2004; Couto et al. Reference Couto, Alford, MacKinnon and Mickett2020).
Following earlier work of Jiménez & Guegan (Reference Jiménez and Guegan2007), a recent study (van Kan et al. Reference van Kan, Favier, Julien and Knobloch2022) investigated 2-D turbulence driven by a hybrid forcing that interpolates between a spectrally localised negative viscosity forcing and a random driving force acting on the same length scales while injecting energy at a constant rate. This combination of two well-established forcing mechanisms, each of which has separately led to fundamental insights into turbulence, allows for an exploration of new aspects of non-universality in 2-D turbulence. With a cubic nonlinear damping term to saturate the linear instability, extensive DNS by van Kan et al. (Reference van Kan, Favier, Julien and Knobloch2022) revealed a number of transitions as the forcing function varies from stochastic to instability-like, from a large-scale condensate to a hybrid state consisting of large-scale circulation patterns with embedded mesoscale shielded vortices, and finally to a gas of shielded vortices characterised by a spontaneously broken symmetry, with all vorticity extrema in the core of the same sign at late times. Here and in the following, we use the term mesoscale to indicate a scale intermediate between the small forcing scales and the system size. This usage differs somewhat from the established definition in the geophysical literature. For instance, in the context of the Earth's atmosphere, the scales most unstable to baroclinic instability (comparable to the Rossby radius of deformation), are typically of the order of  $1000$ kilometres (the synoptic scale of weather systems), while the atmospheric mesoscales are substantially smaller (tens to hundreds of kilometres). In contrast, the oceanic mesoscale is the analogue of the atmospheric synoptic scale (Cushman-Roisin & Beckers Reference Cushman-Roisin and Beckers2011).
In the shielded vortex gas, the inverse energy cascade was found to be suppressed at large scales, while the number of shielded vortices in the domain slowly increased via a random nucleation process (van Kan et al. Reference van Kan, Favier, Julien and Knobloch2022). Owing to the significant numerical effort required to investigate the ultimate saturation of this process, the late-time limit of this slow evolution was not studied and remains an open problem. Here, we employ extensive DNS of this system with very long integration times to advance significantly beyond the results presented by van Kan et al. (Reference van Kan, Favier, Julien and Knobloch2022) and investigate in detail the late-time evolution of the broken symmetry shielded vortex gas state, revealing an approximately self-similar evolution towards a dense, statistically stationary state. This state is shown to persist over a wide range of forcing strengths, and to undergo a crystallisation transition at a critical parameter threshold.
The remainder of this paper is structured as follows: in § 2, we describe the numerical set-up for our simulations, followed in § 3 by a discussion of the late-time evolution of the shielded vortex gas and the convergence to a statistically stationary state. Next, in § 4, we describe the crystallisation transition observed at weak instability growth rates and quantify it using tools from statistical physics and crystallography. In § 5, we describe the dependence of the vorticity profile of the shielded vortices and the number of such vortices on the forcing parameters. In § 6, we discuss the conditions required to suppress the expected inverse cascade, thereby leading to the vortex crystal state, while in § 7, we provide an overview of the state space including all stable stationary solutions we have identified in the system. The paper concludes in § 8 with a discussion of our results in the context of existing and future research on instability-driven turbulence.
2. Set-up
We study the 2-D Navier–Stokes equation governing the evolution of an incompressible velocity field  $\boldsymbol {u}=(u,v)$ on the flat torus
 $[0,2{\rm \pi} ]^2$ with nonlinear damping, hyperviscosity and a hybrid forcing function
 $\boldsymbol {f}_{\!\gamma}$, namely
 \begin{gather} \partial_t \boldsymbol{u} + \boldsymbol{u} \boldsymbol{\cdot}\boldsymbol{\nabla} \boldsymbol{u} ={-} \boldsymbol{\nabla} p - \nu_n (-\nabla^2)^n\boldsymbol{u} - \beta |\boldsymbol{u}|^m \boldsymbol{u} + \boldsymbol {f}_{\!\gamma}, \end{gather}
 \begin{gather}\boldsymbol{\nabla}\boldsymbol{\cdot} \boldsymbol{u} = 0 , \end{gather}
where the integers  $n$ and
 $m$ control the order of the hyperdiffusion and damping operators, respectively, with
 $n,m\geq 1$, and
 \begin{equation} \boldsymbol {f}_{\!\gamma}= \gamma \mathcal{L} [\boldsymbol{u}] + (1-\gamma)\boldsymbol{f}_{\!\epsilon}.\end{equation}
Here, the forcing control parameter  $\gamma \in [0,1]$, and
 $\mathcal {L}[\boldsymbol {u}]$ is a linear operator whose Fourier transform is given by
 \begin{equation} \widehat{\mathcal{L}[\boldsymbol{u}]}(\boldsymbol{k}) = \nu_* k^2 \hat{\boldsymbol{u}}(\boldsymbol{k}),\quad \nu_*>0, \end{equation}
for wavenumbers  $\boldsymbol {k}$ in the annulus
 $k=|\boldsymbol {k}| \in [k_1,k_2]$, and
 $\widehat {\mathcal {L}[\boldsymbol {u}] }(\boldsymbol {k})=0$ otherwise. We denote the largest length scale in the forcing range by
 $\ell _1\equiv 2{\rm \pi} /k_1$. This linear forcing term is associated with a maximum growth rate
 $\sigma \equiv \nu _* k_2^2$. An important non-dimensional number characterising this system is the ratio
 \begin{equation} r(\gamma) = \frac{\gamma\sigma}{\nu_n k_2^{2n}} \end{equation}
between the maximum instability growth rate, which occurs at the wavenumber  $k=k_2$, and the rate of hyperviscous energy dissipation rate at that wavenumber. We choose
 $\nu _*$ such that
 $r(\gamma )$ varies from
 $r(0)=0$ to
 $r\gg 1$ as
 $\gamma$ increases from
 $0$ to
 $1$ (in all the runs described below, we take
 $\nu _*=0.002$,
 $k_2=40$,
 $n=4$,
 $\nu _4=10^{-14}$, such that
 $r(\gamma =1) \approx 48.8$, see table 1 for details of the parameters used). We note that the ratio
 $r$ has also been identified as a key control parameter in models of active turbulence (Linkmann et al. Reference Linkmann, Boffetta, Marchetti and Eckhardt2019, Reference Linkmann, Marchetti, Boffetta and Eckhardt2020), where the case
 $n=1$ (regular viscosity) was considered. The second term in (2.3) involves the solenoidal zero-mean white-in-time stochastic force
 $\boldsymbol{f}_{\!\epsilon} (\boldsymbol {x},t)$ with random phases acting within a thin shell of wavenumbers centred on the most linearly unstable wavenumber
 $k=k_2$, injecting kinetic energy at a rate
 $\epsilon$.
Summary of the runs performed in this study. All runs were done at a moderate resolution,  $n_x=n_y=512$, to facilitate long-time integration. The parameters for the standard set-up read
 $\nu _* = 0.002$,
 $k_1=33$,
 $k_2=40$,
 $\epsilon =1$,
 $\beta =10^{-4}$,
 $n=4$,
 $\nu _4 = 10^{-14}$. Runs in set A are initialised from small-amplitude, random initial conditions, while runs in set B are initialised in the vortex gas state obtained in set A or vortex crystal states obtained from that by continuation in
 $\gamma$. In set C, the cubic damping term is replaced by a quadratic term
 $\beta |\boldsymbol {u}|\boldsymbol {u}$ with
 $\beta =0.1$, all other parameters remaining the same. In set D, the cubic damping is spectrally filtered to systematically assess its importance for the maintenance of the vortex crystal. The runs in set E are identical to runs in set A, but with the random forcing set to zero. Set F similarly repeats runs from set B with the random forcing term set to zero. Reynolds numbers given refer to the stationary state (except for set
 $F$) and indicate the range observed within each set.

We record the domain-averaged kinetic energy (density)  $E\equiv \langle \boldsymbol {u}^2\rangle$ and the enstrophy (density)
 $\varOmega \equiv \langle \omega ^2 \rangle$, where
 $\langle {\cdot } \rangle$ denotes the domain average, as well as the vorticity
 $\omega \equiv \partial _x v - \partial _y u$. A further important quantity used to characterise the structure of fluid flows is the energy spectrum
 $E(k)$, defined by
 \begin{equation} E(k) = \sum_{\boldsymbol{q}: k-1/2\leq |\boldsymbol{q}|< k+1/2} |\hat{\boldsymbol{u}}(\boldsymbol{q})|^2, \end{equation}
which characterises the distribution of energy across scales in terms of the Fourier transform of the velocity field  $\hat {\boldsymbol {u}}(\boldsymbol {q})$. The system defined above is further characterised by two dissipation-related non-dimensional parameters
 \begin{equation} Re_n = U_{rms}L_I^{2n-1}/\nu_n,\quad Re_{\beta,m} = \frac{1}{\beta (U_{\mathrm{rms}})^{m-1} L_I}, \end{equation}
with the r.m.s. velocity  $U_{\mathrm {rms}}=\sqrt {\langle \boldsymbol {u}^2\rangle }$ and the integral length scale
 $L_I$, defined spectrally as
 $L_I = \sum _{k} ({2{\rm \pi} }/{k}) E(k)/E$. Note that the Reynolds numbers thus defined can only be evaluated a posteriori. In addition, the problem depends on the a priori parameter
 $\gamma$, which controls the relative amplitude of the random and deterministic forcing terms. An alternative non-dimensional but a posteriori parameter
 $\varGamma$ can be defined by the ratio of the energy injection rates
 $\gamma \sigma U_{\mathrm {rms}}^2$ and
 $(1-\gamma )^{2}\epsilon$ associated with the deterministic and stochastic forces, respectively:
 \begin{equation} {\varGamma} = \frac{\gamma\sigma U_{\mathrm{rms}}^2}{(1-\gamma)^{2}\epsilon}. \end{equation}
When this parameter is large, the instability forcing provides the dominant contribution to the energy injection.
Equations (2.1)–(2.3) were solved using the MPI-parallelised, pseudospectral code GHOST (Geophysical High-Order Suite for Turbulence), cf. Mininni et al. (Reference Mininni, Rosenberg, Reddy and Pouquet2011). The 2/3 rule was used for dealiasing. We ensure that all simulations are well resolved by checking that the enstrophy dissipation rate  $D_\varOmega (k) = \nu _n k^{2n+2}E(k)$ decays towards the grid scale. A total of
 $144$ distinct simulations were performed, requiring approximately 1 million CPU hours in total. The runs are organised in six sets as described in table 1. Cubic damping (
 $m=2$) is considered in all runs except those in set C, which is shown in Appendix A to yield states that are qualitatively similar to those discussed here with quadratic damping (
 $m=1$). All runs were done at a moderate resolution
 $n_x=n_y=512$ to facilitate the long-time integration required to observe the phenomena of interest here. The longest runs performed for this work (in set B) lasted approximately
 $40\,000$ time units measured in terms of the time scale
 $\sigma ^{-1}$ associated with the linear instability growth rate, corresponding to a walltime of approximately 90 days. In sets E and F, the random forcing amplitude is set to zero to isolate the impact of the random force on the observed solutions.
3. Late-time evolution near  $\gamma =1$

As stated in § 1, the shielded vortex gas state described by van Kan et al. (Reference van Kan, Favier, Julien and Knobloch2022) was only followed into a dilute but transient state in which the number of vortices slowly grew owing to random vortex nucleation. In this section, we use much increased computational resources to study the long-time evolution of the system, based on runs from set A, as it converges to a statistically stationary state. Figure 1 shows snapshots of the vortex gas in the pure instability-driven case ( $\gamma =1$) at different times, non-dimensionalised by the instability growth rate
 $\sigma$. Starting from random, small-amplitude initial conditions, a short-lived inverse cascade is followed by the emergence of shielded vortices of both parities (
 $\sigma t = 6.3$ in figure 1). In a stochastic competition between the two species, one is eventually eliminated leading to spontaneous symmetry breaking, as discussed by van Kan et al. (Reference van Kan, Favier, Julien and Knobloch2022). This is clearly seen at
 $\sigma t=378$ in figure 1. As time increases further, the number of vortices increases. The last snapshot, at
 $\sigma t=9312$, corresponds to the statistically stationary state. Upon inspection of figure 1, the coherent vortices are seen to be tripolar, with an elliptical core and two satellites
 $180^\circ$ apart. As shown by van Kan et al. (Reference van Kan, Favier, Julien and Knobloch2022), these tripolar vortices are shielded, meaning that the circulation generated by any given vortex becomes small beyond a finite radius, located close to the edge of its satellites and comparable to the largest forcing scale.
Visualisation of the vorticity field at different times for  $\gamma =1$, showing the evolution from small-amplitude, random initial conditions through a dilute to a dense vortex gas.

The corresponding time evolution of the enstrophy (defined in § 2) is shown in figure 2(a). This quantity is closely related to the number of vortices in this system, as shown by van Kan et al. (Reference van Kan, Favier, Julien and Knobloch2022). Four distinct phases can be identified: an initial, rapid increase of the enstrophy from small-amplitude initial conditions, associated with a short-lived inverse cascade, followed by a phase of slower, approximately linear, growth of enstrophy with time. The latter corresponds to random nucleation of new vortices in the background turbulence, depicted in figure 1. When the enstrophy reaches around  $\varOmega /\sigma ^2\approx 2.5\times 10^4$ (corresponding to approximately 140 vortices in a domain of area
 $(2{\rm \pi} )^2$), a phase of explosive growth sets in, where the number density of vortices increases rapidly. Finally, a statistically stationary state is reached whose enstrophy is larger by a factor of approximately
 $2.5$ than the enstrophy threshold at which the rapid growth sets in. It should be emphasised that the observed increase in enstrophy is due to an increasing number of vortices since the core of any given vortex remains at constant vorticity due to a local balance between forcing and nonlinear damping. A similar transient evolution towards a vortex crystal in the Toner–Tu–Swift–Hohenberg model of active fluids is described by James, Bos & Wilczek (Reference James, Bos and Wilczek2018). However, in this system, the enstrophy of the final state is much smaller as a consequence of stronger nonlinear damping relative to the linear forcing strength and the time scale separation between the slow nucleation and the rapid explosive growth is therefore much less pronounced.
(a) Time evolution of the enstrophy from small-amplitude random initial conditions when  $\gamma =1$ (case A). (b) Colour-coded log-log plots of the energy spectrum versus wavenumber at the times indicated by dashed vertical lines in panel (a). The shaded envelopes indicate one standard deviation of the spectrum about the mean, computed over 50 snapshots. The grey shaded region indicates the forcing range.

Figure 2(b) shows a log-log plot of the energy spectrum  $E(k)$ versus the wavenumber
 $k$ at the times highlighted in panel (a) by vertical dashed lines. The spectrum shown is averaged over 50 consecutive snapshots, with the shaded envelope indicating one standard deviation around the mean. At the earliest time illustrated,
 $\sigma t =378$, the energy spectrum has a local maximum at the largest scale, a remnant of the short-lived early-time inverse cascade. As time passes, the kinetic energy in the large scales continuously decreases and a sharp local maximum appears at an intermediate scale, approximately twice the forcing scale, and corresponding to the scale of the individual vortices.
Figure 3(a) shows the non-dimensional enstrophy (compensated by  $\gamma$) versus the non-dimensional time
 $\sigma t$ for
 $\gamma =0.8$, 0.85, 0.9, 0.95, and 1. In addition to the run at
 $\gamma =1$ already shown in figure 2, we generated an ensemble of
 $10$ runs which differed only in the phases of their random, small-amplitude initial conditions. Similarly, at
 $\gamma =0.95$, we performed
 $10$ additional runs which also differed in the phases of their random, small-amplitude initial conditions and in the realisation of the stochastic forcing (by construction, no stochastic forcing is present at
 $\gamma =1$). Several things can be gleaned from figure 3(a). First, the explosive nucleation of new vortices seen in figure 2(a) is triggered when the enstrophy reaches
 $\varOmega \sim 0.4\varOmega _{max}$, in terms of the enstrophy
 $\varOmega _{max}$ attained in the stationary state, regardless of the value of
 $\gamma$ (horizontal dashed line in figure 3a). In fact, random vortex nucleation was observed for
 $\gamma \gtrsim 0.6$ (van Kan et al. Reference van Kan, Favier, Julien and Knobloch2022), but the late-time dynamics for
 $0.6<\gamma <0.8$ remained numerically inaccessible owing to the excessively long simulation time required to reach the final statistically stationary state at these parameter values. Second, the enstrophy in the statistically stationary state scales linearly with
 $\gamma$ to a good approximation between
 $\gamma =0.8$ and
 $\gamma =1$. This is consistent with a dominant balance between the instability forcing term, which is linear in the velocity, and the cubic damping term in (2.1). In contrast, the time scale
 $t_{exp}$ required for the system to reach the explosive phase exhibits a non-trivial, sensitive dependence on
 $\gamma$ whose origin remains unclear. For the parameters considered here, the threshold configuration (shown in figure 1 at
 $\sigma t=5980$) contains approximately
 $140$ vortices in a domain of area
 $(2{\rm \pi} )^2$, see also figure 13. We note that the mean distance
 $d_{NN}$ between the vortex centres of nearest neighbours (computed by finding the nearest neighbour of any given vortex, and averaging over the population and over time) close to this threshold is approximately
 $d_{NN}\approx 2\ell _1$, which is somewhat larger than the integral scale (defined in § 1), which is given by
 $L_I\approx 1.4\ell _1$ (with
 $\ell _1=2{\rm \pi} /k_1$).
(a) Nearly self-similar evolution of the enstrophy from small-amplitude random initial conditions to the dense vortex gas. The final enstrophy value in the stationary state scales approximately linearly with  $\gamma$, while the time scale depends on
 $\gamma$ highly nonlinearly. Low-opacity curves at
 $\gamma =1$ and
 $\gamma =0.95$ indicate an ensemble of ten runs performed at each of these values. The horizontal dashed line indicates the enstrophy threshold for the onset of the rapid growth phase. (b) Zoom on early times highlighting the stochastic nature of the evolution and the deviations between different ensemble members. (c) Non-dimensional time
 $\sigma t_{exp}$ at which the explosive growth phase begins versus
 $\gamma$. An empirical power law with an exponent between
 $-7$ and
 $-8$ is observed. Inset shows non-dimensional duration
 $\sigma t_{growth}$ of the explosive growth phase versus
 $\gamma$, where
 $t_{growth}$ is defined as the difference between
 $t_{exp}$ and the time required for the enstrophy to reach
 $90\,\%$ of its maximum value at a given
 $\gamma$. The results show a significantly weaker dependence of
 $t_{growth}$ on
 $\gamma$ compared to
 $t_{exp}$. (d) Near self-similarity is verified by replotting the data from panel (a) against a time rescaled by
 $t_{exp}$, with colours being consistent between the two panels. Since
 $t_{exp}$ increases with
 $\gamma$ significantly faster than
 $t_{growth}$, the rapid growth phase appears to sharpen as
 $\gamma$ decreases under this rescaling.

Figure 3(b) shows a zoom on the early phase of the evolution, highlighting the stochasticity of the nucleation process. Figure 3(c) shows the time  $t_{exp}$ required to reach
 $40\,\%$ of the statistically stationary state enstrophy, where the phase of explosive growth is triggered, for all the simulations shown in panel (a), with the dashed line indicating a power-law fit giving an empirical exponent approximately equal to
 $-7.6$. To date, no theoretical argument for such a power-law dependence has been identified. The inset in panel (c) shows the duration
 $t_{growth}$ of the explosive growth phase as a function of
 $\gamma$ for the same runs. This time depends on
 $\gamma$ less strongly than
 $t_{exp}$, with a power-law fit with an approximate exponent of
 $-2.2$ although the data show a significant spread within ensembles. Figure 3(d) shows the same data as panel (a) but with time rescaled by
 $t_{exp}$, confirming the near self-similarity of the nucleation process. Since the duration
 $t_{growth}$ of the explosive growth phase is not proportional to
 $t_{exp}$, the collapse during the latter phase is imperfect. Moreover, the scaling of the stationary-state enstrophy with
 $\gamma$ is seen to be satisfied only approximately.
The increasingly slow nucleation of new shielded vortices as  $\gamma$ decreases is a reflection of time scale competition. As
 $\gamma$ decreases, the time scale for the generation of a new vortex by the linear instability increases. The background turbulence, taking place in the interstitial space between the vortices already present, generates shear which disrupts the formation of new vortices and hence it may be expected that vortex nucleation slows down as
 $\gamma$ decreases. For different values of
 $\gamma$, we measured the average strain rate
 $\|\boldsymbol {D}\| \equiv \sqrt {\mathrm {tr}(\boldsymbol {D} \boldsymbol {D}^{\rm T})}$, where
 $\boldsymbol {D} \equiv \frac {1}{2}(\boldsymbol {\nabla } \boldsymbol {u} + (\boldsymbol {\nabla } \boldsymbol {u})^{\rm T})$ is the rate of strain tensor, and the average mean-square vorticity of the turbulence in the interstitial space of the dilute vortex gas (not shown). We found that both of these quantities are much larger than the maximum instability growth rate, indicating that nucleation of new shielded vortices from this turbulent background is indeed a rare event. In principle, one may hope to deduce the dependence of
 $t_{exp}$ on
 $\gamma$ from these considerations. However, the fact that the interstitial turbulence is no longer homogeneous owing to the embedded coherent, shielded vortices complicates the picture.
As illustrated by figure 4(a), there is a tendency for large-amplitude vorticity fluctuations to occur in the vicinity of coherent vortices. This is likely a manifestation of the coherent vortices imparting vorticity to their vicinity through filamentation or diffusion. Therefore, during the random nucleation process, as the coherent vortices increase in number, and the interstitial space is reduced, the amplitude of vorticity fluctuations in the interstices increases. This is confirmed by the time evolution of the mean-squared interstitial vorticity, shown in figure 4(b). The mean-squared vorticity in the interstices is indeed seen to increase over time during the random nucleation process. At the threshold of around two-fifths of the final enstrophy, a value that appears to be universal across  $\gamma$, the interstices are sufficiently reduced in size that high-amplitude vorticity fluctuations can rapidly develop, serving as seeds for new shielded vortices, allowing rapid nucleation of the remaining three-fifths of the final number of vortices (note that only vortices of the same sign can mature in the vortex gas past the initial stage of spontaneous symmetry breaking, since vortices of the opposite sign undergo destructive interactions as discussed by van Kan et al. Reference van Kan, Favier, Julien and Knobloch2022). This type of explosive nucleation resembles behaviour observed in systems undergoing crowd synchronisation via quorum sensing when a large number of dynamical elements communicate with each other via a common information pool (Strogatz et al. Reference Strogatz, Abrams, McRobie, Eckhardt and Ott2005; Zamora-Munta et al. Reference Zamora-Munta, Masoller, Garcia-Ojalvo and Roy2010), here the interstitial vorticity. Although the initial spontaneous symmetry breaking occurs rapidly compared with the slow nucleation process in the runs discussed here, at smaller values of
 $\gamma$, there can be significant transients during which vortices of both signs coexist in the domain (van Kan et al. Reference van Kan, Favier, Julien and Knobloch2022). This is compatible with the findings of James et al. (Reference James, Suchla, Dunkel and Wilczek2021) in active turbulence at moderate Reynolds numbers, who report similar transients with subdomains of locally aligned vortices, whose duration grows with the size of the domain. In the present work, we focus instead on the behaviour at substantially larger Reynolds numbers in a large domain of a fixed size, leaving the domain size dependence to future work.
(a) Snapshot of the vorticity field at  $\gamma =1$ during the random nucleation process, highlighting the interstitial vorticity field by filtering out regions where the strain amplitude
 $\|\boldsymbol {D}\|$ (defined in the main text) is larger than
 $5\,\%$ of its maximum value (we have also tested other threshold values and found qualitatively the same results). High-amplitude vorticity fluctuations are preferentially found in the vicinity of shielded vortices. (b) Time series of the mean squared vorticity at
 $\gamma =1$, averaged over the interstitial space between the coherent vortices, computed from the vorticity field shown in panel (a). The mean squared interstitial vorticity increases in time in a manner reminiscent of the full enstrophy shown in figure 3, with the observed interstitial values significantly smaller than the total enstrophy that is dominated by the coherent vortices. The growth in interstitial vorticity indicates that within the shrinking gaps between the coherent vortices, vorticity fluctuations increase in strength over time.

As  $\gamma$ changes, the relative importance of the two terms in the forcing function also changes. To determine which term is responsible for setting the observed increasingly long time scales of the approach to the stationary state, we compare two ensembles of runs at
 $\gamma =0.95$ from sets A and E defined by the presence or absence of the random forcing term (cf. § 2). The late-time evolution of enstrophy in these two ensembles is shown in figure 5. The deviation between the average
 $t_{exp}$ in the two ensembles is not statistically significant compared with the standard deviation. In addition to the simulations at
 $\gamma =0.95$, we have also performed a run without random forcing at
 $\gamma =0.8$ (not shown), and found that in this case, the evolution of the enstrophy with and without the stochastic forcing is also nearly identical. These findings indicate that, at least for
 $\gamma$ close to unity, the stochastic forcing plays only a minor role in setting the transition to the dense state. This is consistent with the observation that the ratio
 $\varGamma$ (defined in (2.8)) between the energy injection rate associated with the instability forcing term and the random force is much greater than one. Specifically, we find that, in the stationary state,
 $\varGamma (\gamma =0.8)\approx 4.4\times 10^4 \gg 1$.
Time series of enstrophy from two ensembles of runs at  $\gamma =0.95$. In the first ensemble, shown by the green curves, the random forcing is switched on with
 $\epsilon =1$ (same data as in figure 3), while in the second ensemble, shown by the brown curves, the random forcing amplitude is set to zero,
 $\epsilon =0$. The difference between the average of
 $t_{exp}$ over each of the two ensembles is not statistically significant compared with the standard deviation.

4. Crystallisation transition at small $\gamma$

The dense vortex gas states found near  $\gamma = 1$, whose emergence was described in the previous section, can be continued to smaller values of
 $\gamma$, where the observed states become much more regular. This behaviour may appear unexpected, given that reducing
 $\gamma$ implies stronger stochastic forcing relative to instability forcing. However, for all the results described below, the instability forcing term remains dominant in the sense that the ratio
 $\varGamma$ remains large. The dependence of the late-time flow state on
 $\gamma$ is illustrated in figure 6, where snapshots of the vorticity field are shown for runs in set B at
 $\gamma =1$,
 $\gamma =0.5$ and
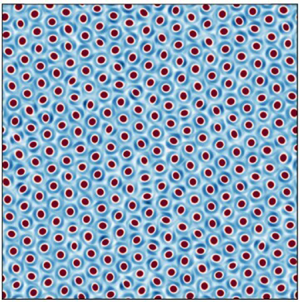
 $\gamma =0.05$. In the latter case, a spontaneously formed hexagonal vortex crystal is observed. For identical point vortices, this is the only stable vortex lattice in a periodic domain (Tkachenko Reference Tkachenko1966). In all three panels, the vortices are of one sign only, i.e. all three panels represent symmetry-broken chiral states. However, for every state shown in figure 6, there exists a corresponding state with the sign of the vorticity reversed. The vortex state shown in figure 6(a,b) at high Reynolds numbers differs substantially from the disorganised, active turbulence state described by James et al. (Reference James, Suchla, Dunkel and Wilczek2021) for moderate Reynolds numbers, since we observe only vortices of a single sign, all with a pronounced tripolar structure and therefore shielded. The vortex crystal shown in figure 6(c) bears some resemblance to the active vortex lattice of James et al. (Reference James, Suchla, Dunkel and Wilczek2021), although in the latter, vortices are not tripolar, but rather embedded in a background of uniform but opposite vorticity.
Snapshots of the vorticity field in the dense, statistically stationary state at: (a)  $\gamma = 1$; (b)
 $\gamma =0.5$ and (c)
 $\gamma =0.05$.

In the following, the transition from the disordered vortex gas to the crystal is analysed quantitatively using different methods from statistical physics and crystallography.
4.1. Vortex diffusion
Supplementary movies SM1, SM2, SM3 available at https://doi.org/10.1017/jfm.2024.162 show the evolution of the vorticity field over time for  $\gamma =0.5,0.25$ and
 $0.05$. As
 $\gamma$ is reduced, the root-mean-square speed at which individual vortices traverse the domain decreases significantly. In particular, one observes that the individual vortices in the gas phase move chaotically across the domain but are trapped in the crystalline state. Therefore, the speed at which individual vortices propagate through the domain is a natural order parameter for quantifying the transition to the crystalline state. A particle-image-velocimetry (PIV) algorithm (Adrian & Westerweel Reference Adrian and Westerweel2011) is suitable for this purpose.
We have implemented such an algorithm in Python and applied it to the dense vortex states, taking into account the complicating feature of the periodic boundaries, which can lead to spurious doppelgängers that must be eliminated to obtain the correct trajectories. This procedure yields trajectories such as those shown in figure 7, where each colour represents the trajectory of a single vortex in the system, shifted to start at the origin and extending from  $t=0$ to
 $\sigma t = 300$. At
 $\gamma =0.5$ and
 $\gamma =0.25$ (figure 7a,b), the vortices diffuse with a mean squared displacement that increases with
 $\gamma$. By contrast, at
 $\gamma =0.05$ (figure 7c), i.e. in the crystalline state, the vortices remain trapped close to the origin.
Trajectories of all individual vortices in the system from  $t=0$ to
 $\sigma t = 300$, shifted to start at the origin, for (a)
 $\gamma =0.5$; (b)
 $\gamma =0.25$ and (c)
 $\gamma =0.05$. Each colour indicates the trajectory of a particular vortex. The vortices diffuse above the melting transition (
 $\gamma \geq \gamma_c\approx 0.13$) at a rate that increases with
 $\gamma$, but are trapped at
 $\gamma = 0.05$ (crystalline state).

To quantify this impression, we compute the mean squared displacement, a classical measure in the study of diffusion processes, over the vortex population as a function of time. Regular diffusion, which can be microscopically realised by Brownian motion, is characterised by a linear increase of the mean squared displacement with time (Einstein Reference Einstein1905). The forced-dissipative system we are considering here is out of equilibrium, even if only weakly so, owing to the absence of an inverse energy cascade. Random motions observed in out-of-equilibrium systems are often characterised by anomalous diffusion (Metzler & Klafter Reference Metzler and Klafter2000; Sokolov & Klafter Reference Sokolov and Klafter2005), defined by a nonlinear scaling of the mean squared displacement with time.
Against this backdrop, the results shown in figure 8(a) can be considered surprising: the complex mutual advection of individual vortices leads to a mean squared displacement that increases approximately linearly with time, i.e. the vortices perform regular diffusion. The (non-dimensional) slope  $D_v$ of the mean squared displacement over time is shown in panel (b) as a function of the forcing parameter
 $\gamma$. Below a critical threshold,
 $\gamma =\gamma _c\approx 0.13$, individual vortices are trapped in the vortex crystal. Above this threshold, the diffusivity increases monotonically with
 $\gamma$. The dashed line indicates a quadratic fit near the onset of diffusion, which is accurate from
 $\gamma =\gamma _c\approx 0.13$ to
 $\gamma \approx 0.25$. The transition is seen to be continuous (or supercritical). Figure 8(c) shows the same data as panel (b), but as a function of
 $\varGamma$, defined in (2.8). The crystallisation transition occurs at
 $\varGamma =\varGamma _c\approx 90$ with a critical exponent close to one. Similar behaviour is found in other systems exhibiting hexagonal symmetry (Ammelt, Astrov & Purwins Reference Ammelt, Astrov and Purwins1998; Bortolozzo, Clerc & Residori Reference Bortolozzo, Clerc and Residori2009; Ophaus et al. Reference Ophaus, Knobloch, Gurevich and Thiele2021) but appears unrelated to any of the classical instabilities of a hexagonal pattern such as Eckhaus, zigzag or varicose instabilities (Sushchik & Tsimring Reference Sushchik and Tsimring1994; Echebarria & Riecke Reference Echebarria and Riecke2000). In the following, we refer to the transition from trapped to diffusive vortex motion observed at
 $\gamma =\gamma _c$ interchangeably as a crystallisation transition or a melting transition. The observation that the melting transition discussed here is continuous is particularly interesting in view of the large literature on the search for similar continuous melting transitions in particle systems at equilibrium (Dash Reference Dash1999).
(a) Mean squared displacement of vortices at different  $\gamma$ versus time. The observed increase is approximately linear. (b) Blue circles represent the slope
 $D_v$ measured from the observed mean squared displacements versus
 $\gamma$. Error bars indicate uncertainty in slope estimation. A clear threshold for crystallisation can be discerned at
 $\gamma =\gamma _c\approx 0.13$. Black dashed line shows a quadratic fit in
 $\gamma -\gamma _c$ which is consistent with the data near onset. Inset shows a log-log plot of
 $D_v$ versus
 $\gamma -\gamma _c$, validating the approximate agreement between the data and the quadratic fit. (c) Same data as in panel (b), shown as a function of the ratio
 $\varGamma$ (defined in (2.8)) of energy injection rates due to instability and random forcing. The slope
 $D_v$ scales approximately linearly with
 $\varGamma -\varGamma _c$, where
 $\varGamma _c\approx 90$.

In Appendix C, the location of this transition is shown to be insensitive to the width of the wavenumber band on which the random forcing acts. It is further highlighted there that in the absence of the random forcing ( $\epsilon =0$), the vortex crystal develops defects which lead to residual diffusion that makes the sharp transition of figure 8 imperfect. Thus, the role of the noise associated with the stochastic forcing term in this system is once again counterintuitive, although it is well known that in simpler situations, noise can indeed promote synchronisation, both in chaotic systems (Zhou & Kurths Reference Zhou and Kurths2002) and in systems of non-identical units including phase-coupled oscillators (Nagai & Kori Reference Nagai and Kori2010).
4.2. Radial distribution functions
Another well-established measure of structured particle systems in statistical physics is the radial distribution function, usually denoted by  $g(r)$ (Chandler Reference Chandler1987). This quantity, also referred to as the pair correlation function or pair distribution function, measures the average density of particles near some location
 $\boldsymbol {r}$ with
 $|\boldsymbol {r}|=r$, given that a tagged particle is located at the origin. An equivalent definition of
 $g(r)$ is as the probability density of the quantity
 $N(r)/r$, where
 $N(r)$ is the number of vortices found within a radius
 $[r,r+dr]$ of a given vortex. The radial distribution function allows one to quantify the state of matter in particle systems and has been used to characterise active vortex crystal states (Riedel et al. Reference Riedel, Kruse and Howard2005).
Figure 9 shows the radial distribution function observed in our system in the crystalline state and above the melting transition. In panel (a), corresponding to the crystalline state at  $\gamma =0.05$, there are pronounced peaks near
 $r\approx 2\ell _1$ (nearest neighbour distance),
 $r\approx 2\sqrt {3}\ell _1$ (next nearest neighbour),
 $r\approx 4\ell _1$ (next next nearest neighbour) and this structure continues to larger radii, modulo increasing fluctuations. Figure 9(b) shows that a liquid-like structure is observed beyond the melting transition, with a clear peak near the minimum distance between vortex centres, associated with the finite size of the vortices, and successive peaks at larger radii indicating different coordination shells (Chandler Reference Chandler1987). A zoom on the first peak highlights that it decreases in radius as
 $\gamma$ increases, in agreement with direct measurement of the average vorticity profile, as shown in figure 12 below. At large separations,
 $g(r)$ becomes constant, reflecting the random arrangement of vortices in the vortex gas, which might also be called a vortex liquid in view of this result. Indeed, it is known that a dense system of vortices can be treated as a fluid and can itself be described in terms of anomalous hydrodynamics (Wiegmann & Abanov Reference Wiegmann and Abanov2014), although these authors only consider point vortex flows and do not include the effects of shielding or of the finite size of individual vortices.
Radial distribution function  $g(r)$ for different values of
 $\gamma$ in the vortex crystal state at (a)
 $\gamma =0.05$ and (b) for values of
 $\gamma$ above the melting transition. In the crystalline state, there are pronounced peaks in
 $g(r)$ at nearest-neighbour, next-nearest-neighbour and next-next-nearest-neighbour distances (indicated by NN, NNN, NNNN, respectively). In panel (b), a liquid-like structure is observed beyond the melting transition. The inset shows a zoom on the first peak, which is seen to shift to smaller radii as
 $\gamma$ increases, reflecting shrinking vortex size.

The regularity or irregularity of dense vortex configurations in different phases can also be measured using Voronoi diagrams, as described in Appendix B. One result of this analysis is that the inter-vortex distance decreases as  $\gamma$ increases. However, the Voronoi analysis is based purely on the location of vortex centres and does not include information about the vorticity structure or the vortex size. This analysis thus cannot distinguish between larger gaps between vortices and a change in the vortex size.
4.3. Lindemann ratio
Further insight into the physics of the melting transition of the vortex lattice can be gained by considering the relative displacements of vortices. This can be quantified using an established criterion in terms of the non-dimensional Lindemann ratio (Goldman et al. Reference Goldman, Shattuck, Moon, Swift and Swinney2003), given by
 \begin{equation} r_L = \frac{\langle |u_m-u_n|^2\rangle}{a^2}, \end{equation}
in terms of the lattice spacing  $a$, where
 $u_m$ is the displacement of vortex
 $m$ from the perfect lattice and the average is over nearest-neighbour vortex pairs indexed by
 $m,n$. In simulations of 2-D crystalline atomic lattices at thermal equilibrium, melting has been found to occur when
 $r_L\approx 0.1$ (Bedanov, Gadiyak & Lozovik Reference Bedanov, Gadiyak and Lozovik1985; Zheng & Earnshaw Reference Zheng and Earnshaw1998) and this criterion has been shown to apply also to non-equilibrium systems (Goldman et al. Reference Goldman, Shattuck, Moon, Swift and Swinney2003). We computed
 $r_L$ in the vortex crystal phase at the closest available data point to the melting threshold (
 $\gamma =0.125$), approximating
 $|u_m-u_n|$ by
 $|a-|\boldsymbol {r}_m-\boldsymbol {r}_n||$ in terms of the actual vortex positions
 $\boldsymbol {r}_m$,
 $\boldsymbol {r}_n$, to find that
 $r_L\lesssim 0.002$. This indicates that the displacements of vortices from their lattice sites are small compared with the lattice spacing, even near the onset of melting. This is related to the fact that the lattice spacing in the vortex crystal is nearly identical to the size of individual vortices, implying that displacements of vortices from lattice sites are strongly constrained. The small Lindemann ratio near the onset of melting clearly distinguishes the present non-equilibrium system from the equilibrium examples cited above.
5. Vorticity profile and vortex numbers
The accurate characterisation of the average vorticity profile of tripolar vortices poses a challenge, as one can see in supplementary movie SM4: individual tripolar vortices, which feature varying degrees of ellipticity, rotate rapidly about their centre. We identify the tripole axis of every vortex in two steps. First, we find the location of the vortex centre (position of central extremum). Note that the vortex positions are determined on a grid, implying a spatial resolution of  ${\rm \Delta} x = 2{\rm \pi} /512 \approx 0.06\ell _1$. Second, we find an extremum of opposite sign in the shield. Then a straight line is drawn through these two points to determine the tripole axis. A graphical validation of the results obtained by this method is shown in figure 10 for the vortex crystal state. The golden stars shown there indicate the vortex centres, with light red lines indicating the identified tripole axes. Individual vortices in the vortex lattice are found to rotate as approximately rigid bodies. We searched for signs of orientational order, such as local or global phase synchronization among neighbouring shielded vortices, but no such effects were detected either in the vortex crystal state or in the vortex gas phase.
Graphical validation of identified tripole axes in the shielded vortex crystal  $(\gamma =0.05)$. Golden stars indicate identified vortex centres while light red lines show the instantaneous tripole axes computed based on the location of the maximum vorticity amplitude in the shield. No polar order is discerned.

To perform a population average, we rotate individual vortices (a linear interpolation is required for this step due to the Cartesian grid) so that their vortex axes are aligned in the  $y$ direction and shift all vortices to the origin. The resulting profiles for
 $\gamma =0.05$ and
 $\gamma =0.5$ are shown in figure 11. Three main features can be readily observed: first, increased vorticity amplitude at
 $\gamma =0.5$ leads to a sharper contrast between the vortex and the background than at
 $\gamma =0.05$. Second, the vortex core is notably less elliptical in the crystal at
 $\gamma =0.05$ than at
 $\gamma =0.5$. Finally, the vortex size is significantly larger at
 $\gamma =0.05$ (i.e. in the hexagonal vortex crystal) than at
 $\gamma =0.5$ (the vortex gas).
Population-averaged vorticity profiles at (a)  $\gamma =0.05$ and (b)
 $\gamma =0.5$ in the crystal and gas phases. The vortex size decreases and the core becomes more elliptical as
 $\gamma$ increases. Note the different colour bars required to accommodate the different vorticity strengths.

Figure 12(a) shows one-dimensional radial profiles of the vorticity corresponding to  $\gamma =0.5$: cuts through the vortex centre along the
 $x$ and
 $y$ directions in figure 11, i.e. parallel and perpendicular to the tripolar shield axis, are shown in blue and red, respectively, together with the azimuthally averaged vorticity profile (in green). We define the radius
 $r_0$ as the radius at which the azimuthally averaged profile passes through zero. Panel (b) shows that this radius decreases monotonically as
 $\gamma$ increases, indicating a continuous shrinkage of the tripolar vortices as the contribution of the instability forcing increases.
(a) One-dimensional profiles obtained for  $\gamma =0.5$ from the two-dimensional population-averaged vorticity profile shown in figure 11. (b) Radius
 $r_0$ corresponding to the root (highlighted in panel (a) by an arrow) of the azimuthally averaged vorticity profile
 $\bar {\omega } (r) = (2{\rm \pi} )^{-1}\int \omega (r,\phi )\,{\rm d}\phi$ (shown in green in panel a), non-dimensionalised by largest scale
 $\ell _1$ in the forcing range.

As shown in figure 13(a), as the vortices shrink with increasing instability growth rate (increasing  $\gamma$), the number density of vortices in the stationary state gradually increases, with more and more vortices in the domain. However, the number of vortices increases by less than
 $10\,\%$ over the whole range of
 $\gamma$, while their radial extent decreases more rapidly with
 $\gamma$, with a reduction by around
 $20\,\%$ in vortex radius over the same range (cf. figure 12) and faster shrinkage at small values of
 $\gamma$ compared with larger
 $\gamma$. Figure 13(b) shows that this results in a rapid and approximately linear growth with
 $\gamma$ in the fraction of the domain area occupied by gaps between vortices (identified as regions where
 $|\omega |\leq 0.01\mathrm {max}(|\omega |)$) at small
 $\gamma$ followed by saturation of this fraction at larger
 $\gamma$. This increase in the gap area with
 $\gamma$ is of great importance in facilitating the observed melting transition. Gaps grow between the lattice sites in the crystal state until, at
 $\gamma =\gamma _c\approx 0.13$, they become sufficiently wide for vortices to begin slipping through and diffuse across the domain.
(a) The number  $N_v$ of vortices observed in the domain in the statistically stationary state increases with
 $\gamma$. In the statistically stationary vortex gas state, vortices are occasionally destroyed or created, an effect captured by the error bars that indicate the standard deviation of the number of vortices. The fluctuations in
 $N_v$ are small compared with the total number of vortices in all cases. (b) Fraction of the domain area occupied by gaps versus
 $\gamma$. Gaps are identified as regions where the absolute value of vorticity
 $|\omega |$ is less than or equal to
 $1\,\%$ of the maximum value in the vortex core. The gap area increases rapidly and approximately linearly with
 $\gamma$ at small
 $\gamma$, an effect important for the melting transition at
 $\gamma \approx 0.13$, and saturates at larger
 $\gamma$.

6. Conditions for the maintenance of the vortex crystal
In view of the non-trivial physical properties of the shielded vortex crystal described in the previous sections, one can ask under which conditions this state is stable and whether it can be disrupted in other ways than via the diffusive melting transition discussed in § 4. Here, we describe two possibilities for destabilizing the vortex crystal state, both involving the disruption of the vortex shields followed by the subsequent appearance of an inverse energy cascade, which may be suppressed in the crystal when shielding is present. Similar behaviour is observed in rapidly rotating Rayleigh–Bénard convection, where the inverse energy cascade may be suppressed by the presence of convective Taylor columns (Grooms et al. Reference Grooms, Julien, Weiss and Knobloch2010; Julien et al. Reference Julien, Rubio, Grooms and Knobloch2012).
6.1. Crystal decay at very small $\gamma$

First, we consider runs from simulation set B, starting in the vortex crystal state (taken from a simulation at  $\gamma =0.05$), and continuously reduce
 $\gamma$ while retaining the full cubic damping term. The vortex crystal is found to remain stable down to
 $\gamma =0.04$. However, for
 $\gamma \leq 0.035$, the shields of the tripolar vortices spontaneously dissolve, followed by an inverse energy cascade culminating in the appearance of a large-scale vortex condensate, as illustrated in figure 14. Two possible explanations suggest themselves. Since
 $\gamma$ is small, one may assume that the random forcing term becomes sufficiently strong to cause the observed dissolution of the shield structures. However, at
 $\gamma =0.04$ (the smallest
 $\gamma$ where the crystal is observed to be stable), we find
 $\varGamma \approx 11$ (with
 $\varGamma$ defined in (2.8)), indicating that the energy injection rate due to the random forcing remains subdominant compared with the instability forcing. Instead, we note that the ratio
 $r(\gamma = 0.035) \approx 1.7$, cf. (2.5), indicating that the time scales of the forcing and the hyperviscous dissipation are comparable. To test whether this is indeed responsible for the observed decay of the crystal at
 $\gamma \leq 0.035$, we performed additional simulations at
 $\gamma =0.005,0.01,0.02,0.03$ and
 $0.035$ with
 $\epsilon =0$ (no stochastic forcing), leaving all other parameters unchanged (set
 $F$ in table 1). For
 $\gamma \leq 0.2$, we observe the same temporal evolution from a vortex lattice initial condition: the shields are seen to rapidly dissolve and an inverse cascade ensues. This suggests that the observed decay phenomenology is indeed independent of the stochastic forcing term. Influence of the stochastic forcing was detected only very close to the onset of crystal decay, namely at
 $\gamma =0.03,0.035$: the crystal decayed rapidly via an inverse cascade in the presence of noise, while for
 $\epsilon =0$, the crystal is stable at
 $\gamma =0.035$ with a random deletion process observed only at
 $\gamma =0.03$, where single vortices disappear one after another from the lattice, as can be seen in supplementary movie SM5. Leaving aside these special cases close to the dissolution threshold, we conclude that the observed vortex decay is largely independent of the stochastic forcing except for a small shift in the threshold. We mention that with a different choice of the parameters
 $\nu _n$,
 $k_2$ or
 $\nu _*$ (see § 2), one may achieve
 $\varGamma \approx 1$, while maintaining
 $r(\gamma ) \gg 1$. In this case, the very destabilization of the crystal would likely be facilitated by the dominance of the stochastic force over instability, rather than by (hyper)viscous effects.
Sequence of states observed at  $\gamma =0.03$ with vortex scale damping and
 $\epsilon =1$, initialised by a vortex crystal state at larger
 $\gamma$. The dissolution of the shields of tripolar vortices in the vortex crystal is followed by an inverse energy cascade.

6.2. The role of nonlinear damping
Next, we examine the role of the nonlinear damping. The results presented by van Kan et al. (Reference van Kan, Favier, Julien and Knobloch2022) already showed that this term plays a crucial role in fully suppressing the inverse cascade once shielded vortices form. In the absence of nonlinear damping at large scales, a residual inverse cascade persists, albeit much weaker than that observed with stochastic forcing only. However, a more systematic investigation of the role of nonlinear damping in this system is still missing. As shown in figure 15(a), the energy spectrum in the vortex crystal is sharply peaked at a principal peak corresponding to the vortex scale ( $k\approx k_v= 19$), with two minor peaks observed at
 $k\approx \sqrt {3}k_v$ and
 $k\approx 2 k_v$. Given this spectral structure, the nonlinear damping in this state will preferentially act on the vortex scale. Hence, it is natural to investigate the situation where the nonlinear damping term is subject to spectral filtering, to include or exclude the vortex scale and study its effect on the stability of the vortex crystal.
(a) Log-log plot of the energy spectrum in the vortex crystal state ( $\gamma =0.05$). The primary peak corresponding to the shielded vortex scale is located at wavenumber
 $k=k_v\approx 19$. Two secondary peaks are seen at
 $k\approx \sqrt {3}k_v$ and
 $k\approx 2 k_v$, corresponding to the next-to-nearest neighbour and next-next-nearest-neighbour distances in the crystal. (b) Lin-log plot of energy deviation from the crystal versus time for different simulations at
 $\gamma =1$, initialised in the crystal state. In each simulation, a different spectral filter is applied to the nonlinear damping, such that it acts only on the wavenumber window
 $[k_{min}^{NL},k_2]$, with
 $k_2=40$ fixed. A sharp transition is observed: when the nonlinear damping acts on the vortex scale
 $k_v\approx 19$, the vortex crystal is stable, but it breaks down when the damping term does not act on
 $k_v$. In the latter case, the well-organised shields dissolve and an inverse cascade ensues wherein individual vortex cores merge and one observes a large-scale condensate at late times.

Table 2 summarises the runs performed in set D, where the cubic nonlinearity is filtered in Fourier space so that it acts on a finite wavenumber interval  $[k_{NL,min},k_{NL,max}]$ with
 $k_{NL,max}=k_2=40$. Table 2 indicates that the vortex crystal is only stable when the nonlinear damping acts on the vortex scale. Otherwise the injected energy will inevitably cascade towards larger scales. This is because the nonlinear damping at the shielded vortex scale is strongly amplified, thereby suppressing the inverse cascade. Figure 15(b) shows time series of kinetic energy confirming this expectation, highlighting a sharp transition at
 $k_{NL,min}=19$: when the filtered damping excludes the vortex scale, the kinetic energy grows and an inverse cascade ensues, while, otherwise, the vortex crystal remains intact. This agrees with the findings of Linkmann et al. (Reference Linkmann, Hohmann and Eckhardt2020), who observed such an inverse cascade and large-scale condensation in a model of moderate Reynolds number 2-D active turbulence with a negative eddy viscosity driving force but no nonlinear damping or random forcing, provided the forcing amplitude was sufficiently large.
Stability of the vortex crystal with nonlinear damping applied only to the wavenumber window  $[k_{NL,min},k_2]$, for different
 $k_{NL,min}$. A sharp transition is present at
 $k_{NL,min}=k_v=19$, i.e. at the energy-containing scale of the vortex crystal (see also figure 15).

In short, the vortex crystal can be disrupted in at least two ways other than the diffusive melting transition described previously: it breaks down when the time scale of (hyper)viscous dissipation at the forcing scale become comparable to the maximum instability growth rate or when the nonlinear damping is turned off at the vortex scale. A third possible mechanism for the breakdown of the vortex crystal arises when the energy injection rate due to the stochastic forcing term becomes comparable to the energy injected by the instability. However, this is not observed with the parameters considered in our simulations, since here viscous dissipation becomes comparable to the small scale instability forcing already at larger values of  $\gamma$.
Although turning off the nonlinear damping at the vortex scale does lead to a breakdown of the crystal state, it should be emphasised that the observed suppression of the inverse energy cascade in that state is not a simple consequence of nonlinear damping. This is clearly seen from the fact that at sufficiently small  $\gamma$,
 $\gamma \lesssim 0.3$, an inverse cascade ensues when the simulations are initialised with small-amplitude initial conditions despite the presence of nonlinear damping; see also figure 16 and van Kan et al. (Reference van Kan, Favier, Julien and Knobloch2022). Instead, it is the presence of coherent, shielded vortices that amplifies the action of the nonlinear damping and leads to the suppression of the inverse energy cascade. Thus, both ingredients are needed for the spontaneous suppression of the inverse cascade.
7. Overview of stationary-state solutions at different $\gamma$

Figure 16 shows an overview of the observed stationary states in the model, extending the state diagram previously shown by van Kan et al. (Reference van Kan, Favier, Julien and Knobloch2022). Four qualitatively distinct states are observed: starting in set A from small-amplitude, random initial conditions with predominantly random forcing, i.e. small  $\gamma$, a large-scale condensate spontaneously forms (blue crosses). As
 $\gamma$ increases beyond approximately
 $\gamma =0.35$, a hybrid state emerges (blue dots) with tripolar, shielded vortices embedded in the remaining large-scale circulation patterns (see van Kan et al. (Reference van Kan, Favier, Julien and Knobloch2022) and figure 17(a,b) for visualisations of such states). Continuing the hybrid states to smaller
 $\gamma$, a range of bistability is found between the condensate and hybrid states, as shown in the inset. In addition, figure 16 shows the branch of high-density vortex states discussed above: the vortex gas (black diamonds) and vortex crystal states (green hexagons), whose amplitude varies approximately linearly with the control parameter
 $\gamma$, as discussed in § 3. The dense SV branch formed by the vortex gas and crystal states coexists with the condensate and hybrid states over a wide range of the control parameter
 $\gamma$, leading to pronounced multistability. The dense SV branch terminates at
 $\gamma \approx 0.04$ below which hyperviscous dissipation becomes comparable to the instability forcing (rather than by the stochastic force) and the shielded vortices are destabilised. The same four types of qualitatively different states described here for cubic friction are also found with quadratic drag, as shown in Appendix A, thereby highlighting the potential relevance of our results to geophysical flows. These are characterised by large-scale, highly anisotropic, quasi-two-dimensional turbulent flows, sustained by various linear instability mechanisms. Indeed, the notion of a vortex gas has recently been used by Gallet & Ferrari (Reference Gallet and Ferrari2020) to derive a transport closure for turbulence driven by baroclinic instabilities in an oceanic context.
Overview of the stationary states found in nonlinearly damped two-dimensional turbulence driven by the hybrid forcing defined in (2.3) for different values of  $\gamma$. Four qualitatively different states are observed. First, a large-scale condensate (LSC) forms spontaneously from small-amplitude, random initial conditions provided
 $\gamma <0.35$. Second, a hybrid state with smaller-scale shielded vortices embedded in the LSC (LSV
 $+$SV) emerges, as reported by van Kan et al. (Reference van Kan, Favier, Julien and Knobloch2022); see also figure 17. Third, a dense shielded vortex gas and fourth, a shielded vortex crystal, form together the branch of dense states which constitute the primary topic of the present work.

Overview of the stationary states observed with quadratic damping at different values of  $\gamma$. These states are qualitatively similar to those observed with cubic damping. Filled contours show vorticity, while the contour lines in panel (b) show the large scale streamfunction.

8. Conclusions and outlook
In this work we have presented a detailed study, based on extensive DNS, of the statistically stationary states observed in 2-D turbulence driven by a hybrid forcing that interpolates between stochastic stirring and linear instability in the presence of nonlinear damping. Our simulations reveal an approximately self-similar evolution from small-amplitude random initial conditions to a high-density vortex gas state when the forcing is dominated by the instability term. The observed evolution begins with a short-lived initial inverse cascade that gives way to the formation of shielded vortices of positive and negative polarities. This brief phase is in turn followed by spontaneous symmetry breaking resulting in a state with vortices of one sign only. This broken-symmetry state further evolves via a slow, random nucleation process through which ever more coherent vortices are generated, up to a critical threshold where the number of shielded vortices (equivalently, the enstrophy) is approximately two fifths of its maximum value. Once this threshold is reached, the interstitial space between vortices has shrunk sufficiently for the coherent vortices to efficiently impart vorticity to these interstices, leading to the formation of vortex seeds and an explosive increase in vortex number, resulting in convergence towards a high-density statistically stationary state. The interplay between turbulence and the coherent vortices remains incompletely understood. Specifically, the dependence of the nucleation time scale on the forcing strength and the detailed mechanism of vortex nucleation and turbulence suppression, as well as the exact threshold density at which it occurs all require further investigation, as does the impact of the domain size, all of which are left for a future study.
The second key result reported here is that the high-density vortex gas state obtained from the observed self-similar, explosive evolution that sets in when the above threshold is exceeded exists over a wide range of forcing parameters, and undergoes a continuous or supercritical phase transition to a hexagonal vortex state at a threshold  $\gamma =\gamma _c\approx 0.13$, below which individual vortices are trapped in a lattice and no longer diffuse across the domain. We showed that this transition is facilitated by rapid growth of inter-vortex gaps with increasing
 $\gamma$ when
 $\gamma$ is small. This transition was found to be sharp in the presence of noise, and becomes imperfect in its absence. This somewhat counterintuitive behaviour appears to be associated with defects which anneal in the presence of noise but persist in its absence. The loss of positional order in the vortex gas was quantified using methods from statistical physics and crystallography focusing on vortex diffusivity, based on observed mean squared displacements, and the radial distribution function, with brief remarks on Voronoi diagrams and the Lindeman parameter. The results revealed that the vortex ‘gas’ is in fact liquid-like in terms of the distribution of relative vortex positions. It is important to stress here that the type of diffusive melting transition described in this work differs qualitatively from that described by James et al. (Reference James, Suchla, Dunkel and Wilczek2021), since no vortices are annihilated here, the spontaneous symmetry breaking is maintained during the transition and no hexatic phase is observed, although with suitable initial conditions, a transient hexatic phase exists in the present problem as well but was not observed to arise spontaneously. Somewhat surprisingly, we do not observe any spontaneous transitions between the vortex crystal and turbulence, in contrast with the results of James et al. (Reference James, Suchla, Dunkel and Wilczek2021), although we cannot exclude the possibility that such behaviour might occur in the present model with different parameter values.
Another important result obtained in this paper is the population-averaged vorticity profile of the tripolar shielded vortices in this system. This profile indicates that the structure of the coherent tripolar vortices changes with the control parameter  $\gamma$: the vortex size decreases monotonically with increasing
 $\gamma$ and vortices in the crystal state feature a less elliptical vortex core than at larger
 $\gamma$. No theoretical explanation is available for these observations and any future progress on these questions will be a significant contribution to our understanding of this prominent building block of instability-driven 2-D turbulence. In fact, the gradual decrease in vortex size was shown to be offset, in part, by a correspondingly gradual increase in the number of vortices in the stationary state, resulting in an approximately linear growth in the gap area (as measured by the area where the vorticity magnitude is below
 $1\,\%$ of the maximum) with the control parameter
 $\gamma$. The vortex intensity was likewise found to scale approximately linearly with
 $\gamma$ over a wide range of
 $\gamma$.
The conditions for the suppression of the inverse cascade in the vortex crystal were analysed, revealing that three key ingredients are required. First, the dominant energy injection must stem from the instability forcing. Second, the nonlinear damping must act at the scale of individual vortices and third, the time scale of viscous dissipation must be large compared to the inverse instability growth rate at the most linearly unstable scales. Violation of any of these conditions results in the dissolution of the shields of the coherent vortices, triggering a standard inverse energy cascade and the formation of a large-scale condensate. Finally, all known statistically stationary states of this problem were discussed, including earlier results from van Kan et al. (Reference van Kan, Favier, Julien and Knobloch2022), namely the large-scale condensate, hybrid states consisting of large-scale circulation patterns with embedded shielded vortices, and the dense vortex gas and vortex crystal states.
Many questions remain open. Since transient evolution towards an active vortex crystal, reminiscent of the transient dynamics observed here, has been observed in a model of active turbulence (James et al. Reference James, Bos and Wilczek2018), it is natural to ask if the self-similarity of this evolution and the non-trivial scaling of its time scale with the driving strength is found in the moderate-Reynolds-number flows of active turbulence models as well. Moreover, while it is well known that large-scale self-organization occurs in highly anisotropic 3-D turbulent flows, such as flows in thin layers or rapidly rotating flows, it is as yet unclear what will be the fate of the vortex crystal described here in quasi-2-D flows, i.e. when the flow is no longer required to be strictly 2-D. Three-dimensionality is typically not taken into account in numerical studies of vortex crystals (see e.g. James et al. Reference James, Suchla, Dunkel and Wilczek2021), although numerically metastable 2-D lattices of 3-D vortices are observed in rapidly rotating turbulence (Di Leoni et al. Reference Di Leoni, Alexakis, Biferale and Buzzicotti2020). It is therefore important to clarify the stability of such vortex crystals in a quasi-2-D setting, both from a fundamental standpoint, and because laboratory realisations of such states will necessarily be 3-D and hence prone to 3-D instabilities (e.g. Kerswell Reference Kerswell2002; Seshasayanan & Gallet Reference Seshasayanan and Gallet2020).
It will also be of considerable interest to develop a hydrodynamic description of the vortex gas (or liquid!) extending the approach of Wiegmann & Abanov (Reference Wiegmann and Abanov2014) to include the effects of vortex shielding and possibly the tripolar vortex structure. More generally, since the statistical mechanics of point vortex systems is well developed (Onsager Reference Onsager1949; Eyink & Sreenivasan Reference Eyink and Sreenivasan2006), including the aforementioned effects in this context would yield significant insights into the properties of the shielded vortex gas identified here.
We anticipate that the predictions of the present model may be verified in highly anisotropic flows driven by spectrally localised instabilities, where ambient fluctuations might play the role of the stochastic forcing term. It is important to stress that, for the dense vortex states, the ratio  $\varGamma$ is always much greater than one, implying that the impact of the presence or absence of a stochastic forcing is minor. This observation suggests that states of this type are likely to be robust, provided only that the turbulent state is forced via an instability.
Supplementary movies
Supplementary movies are available at https://doi.org/10.1017/jfm.2024.162.
Funding
This work was supported by the National Science Foundation (grants DMS-2009319, DMS-2009563, DMS-2308337 and DMS-2308338) and by the German Research Foundation (DFG Projektnummer: 522026592). A.v.K. thanks Ian Grooms for fruitful discussions and Paul Holst for pointing out useful references on backscatter parametrisations. This research used the Savio computational cluster resource provided by the Berkeley Research Computing program at the University of California, Berkeley (supported by the UC Berkeley Chancellor, Vice Chancellor for Research, and Chief Information Officer). In addition, this work also used the Alpine high performance computing resource at the University of Colorado, Boulder. Alpine is jointly funded by the University of Colorado Boulder, the University of Colorado Anschutz, and Colorado State University. Data storage for this project was supported by the University of Colorado Boulder PetaLibrary.
Declaration of interests
The authors report no conflict of interest.
Appendix A. Quadratic bottom drag
Many studies of nearly 2-D turbulence include a linear Rayleigh drag law to model the effect of bottom friction (Boffetta & Ecke Reference Boffetta and Ecke2012). However, in the context of geophysical turbulence, numerous works consider a quadratic bottom drag law, e.g. Jansen et al. (Reference Jansen, Adcroft, Hallberg and Held2015) and Gallet & Ferrari (Reference Gallet and Ferrari2020). Such a quadratic drag law can be obtained from dimensional considerations and is widely used in numerical ocean models (Gill Reference Gill1982; Willebrand et al. Reference Willebrand, Barnier, Böning, Dieterich, Killworth, Le Provost, Jia, Molines and New2001; Egbert et al. Reference Egbert, Ray and Bills2004; Couto et al. Reference Couto, Alford, MacKinnon and Mickett2020).
To test the robustness of the results presented here with respect to the choice of damping, we summarise here the results from runs in set C, i.e. DNS of (2.1)–(2.3) with quadratic damping ( $m=1$ in (2.1)) and
 $\beta =0.1$. Figure 17 shows snapshots of solutions obtained with this quadratic friction and confirms that the four stationary states reported for cubic friction by van Kan et al. (Reference van Kan, Favier, Julien and Knobloch2022) also exist in the geophysically relevant case of quadratic friction. Panel (a) shows the classical large-scale condensate obtained from small-amplitude initial conditions for
 $\gamma =0.05$. Panel (b) shows a hybrid state, again obtained from small-amplitude initial conditions, with two large-scale counter-rotating patches with embedded tripolar vortices whose sign is aligned with the background circulation. Panel (c) shows a dilute vortex gas, also obtained from small-amplitude initial conditions for
 $\gamma =1.0$. Finally, panel (d) shows a stable vortex lattice obtained by initialising with a similar lattice state at
 $\gamma =0.05$.
Appendix B. Voronoi analysis of spatial order in dense vortex states
An alternative tool for quantifying changes in regularity in the spatial distribution of the vortices is the Voronoi tesselation, a classical tool in the study of crystals (Blatov Reference Blatov2004). The Voronoi tesselation associated with a given set  $M$ of points in the plane is given by a set of polygons, each corresponding to a unique point in the set
 $M$, defined as the set of points whose Euclidean distance from the point is smaller than from any other point in
 $M$. In our application, we take
 $M$ to be the set of vortex centres. Since we are considering a finite periodic domain, while Voronoi tesselations are constructed for the entire plane, it is necessary to exclude polygons at the edges of the domain to avoid spurious boundary effects. We make use of the spatial.Voronoi module provided by the scipy package (Virtanen et al. Reference Virtanen2020) to compute the Voronoi diagrams.
Figure 18(a–c) shows that the Voronoi tesselation associated with the dense vortex states varies strongly with  $\gamma$. At
 $\gamma =0.05$, where the hexagonal vortex crystal is observed, the corresponding Voronoi tesselation also consists of hexagons. As
 $\gamma$ increases above the melting threshold, the polygons in the Voronoi tessellation vary more and more in shape. Figure 18(d–f) quantifies this visual insight in terms of histograms of the number of edges at
 $\gamma =0.05$ (in the crystalline state) and at
 $\gamma =0.25$ and
 $\gamma =1$ (above the melting threshold). At
 $\gamma =0.05$, all polygons are indeed hexagonal, while at
 $\gamma =0.25$, there are also pentagons and heptagons. At
 $\gamma =1$, the fraction of hexagons has decreased further, while pentagons and heptagons are more frequent, and a small number of octagons and tetragons also appear. In short, the variance of the number of edges increases as
 $\gamma$ increases.
(a–c) Voronoi tesselations based on the vortex centre locations show a change in regularity with increasing  $\gamma$: (a)
 $\gamma=0.05$; (b)
 $\gamma=0.25$ and (c)
 $\gamma=1$. Note that only a fraction of the domain is shown. (d–f) Time-averaged histograms of the number of edges in the above Voronoi diagrams at the same values of
 $\gamma$. The variance of the number of edges increases with increasing
 $\gamma$: the lattice state at
 $\gamma =0.05$ is perfectly hexagonal, while pentagons and heptagons appear at
 $\gamma =0.25$, and a small number of octagons and tetragons at
 $\gamma =1$.

In addition to the number of edges, another quantifiable characteristic of the Voronoi polygons is their area. Figure 19 shows histograms of the polygon areas (non-dimensionalised by  $\ell _1^2$, where
 $\ell _1=2{\rm \pi} /k_1$ is the largest forcing scale). The histogram is sharply peaked in the crystalline state, and its variance increases monotonically with
 $\gamma$ in the vortex gas state. In addition, both the average polygon area and its most probable value shrink as
 $\gamma$ increases, observations that are indicative of a reduced average distance between vortex centres.
Probability density function (PDF) of the area  $A_{polygon}$ of the polygons in the Voronoi tesselation for different values of
 $\gamma$, non-dimensionalised according to
 $\tilde {A}_{polygon} = A_{polygon}/\ell _1^2$. The PDF is sharply peaked at
 $\gamma =0.05$ in the crystalline state, and broadens significantly as
 $\gamma$ increases above the melting threshold. The mean area decreases as
 $\gamma$ increases, indicating that the distance between vortex cores also decreases. See also figure 12.

Appendix C. Impact of noise on the crystallisation transition
One can ask to what extent the melting/crystallisation transition observed here depends on the forcing characteristics. Figure 20 shows the mean squared displacement of shielded vortices observed with a modified random forcing with the same energy injection rate  $\epsilon$, but acting over the wider range
 $k\in [33,40]$ instead of a thin shell near
 $k_2=40$. The instability forcing term is unchanged. A sharp transition is observed from a trapped state at
 $\gamma =0.125$ to a diffusing state at
 $\gamma =0.15$, consistent with the results described in the main text. The transition behaviour and the location of the transition is thus robust to changes in the scales subject to random forcing.
Mean squared displacement versus time at (a)  $\gamma =0.125$ and (b)
 $\gamma =0.15$ with the stochastic forcing acting on
 $[k_1=33,k_2=40]$, instead of a thin shell near
 $k_2=40$. Individual vortices in the system are trapped at
 $\gamma =0.125$, but diffuse across the domain at
 $\gamma =0.15$, indicating that the melting transition near
 $\gamma =\gamma _c\approx 0.13$ is robust to changes in the width of the forcing window. Dashed line in panel (b) indicates a linear fit.

In contrast, when the energy injection rate  $\epsilon$ by the random forcing is set to zero, a qualitative change in the system behaviour is observed, with finite diffusion rates below the threshold in the absence of noise, as shown in figure 21 in terms of the mean squared displacement (cf. figure 8). In the absence of random forcing (
 $\epsilon =0$), long-lived line defects spontaneously form as shown in figure 22(a), which lead to residual vortex diffusion below the threshold at
 $\gamma _c\approx 0.13$ observed in the presence of stochastic forcing. Supplementary movie SM6 shows that these defects are long-lived and thus significantly affect the crystal structure: contrast this with the regular lattice structure seen in figure 22(b) and supplementary movie SM7, with identical parameters as in supplementary movie SM6 except for
 $\epsilon =1$ (random forcing turned on), where no defects are present. The difference between these two situations, with and without stochastic forcing, may be interpreted in terms of annealing of the crystal structure by the random stirring force. Other phenomena where a transition is sharpened in the presence of noise include noise-induced synchronisation (Zhou & Kurths Reference Zhou and Kurths2002; Nagai & Kori Reference Nagai and Kori2010).
Mean squared displacement of vortices at  $\epsilon =0$ versus non-dimensional time. At the same values of
 $\gamma$, vortices are trapped when the random forcing is active (
 $\epsilon =1$). Here, in contrast, a small residual diffusion is observed.

Snapshots of the vorticity field from set B at  $\gamma =0.075$ with random forcing (a) turned off (
 $\epsilon =0$) and (b) turned on (
 $\epsilon =1$).



