I. INTRODUCTION
Direct conversion between thermal and electrical energy using thermoelectric (TE) materials may have important social benefits for energy efficiency.Reference Mehta and Ramanath1,Reference Misture and Edwards2 As with many technologies, however, the TE materials themselves limit the device performance. Enhancement of TE properties can be achieved by lowering the thermal conductivity (k) while avoiding significant deterioration of the Seebeck coefficient (S) and the electrical conductivity (σ). One way to achieve this enhancement is to engineer the superlattice structure.Reference Shakouri3,Reference Kumar, Hedhili, Cha, Tritt and Alshareef4
Ruddlesden–Popper (RP)-type SrO(SrTiO3)n phases show great potential for realization of low k owing to their superlattice structure.Reference Abutaha, Kumar, Li, Dehkordi, Tritt and Alshareef5–Reference Sun, Qin, Li, Li, Zhang, Zhang and Tang7 SrO(SrTiO3)n is a superlattice of SrO layers and SrTiO3 slabs alternately stacked along the c-axis. As with engineered superlattices, such natural superlattices can be expected to show significant anisotropy in thermal transport, with the thermal conductivity through the layers along the c-axis being significantly lower than within the layers. The interfaces between SrO layers and SrTiO3 slabs may enhance phonon scattering and lead to a lower thermal conductivity.Reference Chernatynskiy, Grimes, Zurbuchen, Clarke and Phillpot8
McCoy et al. reported that Sr3Ti2O7 (S3T) and SrTiO3 are the only stable SrO(SrTiO3)n phases.Reference McCoy, Grimes and Lee9 Most of the literature focuses on synthesizing platelet-shaped S3T particles by the molten salt synthesis (MSS) method.Reference Liu, Lu, Xu and Zhoun10,Reference Ishida, Kakimoto, Ogawa and Aki11 Although S3T particles with plate-like morphology can be easily prepared using MSS and S3T thin films can be grown epitaxially on SrTiO3 substrates,Reference Orloff, Tian, Fennie, Lee, Gu, Mateu, Xi, Rabe, Schlom, Takeuchi and Booth12,Reference Jungbauer, Hühn, Egoavil, Tan, Verbeeck, Tendeloo and Moshnyaga13 it is difficult to prepare either single crystals or bulk ceramics of phase pure S3T due to complex decomposition reactions.Reference Emanuel, Alexandr, Marianne, Muller, Paufler and Meyer14 Koumoto's group reported the properties of rare-earth ion (La, Nd, Sm, and Gd)-doped and Nb-doped S3T TE materials synthesized by calcining the powder twice at 1400–1450 °C in Ar, followed by hot pressing at 1400–1450 °C in Ar.Reference Wang, Lee, Ohta and Koumoto15,Reference Lee, Wang, Kim, Ohta and Koumoto16 Detailed information about the relationship between phase structure and process parameters was not presented, and this long, complex fabrication procedure was expensive and hard to control. Until now, the reasons for the decomposition and phase transition of the RP phase have not been well understood. Furthermore, little work has focused on the fabrication of phase pure S3T bulk ceramics under normal sintering conditions, or the mechanism of the stabilization of the S3T RP phase using dopant ions.
Lead (Pb) has been widely used in traditional metal or semiconductor TE materials for its high effective mass.Reference Snyder and Toberer17,Reference Gorsse, Bellanger, Brechet, Sellier, Umarji, Ail and Decourt18 Since the ionic radius of Pb2+ (119 pm) is similar to that of Sr2+ (118 pm) and Pb2+ has the same valence as Sr2+, PbO is a good candidate for stabilizing the SrO(SrTiO3)n RP phase. In addition, the replacement of Pb2+ for Sr2+ can also increase the effective carrier mass, which should be beneficial for reducing the thermal conductivity of TE materials.
In this study, we investigated the stability of the S3T RP phase as a function of Pb2+ concentration. To understand the stabilization mechanism, the lattice characteristics such as bond lengths and bond angles were studied in detail for both S3T and Sr4Ti3O10 RP phases. We believe that the determination of the stabilization mechanism of the SrO(SrTiO3)n RP phase is useful for developing an effective procedure for fabricating phase pure S3T by a conventional solid state method.
II. EXPERIMENTAL PROCEDURE
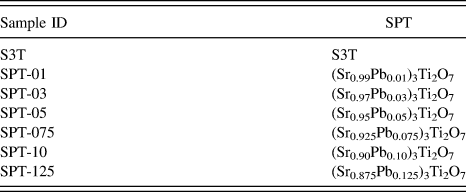
Strontium titanate samples were prepared by solid-state reaction using stoichiometric amounts of SrCO3 (99.9%, Alfa Aesar), TiO2 (99.5%, Rutile grade, Alfa Aesar), and PbO (99.9%, Alfa Aesar). The general formula of the material studied is (Sr1−xPbx)3Ti2O7 (designated as SPT), where x is 0, 0.01, 0.03, 0.05, 0.075, 0.1, and 0.125. The compositions and sample identification are shown in Table I. The initial stoichiometric compositions were ball-milled with ZrO2 media in ethanol for 16 h. After drying in an oven at 70 °C for 24 h, the powder mixture was calcined at 1150 °C for 4 h, and then ball milled with 6 mm diameter ZrO2 media for 24 h. The milled powders were pressed into disks of 1 mm thickness and 12.7 mm diameter at 200 MPa, and then sintered at 1400–1550 °C for 2 h in air. SPT samples were also sintered in Ar and O2 to further investigate the influence of atmosphere on the phase formation.
Composition and identification of SPT samples.

Sample densities were measured using the Archimedes method. The theoretical density of the mixed phase samples was calculated from the fraction of phases obtained by Rietveld refinement. The phase structure and lattice constants were examined by x-ray diffraction (XRD, PANalytical, Inc. Xpert Pro MPD diffractometer, Holland) using Cu Kα radiation with a step size of 0.02°. Crystallographic data were obtained using Rietveld analysis and JADE 9.0 software. The quality of the refinement was quantified by the corresponding figures of merit: weighted profile residual R wp and goodness of fit indicator S = R wp/R exp. For SPT-01∼SPT-125 samples, R wp is in the range of 11.94–14.79%, S is in the range of 1.26–1.84. We believe that the Rietveld analysis shows a reasonable fit.
Thermally-etched microstructures were observed by scanning electron microscopy (SEM; Hitachi S-3500, Hitachi Corp., Tokyo, Japan).
III. RESULTS AND DISCUSSION
A. Characteristics of undoped S3T samples
Figure 1 shows XRD patterns of calcined and sintered undoped S3T samples. As evidenced by peaks at 2θ = 31.806° and 44.505°, which correspond to the (105) and (0010) planes, respectively, S3T was obtained by calcining a mixture of SrCO3 and TiO2 at 1150 °C for 4 h. After S3T samples were sintered, the (105) peak becomes weaker and the (0010) peak disappears. It is obvious that S3T and SrTiO3 coexist and SrTiO3 is the main phase in the samples sintered at 1450–1550 °C. The amount of SrTiO3 phase increases with increasing sintering temperature.
XRD patterns of undoped S3T (SPT) samples calcined at 1150 °C for 4 h and air-sintered at different temperatures.
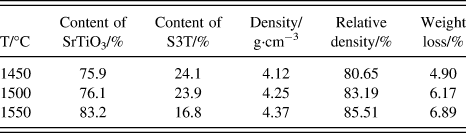
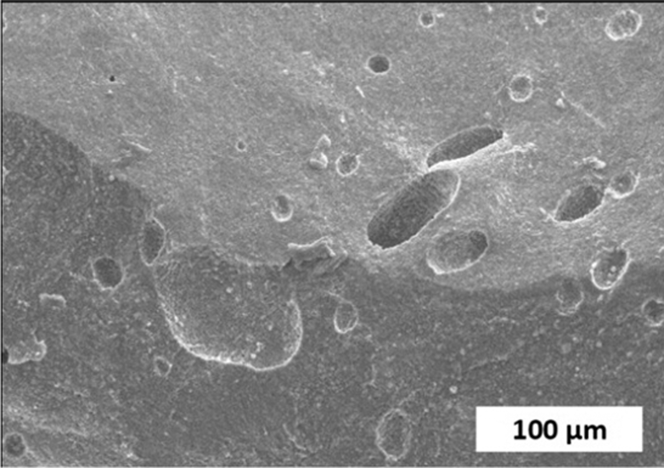
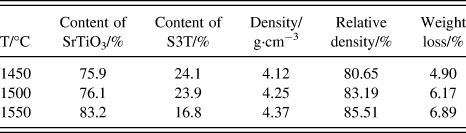
The relative densities and phase contents of S3T ceramics sintered at different temperatures are shown in Table II. The S3T samples were <86% dense even after sintering to a temperature as high as 1550 °C. The weight of the samples decreases with increasing sintering temperature, as a result of SrO evaporation. Evaporation is supported by the fracture surface of the sample sintered at 1550 °C (Fig. 2) which shows the formation of ≥20 μm pores and increased weight losses of 4.9 and 6.9% when sintered at 1450 and 1550 °C, respectively. Based on these initial studies, we believe that S3T decomposes to form SrTiO3 due to the evaporation of SrO, as shown in Eq. (1).
 $${\rm{S}}{{\rm{r}}_{\rm{3}}}{\rm{Ti}}{{\rm{O}}_{\rm{3}}}{{\rm{O}}_{\rm{7}}} \to 2{\rm{SrTi}}{{\rm{O}}_{\rm{3}}} + {\rm{SrO}} \uparrow \quad .$$
Phase compositions and densities of air sintered S3T samples.
SEM micrograph of an S3T sample sintered at 1550 °C for 2 h in air showing large pores due to SrO evaporation.
SrTiO3 can also be regarded as a kind of SrO(SrTiO3)n RP phase with n = ∞ and is the most stable compound in the Sr–Ti–O RP system. In a SrTiO3 unit cell, the coordination number of Sr2+ is 12, and that of Ti4+ is 6. The bond lengths and bond angles of Sr–O and Ti–O are shown in Table SI (see supplementary material). SrTiO3 has the strongest 3-dimensional stability in the SrO–(SrTiO3) system since all of the Ti–O bonds have the same bond length (0.1952 nm) with bond angles of 90°. The same characteristics can be found for the Sr–O bond, as shown in Fig. SI(a) and Table SI.
The unit cell of S3T consists of defect layers of SrO between sheets of SrTiO3 perovskite layers. These planar defects can be described by removal of the sheets of TiO6 octahedra along (001) and shear of the remaining perovskite layers by 1/2[111].Reference Nien and Lu19,Reference Reshak20 In the S3T crystal structure, the Sr2+ cation has two different positions in the lattice—one with a coordination number of 12 (labeled Sr1), which is located in the octahedra stack, and one with the coordination number of 9 (labeled Sr2), located at the boundary between the octahedra stack and the rock salt SrO layer, as shown in Fig. SI(b) (see supplementary material). This analysis indicates that the S3T crystal structure can accept two different cations at the Sr2+ positions and that the Sr1 position can be filled with larger cations.Reference Beznosikov and Aleksandrov21
The crystallographic data of calcined S3T were analyzed by Rietveld refinement based on the I4/mmm space group. The Rietveld fitting of S3T is shown in Fig. SII (see supplementary material). The reliability factor R was 11.99%, indicating a reasonable fit. The calculated crystal parameters such as bond lengths and bond angles are given in Table SII (see supplementary material). In agreement with the standard crystallographic data of the SrTiO3 lattice structure, bond lengths of Ti–O1 and Ti–O2 are almost the same (0.1951 and 0.1952 nm) and the bond angles Oi–Ti–Oj (i ≠ j, i, j = 1, 2, 3) were 90°. The Ti–O3 bond length was shorter (0.1933 nm). This result indicates that the Ti–O octahedra were maintained in the perovskite layer of the S3T lattice structure. However, the main difference was found in the Sr–O bond lengths and angles. All of the Sr–O bond lengths are shorter in S3T than in the SrTiO3 cell, and the Sr–O bond angles were distorted from −4.22° to 2.06°. These data demonstrate an asymmetric structure which contributes to the metastability of the S3T structure.
The bond length of Sr2–O2 is important, because the Sr2–O2 bonds connect the rock-salt SrO and the perovskite layers. The Sr2–O2 bond length is the shortest (0.2544 nm) of the Sr–O bonds. The percent change in the Sr2–O2 bond length amounts to −7.86% which is a large change from the equilibrium position and thus significant stress must be generated in the lattice. As a result, the entire S3T lattice lies in a relatively high energy state and the Sr2–O2 bonds are easily broken by lattice vibrations at high temperatures, releasing the lattice stress. Finally, breaking the Sr2–O2 bond leads to the phase transformation from S3T to SrTiO3 and a new equilibrium is established. This analysis demonstrates why it is difficult to prepare SPT ceramics using conventional sintering but suggests that S3T can be stabilized by chemical substitution which alleviates these lattice stresses.
B. Characteristics of SPT samples sintered in air
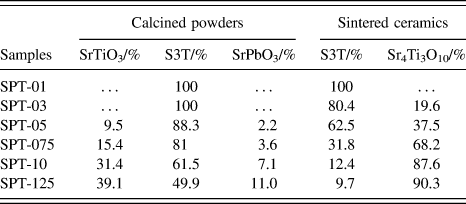
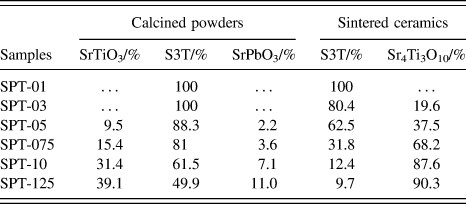
Figure 3 shows XRD patterns of SPT powders calcined at 1150 °C for 4 h. It reveals that phase pure S3T was obtained when PbO is doped at an amount less than x = 0.075. The characteristic peaks (105) and (0010) can be clearly distinguished. When the PbO amount is higher than x = 0.05, SrPbO3 begins to appear in addition to the SrTiO3 phase. SrTiO3, S3T, and SrPbO3 coexist in the calcined SPT samples when heated from 1450 °C to 1550 °C. The percentage of each phase in the calcined powders is listed in Table III. It can be seen that the concentration of SrPbO3 and SrTiO3 increase with increasing PbO concentrations. Although PbO evaporates at 889 °C, due to its low melting point, it appears that PbO reacts with SrCO3 to form SrPbO3. Moreover, the Sr:Ti ratios of SPT-10 and SPT-125 samples are much closer to that of Sr4Ti3O10, but Sr4Ti3O10 was not observed in the calcined powders further demonstrating that Pb2+ stabilizes S3T.
XRD patterns of SPT powders air calcined at 1150 °C for 4 h.
Phase composition of SPT samples calcined at 1150 °C for 4 h and then air-sintered at 1550 °C for 2 h.
XRD patterns for the SPT samples sintered at 1550 °C in air are shown in Fig. 4. Pure S3T is obtained in the SPT-01 sample. It is interesting to note that the SrTiO3 and SrPbO3 phases in the calcined powder are not present in the sintered samples. Although the most intense peak is still at 2θ ≈ 31.8°, i.e., the (105) plane of S3T, further analysis shows that the peak can be divided into two peaks, one belonging to the (105) plane of the S3T phase, and the other to the (107) plane of the Sr4Ti3O10 phase, as shown in Fig. 4(b). Sr4Ti3O10 and S3T coexist in all of the sintered samples except SPT-01.
XRD patterns of SPT samples air sintered at 1550 °C for 2 h, (a) 2θ = 20–70° and (b) 2θ = 31–33°.
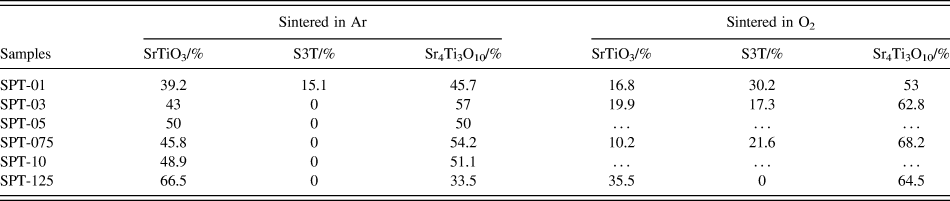
The concentrations of the Sr4Ti3O10 and S3T phases in the sintered samples, as determined by Rietveld refinement of the XRD patterns, are listed in Table III. It is clear that the concentration of S3T phase decreases with increasing PbO, whereas the concentration of Sr4Ti3O10 increases. When the PbO dopant is less than x = 0.05, S3T is the major phase (i.e., its concentration is above 50%). When the PbO doping level is higher than 0.075, Sr4Ti3O10 is the major phase and it reaches a maximum of 90.3% when x = 0.25.
The lattice constants of the S3T phase in the samples with x = 0–0.075 were calculated and the variation of lattice constant with increasing PbO content is plotted in Fig. 5. It is seen that both the a and c parameters increase with increasing PbO content, which results in a larger lattice volume. In addition, the c/a ratio decreases, suggesting that the degree of tetragonality is reduced. To further understand the mechanism of the Pb2+ substitution, the formation enthalpy of the Pb-doped S3T is calculated by the first principle theory, as shown in Table SIII (see supplementary material). The calculated results demonstrate that the unit cell of Pb2+-doped S3T has a relatively lower energy. Thus, doping with a small concentration of Pb can improve the structural stability, and the structure's thermodynamic stability is better when Pb2+ substitutes for Sr2+ at Sr1 positions in the RP lattice structure. This substitution leads to distortion of the lattice and contributes to the slight increase of the lattice constants a and c.
Lattice constants of S3T in the SPT samples sintered at 1550 °C in air.
Based on the XRD results of the calcined powders, we consider two phenomena; one is the disappearance of the SrPbO3 phase, and the other is the formation of Sr4Ti3O10 phase. It is easy to understand why the SrPbO3 phase disappears since SrPbO3 transforms from orthorhombic to tetragonal at ∼450 °C, and subsequently transforms from tetragonal to cubic at ∼810 °C. Finally, SrPbO3 decomposes to SrO and PbO above 1000 °C, as shown in the following formula.Reference Jacob and Jayadevan22,Reference Klein, Cook and Wong-Ng23
 $${\rm{SrPb}}{{\rm{O}}_{\rm{3}}}\buildrel { \ge 1000^\circ {\rm{C}}} \over \longrightarrow {\rm{PbO}} \uparrow {\rm{ +\, SrO}} \uparrow {\rm{ + }}{{\rm{1}} \over {\rm{2}}}{{\rm{O}}_{\rm{2}}} \uparrow \quad .$$
The formation of Sr4Ti3O10 is most sensitive to the original Sr:Ti ratio. Because the Sr:Ti ratios of SPT-075, SPT-10, and SPT-125 are much closer to that of Sr4Ti3O10, Sr4Ti3O10 is the major phase in the sintered ceramics.
Sr4Ti3O10 is an intermediate phase between SrTiO3 and S3T. Sr4Ti3O10 has a tetragonal structure with the space group of I4/mmm and lattice parameters of a = 0.39 nm, c = 2.81 nm (PDF No. 97-003-4630). The lattice structure of Sr4Ti3O10 is more complex than that of S3T since the Sr2+ cation has three different positions in the unit cell. The additional position for the Sr2+ with a coordination number of 12 is located in the middle of the octahedral layer, labeled Sr3, as shown in Fig. SIII (see supplementary material). In addition, there are two different positions for Ti4+ cations. One is located in the center layer of the three TiO6 octahedral layers (Ti1), and the other is in the oxygen octahedral position close to the edge of the rock-salt SrO layers (Ti2). Rietveld refinement of the Sr4Ti3O10 lattice structure shows that all of the Sr–O bond lengths are shorter than those in the SrTiO3 cell, and the Sr–O bond angles are distorted, similar to the characteristics observed in S3T. The perovskite layer in Sr4Ti3O10 does not have cubic symmetry.
The Sr4Ti3O10 crystal structure can be characterized by four parameters (D1, D2, D3, and S1) along the c-axis, which represent the different Ti–O distances inside the TiO6 octahedra, and the Sr2–O2 interplanar distance, respectively, as indicated in Fig. SIII. It should be noted that the structure refinement performed by RP assumed no rumpling and that all of the Ti–O bonds along the c-axes have the same length.Reference Ruddlesden and Popper24,Reference Noguera25 In reality, the Ti–O bond lengths are not all the same. D1, D2, and D3 are 0.1911 nm, 0.1855 nm, and 0.1967 nm, respectively. This implies the presence of deformed TiO6 octahedra. The largest change in the Ti–O bond length amounts to −4.97%, compared to the stable Ti–O bond length (0.1952 nm) in SrTiO3. The Sr2–O2 bond length (S1) between the TiO6 octahedra and the SrO layers is still the shortest one, pushing the oxygen and strontium atoms away from and towards the TiO6 octahedra layers, respectively. This result reveals that the Sr4Ti3O10 crystal structure stays in a much higher energy state and is even more unstable than S3T.
Several papers report that S3T is the most stable phase among the RP compounds in the SrO(SrTiO3)n system and that there is no driving force to form single-phase samples with higher n.Reference Kamba, Samoukhina, Kadlec, Pokorny, Petzelt, Reaney and Wise26,Reference Jacob and Rajitha27 However, the Sr4Ti3O10 phase is found to be the main phase in the SPT samples with x ≥ 0.075. To determine whether Pb2+ stabilizes Sr4Ti3O10 by alleviating lattice strain, crystallographic data for Sr4Ti3O10 (JCPDF data PDF No. 97-003-4630) and SPT-125 by Rietveld refinement are shown in Table SIV (see supplementary material). Expansion of both the a-axis and the c-axis were observed, resulting in an overall increase of lattice parameters a and c. It is clear that both the Ti–O and Sr2–O2 bond lengths are larger than those in undoped Sr4Ti3O10. These results indicate that Pb2+ can substitute for Sr2+ in the Sr4Ti3O10 lattice and increase the Ti–O and Sr2–O2 bond lengths. It is believed that this substitution decreases the lattice stress, causing the lattice to shift to a relatively lower energy state and aid in the stabilization of Sr4Ti3O10.
In addition to the effect of Pb2+ on the stabilization of the RP lattice structure, the function of SrO on the formation of the RP phase should also be considered. During sintering, the final phase structure comes from a series of complex, iterative reactions, described as the following equations:
 $$2{\rm{SrTi}}{{\rm{O}}_3} + {\rm{SrO}} \to {\rm{S}}{{\rm{r}}_{\rm{3}}}{\rm{T}}{{\rm{i}}_{\rm{2}}}{{\rm{O}}_{\rm{7}}}\quad ,$$
 $$3{\rm{SrTi}}{{\rm{O}}_{\rm{3}}} + {\rm{SrO}} \to {\rm{S}}{{\rm{r}}_{\rm{4}}}{\rm{T}}{{\rm{i}}_{\rm{3}}}{{\rm{O}}_{{\rm{10}}}}\quad ,$$
 $${\rm{S}}{{\rm{r}}_{\rm{3}}}{\rm{T}}{{\rm{i}}_{\rm{2}}}{{\rm{O}}_{\rm{7}}} + {\rm{SrTi}}{{\rm{O}}_{\rm{3}}} \to {\rm{S}}{{\rm{r}}_{\rm{4}}}{\rm{T}}{{\rm{i}}_{\rm{3}}}{{\rm{O}}_{{\rm{10}}}}\quad .$$
It was demonstrated that SrTiO3 is present in the final product if there is insufficient SrO during sintering. SrO is highly reactive and can easily react with atmospheric H2O and CO2. The direct addition of excess SrO to the raw materials does not enhance RP phase formation because SrO evaporates before it can react at high temperatures. However, SrO can be introduced at higher temperatures in the form of SrPbO3 and thus participate in the reactions in Eqs. (3) and (4) to form SPT.
Generally, PbO doping is beneficial for stabilizing the S3T and Sr4Ti3O10 RP phases. The final phase structure, either S3T or Sr4Ti3O10, is sensitive to the Sr:Ti ratio of the raw materials, which means that only the SPT-01 sample resulted in phase pure S3T. To ensure the initial Sr:Ti ratio of the RP phase, adding “excess” PbO is more effective than doping “stoichiometrically”.
C. Effect of atmosphere on the characteristics of sintered SPT samples
Since most of the oxide TE materials should be semiconducting under reducing atmospheres, it is necessary to investigate the characteristics of SPT samples sintered under different atmospheric conditions. Figure 6 shows XRD patterns of the SPT samples sintered in Ar at 1550 °C. It is interesting that only S3T exits in the (Sr0.99Pb0.01)3Ti2O7 composition (SPT-01), whereas Sr4Ti3O10 and SrTiO3 phases coexist in the rest of samples (Table IV).
XRD patterns of SPT samples sintered at 1550 °C in Ar.
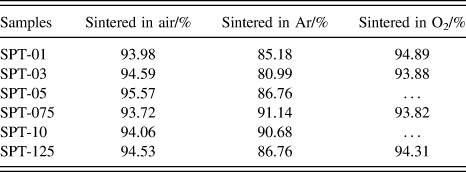
Effect of atmosphere on phase compositions of SPT samples sintered at 1550 °C.
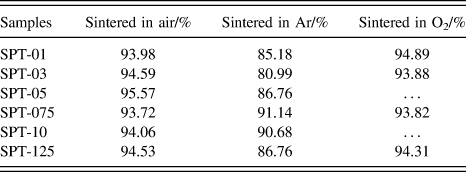
SPT samples sintered in air show a light brown color, while the samples sintered in argon are yellow and have much lower densities than those samples sintered in air. Most of the relative densities are less than 87% (Table V). Even when phase pure S3T was obtained in the calcined SPT-01 and SPT-03 powders, S3T phase was not stable through sintering. The percentage of S3T phase in the SPT-01 sample was 15.1%, which means that most of the S3T phase had transformed to Sr4Ti3O10 and SrTiO3 phases under the Ar atmosphere.
Effect of atmosphere on relative densities of SPT samples sintered at 1550 °C.
Another interesting phenomenon is that the center region and the surface of the sintered SPT samples (x ≥ 0.05) show different colors. For example, the color of the (Sr0.95Pb0.05)3Ti2O7 (SPT-05) sample changes from gray in center region to light brown, then changes to the yellow on the surface, as shown in Fig. 7(a). Figures 7(b) and 7(c) show the grain morphology of different positions in the SPT-05 sample. It is clear that the sample core has a homogeneous grain structure. There are fewer pores in the core than in the surface region, suggesting a relatively higher density in the core. The surface zone is composed of cubic grains which are interconnected. XRD of powder samples ground from the sintered sample and of the surface region shown in Fig. 8 indicate that two phases, Sr4Ti3O10 and SrTiO3, co-exist in the powder sample, while only SrTiO3 is observed in the surface region and that the cubic grains are SrTiO3.
Microstructure of (Sr0.95Pb0.05)3Ti2O7 (SPT-05) sample sintered at 1550 °C in Ar, (a) fracture surface, (b) morphology of the sample core (point +1) and (c) morphology of the sample surface (point +2).
XRD patterns of (Sr0.95Pb0.05)3Ti2O7 (SPT-05) samples sintered at 1550 °C in Ar.
Noguera et al. reported that the stability of the SrO(SrTiO3)n compounds is associated with phase segregation into SrTiO3 and SrO and with segregation into SrTiO3 and another phase of lower n value, as shown in Eqs. (6) and (7).Reference Noguera25 All segregation energies are very small, with positive values indicating an instability of the SrO(SrTiO3)n compound.
 $${\rm{SrO(SrTi}}{{\rm{O}}_{\rm{3}}}{{\rm{)}}_n} \to n{\rm{SrTi}}{{\rm{O}}_{\rm{3}}} + {\rm{SrO}} \uparrow \quad ,$$
 $${\rm{SrO(SrTi}}{{\rm{O}}_{\rm{3}}}{{\rm{)}}_n} \to {\rm{SrO(SrTi}}{{\rm{O}}_{\rm{3}}}{{\rm{)}}_{n - 1}} + {\rm{SrTi}}{{\rm{O}}_{\rm{3}}}\quad .$$
According to our experimental results, the phase decomposition of Sr4Ti3O10 into SrTiO3 and SrO vapor is reasonable, while the transformation from Sr4Ti3O10 to S3T requires further investigation. Since S3T is one of the most important phases in both the calcined powder and the air-sintered samples, it is believed that SrO vapor is the key to the formation of RP phase. This means that an Ar atmosphere will enhance the transformation from S3T to SrTiO3 and Sr4Ti3O10, as shown in the following equations:
 $${\rm{2S}}{{\rm{r}}_{\rm{3}}}{\rm{T}}{{\rm{i}}_{\rm{2}}}{{\rm{O}}_{\rm{7}}} \to {\rm{S}}{{\rm{r}}_{\rm{4}}}{\rm{T}}{{\rm{i}}_{\rm{3}}}{{\rm{O}}_{{\rm{10}}}} + {\rm{SrO}} \uparrow \quad ,$$
 $${\rm{S}}{{\rm{r}}_{\rm{4}}}{\rm{T}}{{\rm{i}}_{\rm{3}}}{{\rm{O}}_{{\rm{10}}}} \to 3{\rm{SrTi}}{{\rm{O}}_{\rm{3}}} + {\rm{SrO}} \uparrow \quad ,$$
since flowing Ar enhances decomposition of the RP phase. The decomposition occurs from the sample center towards the surface accompanied with the formation of gaseous SrO. A flowing Ar atmosphere not only lowers the oxygen partial pressure in the furnace, which will produce more oxygen defects in the lattice structure of the RP phase and weaken the bond strength, but also removes gaseous SrO and accelerates the decomposition reaction. This is the reason that the samples have low densities at the surface. It is deduced that the SrO(SrTiO3)n RP phase will fully transform to SrTiO3 if the sample is held at elevated temperature for a prolonged time.
McCarthy et al. investigated the phase equilibria of the Sr–Ti–O system and found that an amorphous white powder coated the furnace tube after sintering samples at 1375 °C in air. They supposed the deposit to be pure strontium metal.Reference Mccarthy, White and Roy28 If this is correct, the following reaction should occur during sintering.
 $${\rm{S}}{{\rm{r}}_{\rm{3}}}{\rm{T}}{{\rm{i}}_{\rm{2}}}{{\rm{O}}_{\rm{7}}}\buildrel { \ge 1300^\circ {\rm{C}}} \over \longrightarrow 2{\rm{SrTi}}{{\rm{O}}_{\rm{3}}} + {\rm{Sr}} \uparrow + {1 \over 2}{{\rm{O}}_{\rm{2}}} \uparrow \quad .$$
Since Strontium (Sr) is a highly reactive metal, it easily reacts with water to produce strontium hydroxide and hydrogen gas, and also burns in air to produce both strontium oxide and strontium nitride.Reference Lide29 However, we can deduce from the reaction in Eq. (10) that O2 is generated with the formation of metallic Sr. If the samples were sintered under an O2 atmosphere, the high oxygen partial pressure may reverse the reaction and constrain the decomposition of S3T.
Figure 9 shows XRD patterns of SPT samples sintered in O2. The results obtained do not support the formation of Sr metal. Both the SPT-01 and SPT-03 samples are composed of SrTiO3, S3T, and Sr4Ti3O10 phases, with Sr4Ti3O10 being the major phase. The SPT-125 sample is composed of SrTiO3 and Sr4Ti3O10 phases, similar to the sample sintered in Ar. The sample densities are much higher than those sintered in Ar, and are almost the same as those sintered in air, as shown in Table V.
XRD patterns of SPT samples sintered at 1550 °C in O2.
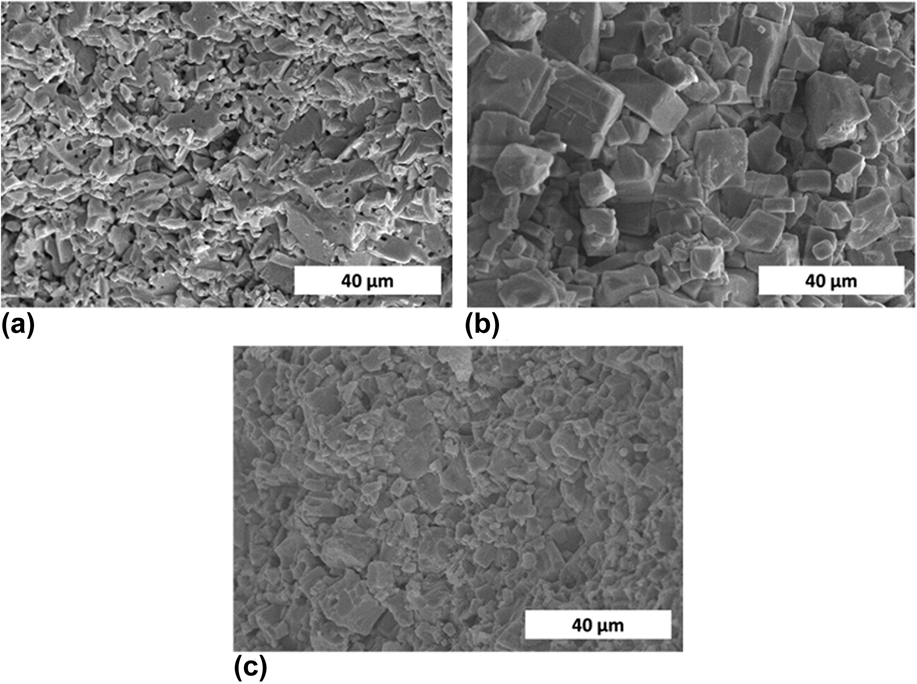
Because the SPT-01 sample sintered in air converted to pure S3T, it was chosen as the focus for a discussion on the phase transformation to the RP phase. Figure 10 shows that the microstructures of SPT-01 samples are strongly dependent on the sintering atmosphere. Equiaxed and plate-shape S3T grains coexist in the SPT-01 sample sintered in air, while 10–20 μm cubic SrTiO3 grains are observed in the more porous sample sintered in Ar. The sample sintered in O2 shows a homogeneously dense microstructure with clear grain boundaries. Some plate-like grains corresponding to the S3T or Sr4Ti3O10 RP phase can be observed together with the equiaxed SrTiO3 grains.
SEM micrographs of (Sr0.99Pb0.01)3Ti2O7 (SPT-01) samples sintered in (a) air, (b) Ar, and (c) O2 at 1550 °C.
The results above reveal that O2 does not constrain the decomposition of S3T during sintering. Compared with the calcined powder, single phase S3T cannot be obtained by sintering in either Ar or O2. Because flowing Ar and O2 can remove gaseous SrO from the furnace, sintering under these atmospheres enhances the decomposition of the RP phase. It is believed that the phase transition between the RP phases is a complex reversible process, meaning that SrO(SrTiO3)n compounds can phase separate into SrTiO3 and SrO, and SrO(SrTiO3)n phases with lower n value, SrO(SrTiO3)n−1, and these phases can react with SrTiO3 to produce SrO(SrTiO3)n again. Sintering atmosphere plays an important role in the above phase transformation. However, additional research is needed to understand the effect of atmosphere on low temperature reactions, the reduction in low or no oxygen sintering and the effect of oxygen pressure on the phase transition, the TE properties of the SPT samples, and the relationship between the SrO(SrTiO3)n RP phase composition and its TE properties.
IV. CONCLUSIONS
It is difficult to prepare phase pure S3T ceramics under conventional sintering conditions. Without PbO doping, S3T and SrTiO3 coexist and SrTiO3 is the main phase in the S3T ceramics. Rietveld refinement results show that an asymmetric lattice structure, especially Ti–O and Sr–O bond lengths and angles along the c-axis, contribute to the metastability of the S3T and Sr4Ti3O10 structures. The sintering atmosphere affects the phase transition and the microstructure significantly, with the key to the reactions being control of the evaporation of SrO from the SrO(SrTiO3)n phase. Flowing atmospheres of any composition impede sintering by removing volatile species and promoting further decomposition.
The phase transition between the RP phases is a complex circularly iterative process. SrO(SrTiO3)n RP phases in SPT samples are more stable than those without Pb2+. When the PbO doping amount x is less than 0.03, pure S3T phase can be obtained. The Sr4Ti3O10 phase was found to be the main phase in the SPT samples with x ≥ 0.075. The effect of Pb2+ on the phase structure can be described in two ways. On one hand, Pb2+ can stabilize SrO(SrTiO3)n RP phases through substitution for Sr2+ in the lattice, increasing the lattice parameters and decreasing lattice stresses in the RP phase. On the other hand, SrO can be stored in SrPbO3 and survive to higher temperatures. The decomposition of SrPbO3 can compensate for the loss of SrO involved in the RP phase, which enhances the formation of the SrO(SrTiO3)n phase.
Supplementary Material
To view supplementary material for this article, please visit http://dx.doi.org/10.1557/jmr.2016.164.
ACKNOWLEDGMENTS
The author would like to thank Nichole Wonderling from the Materials Characterization Lab in the Materials Research Institute at Penn State for Rietveld refinement discussions. Dr. F. Gao was supported by the Foundation of China Scholarship Council during his stay at The Pennsylvania State University.