


1. The Significance of Geodetic Measurements of Glacier Variations
The Würm Ice Age lasted some 120,000 yr. and finished only some 10,000 yr. ago. Today only the remains can be studied. But even today one-tenth of the land areas of the earth is still or again covered with ice and offers us the opportunity of studying in our times the course of this phenomenon and its relations to climatological changes while these are actually happening.
For the Alps we know from historical records that in the beginning of the seventeenth century the glaciers advanced and reached an extent larger than for many earlier centuries, perhaps millennia. This larger extent seems to have lasted with only secondary variations for almost two and a half centuries. The end of it had come by 1850–55. Since that time—or in some exceptional cases some years later—the many hundreds of glaciers in all parts of the Alps have been retreating and are still retreating.
In recent years more and more dates of glacier variations of all zones and regions—recessions prevailing—have become available. But for the large majority they only concern the variations of the terminus, that is the changing of the length of the glaciers. The figures of these length variations are valuable, as normally a large number of them indicate a clear general trend for a whole glacierized district, but the amounts of the single values vary too much for the various individual glaciers, to provide a mean figure significant for a larger geographic unit, and their second still more serious disadvantage consists in their rather complicated relation to the mass budget of the ice bodies.
Geodetic measurements of glacier variations should serve two purposes: first their results should state the phenomena in a numerical and comparable way and secondly they should contribute as much as possible to the elucidation of the reasons for the variations. For this latter purpose they will help most if their geometrical result is a simple function of the quantitative meteorological data, in this case of the balance of accumulation and ablation of the glacier concerned.
Among the geometrical measures of these variations the mean change Δh m of the surface level averaged for the whole glacier is the one which serves the two purposes best. The late Professor R. Finsterwalder has shown that for some ten glaciers in various parts of the eastern Alps and for some decades this Δh m does not vary much for the individual glaciers and therefore its mean ΔH m as the average of some typical and well distributed single glaciers is a rather representative figure for a whole geographic district such as the eastern Alps (Reference FinsterwalderFinsterwalder, 1953, Reference Finslerwalder1954). By multiplying Δh m by the more easily measured area S, we get the variation ΔV of the glacier’s volume. The exact relation is

where S is the smaller of the two areas S 1 and S 2 corresponding to the times t 1 and t 2 at which the geodetic measurements were taken, and h mΔS is the mean ice thickness over the area ΔS which has been added or lost in this time interval. The second term is generally much smaller than the first. In the case of Tunsbergdalsbreen it amounts to only 5 per cent of ΔV (1937–61). Therefore SΔh m approximately represents the variation in volume

The quantity Δh m and its mean ΔH m are also the most useful geometric quantities for the second purpose mentioned above. The relation between Δh i , the vertical change of surface level relative to a constant datum level measured by geodetic means such as photogrammetry, and the specific net budget for a given surface element i is given by the relation

where b is the local specific net budget at the surface as measured by stakes, i.e. is the accumulation c minus the ablation a, (a) is the lowering of the surface due to basal and internal ablation, (d) is the lowering of the surface due to changes of density with time, and z is the vertical movement of the former surface due solely to ice motion, i.e. the vertical movement which would occur if there were no ablation or accumulation. These quantities all refer to the same time interval t 2–t 1, generally several years long, and are usually divided by the interval so as to be expressed in units of millimetres per year or metres per year; the definitions are mainly according to Reference MeierMeier (1960, p. 20; Reference Meier1962, p. 254; Reference Meier and TangbornMeier and Tangborn, 1965, p. 558–65); the use of Δh follows that of Finsterwalder and Haefeli.
The neglect of (a) may be justified as its amount seems to be small compared with that of the surface ablation. The effect (d) of the change in density may be neglected for the ablation area, the density there being sufficiently constant near 0.91 g./cm.3. For the accumulation area the geodetic and the stake measurements need to be supplemented by the determination of the density of the upper layers—varying between 0.5 and 0.9 g./cm.3—in order to transfer their results into the comparable water-equivalent. To compare annual balances, only the differences in density at the times compared need be known. To a first approximation then,

While bi represents the balance of accumulation and ablation, the variation in ice thickness Δh i results as another balance, namely that of b i and the vertical component z i of the ice motion which tends to compensate the mass exchange b i between the glacier and its surroundings occurring through the surface.
For the whole glacier

where ρ is an average density transferring the volume variations of ice, firn, and snow into units of water-equivalent, and B is the water-equivalent net budget total.
Using (1a) we find

where Δh mw is the water-equivalent of Δh m.
As a first approximation the geodetic result Δh mw for the whole glacier corresponds to the mean specific net budget b defined as the total net budget B divided by the surface area S.
The same relation results from (2a): by assuming a constant volume (without accumulation and ablation according to the definition of z), and a constant area S, the summing of z over the whole area must be

and hence we get (3a).
An investigation of the correlations between the results of the geodetic and those of the meteorological measurements is being made at present, using the data for a series of years for certain Alpine glaciers. It may provide an empirical mean correction factor for transferring the volume changes into the water-equivalent and in this may render usable quite a lot of photogrammetric measurements of glacier variations already to hand for meteorological (net budget) conclusions. While detailed meteorological and hydrological analysis is necessary for the fundamental elucidation of the relations between climate and glaciers—providing the components of the mass balance b and the corresponding elements of the climate and of radiation —the photogrammetric measurements give Δh and hence the variation in the volume of the glaciers. Photogrammetry as a more extensive and summarizing method, may extend the meteorological results to the longer-term variations and to their geographical distribution on the Earth. A better knowledge of the climatological variations and their effect on glaciers requires a combined utilization of both methods. Equation (2) shows the contribution of the photogrammetric and that of the stakes measurements.
Theory and experience confirm that the firn regions of valley glaciers are changing their surface levels to a much smaller degree than the ablation areas. An unpublished investigation of the data of variations of ten typical east Alpine glaciers, which Finsterwalder and his school have collected, gave as a result that the measurements of the ablation areas alone would have been sufficient to deliver a figure representative for the glacier retreat in the eastern Alps. The values Δh ma (mean level change solely of the ablation area) for the single glaciers did not vary more than the Δh m of the whole areas. It is true that this result could only hold good for time period in which the changes were all in the same direction and for glaciers not too different in length. It cannot be valid if Δh has a turning point. As the ratios Δh ma/Δh m do not vary much for the ten observed glaciers, the means ΔH ma (for the glacierized eastern Alps) must correlate with the mean net budget b to the same degree as ΔH m itself does. As Ahlmann and Haefeli suggested, such a linear correlation should exist even for the amount of Δh f solely for the firn line. It should be possible to find an empirical relation for a first approximation of b deduced solely from ΔH ma or ΔH f.
Besides the measurements of the mean level variations and hence of the volumetric changes, measurements of the ice velocity provide useful data for the glaciers’ regime and its fluctuations.
When searching for a correlation between glacier variations and climatic fluctuations, it is most useful to extend such measurements to as many regions of the earth as possible. But repeating measurements in order to determine Δh for a somewhat longer period—reaching back some decades—is possible today only in a few places. It is one of R. Finsterwalder’s great merits that he mapped in an exact manner the glaciers of the mountain regions he visited during his expeditions and excursions. By his anticipation of the scientific recommendations of our day he has provided the present generation with some first surveys of whole glaciers or glacier tongues, which are now some 25 yr. old. These may now be used for measuring the changes. Besides the photogrammetric survey of the glacier state, he also in each case measured the ice velocities along transverse profiles.
In addition to his work in the eastern Alps Finsterwalder surveyed:
-
In 1928 Lednik Fedchenko with its affluents (Pamirs; north-west Tadzhikskaya Soviet Socialist Republic) (Reference FinsterwalderFinsterwalder, 1932);
-
In 1934 all the glaciers in the Nanga Parbat region (Punjab–Himalaya; then belonging to India) (Reference FinsterwalderFinsterwalder, 1938);
-
In 1937 some outlet glaciers of Jostedalsbreen in Norway, the largest glacierized area of continental Europe (Reference FinsterwalderFinsterwalder, 1951[a], Reference Finsterwalder[b]).
Meanwhile in all these regions his measurements have been repeated after 20 to 30 years:
-
The surveys of 1928 were repeated in 1958 (I.G.Y.) by a Soviet-German expedition organized by the Uzbekskaya Akademiya Nauk (Reference RegensburgerRegensburger, 1963). The results will be published in the Freiburger Forschungshefte.
-
The surveys of 1934 in the Nanga Parbat region were repeated
-
(a) for the Rakhiot Glacier, the most remarkable glacier on the northern side, in 1954 by Reference PillewizerPillewizer (1956),
-
(b) for the six glaciers of the eastern and southern side in 1958 (I.G.Y.) by W. Kick and F. Loewe. For a preliminary report see Reference KickKick (1962; [Union Géodésique et Géophysique Internationale], 1963, p. 96–98).
-
-
The surveys of 1937 in southern Norway were repeated for Nigardsbreen by O. Liestøl and co-workers from the Norsk Polarinstitutt in Oslo, by mapping this outlet glacier at 1 : 20,000 with contour intervals of 20 m. and including the whole drainage area, and especially surveying the lower part by photogrammetry every 2 yr. at 1:2,000 with 5 m. contour lines, and by repeating the velocity profiles of 1937 several times (personal communication from O. Liestøl). The tongue of Tunsbergdalsbreen, the second of the two most important glaciers surveyed in 1937, was resurveyed in 1961 by E. Dorrer and the author.
Each of these re-surveys showed a recession of all these glaciers and thus showed the same trend as all Alpine glaciers. The study in detail of the differences in the extent of the recession in connection with the peculiarities of the climate concerned, the type of glacier, etc., may contribute to a better understanding of the required correlations.
2. Tunsbergdalsbreen
The ice cap known as Jostedalsbreen in the south-west of Norway covers some 815 km.2, of which about 473 km.2 are still a connected area (Reference Hoel and WerenskioldHoel and Werenskiold, 1962, p. 44). The largest of its 26 outlet glaciers and hanging glaciers is Tunsbergdalsbreen. From its origin in the flat ice cap it has a length of 17 to 18 km., of which some 13 km. concern the tongue alone (Fig. 1). This tongue is on an average 1.6 km. broad. The accumulation area may only be estimated on the old 1 : 200,000 map to be some 33 km.2, the ablation area can be measured on the 1 : 25,000 map to be 21 km.2.
View of Tunsbergdalsbreen looking up-glacier from Brathay Group’s “Windermere Cairn”. Only Ye, Al and Ti are marked on the map. “Windermere Cairn” would be 2 cm. right of the N of the north arrow, 14 mm. south of 19A (x = 400,333.4; y = 57,909.0; A = 1,467.6m.)

Though somewhat more difficult to reach than the neighbouring glaciers, it has attracted the interest of glacier research since very early times. Investigations had already begun in the years between 1868 and 1870 when Seue used this very glacier for his general studies of ice motion (Reference HeimHeim, 1885, p. 143, 148, 158, 166, 170; Reference SeueSeue, 1870). Since then Norwegians, Englishmen, and Germans have done glaciological work at Tunsbergdalsbreen, a full bibliography of which is given by Reference Hoel and NorvikHoel and Norvik (1962). Because of this work which is going on it seemed desirable to extend the existing map of the middle part of the tongue of Tunsbergdalsbreen drawn up after the survey of Finsterwalder in 1937 (Reference FinsterwalderFinsterwaldcr, 1951 [a], Reference Finsterwalder[b]; Reference PillewizerPillewizer, 1952) to the whole length of the tongue, and at the same time to measure the variations for the period 1937–61.
Referring to the variations in length of the Jostedalsbreen outlet glaciers, Fægri in his report [1950] stated: “The curves of the shorter ones are less regular with greater extremes in both directions. Those of the longer ones are more consistent, especially that of Tunsbergdalsbreen, the longest one, which has advanced once only since measurements were started in 1907”. This statement made in 1948 can be extended up to the present day. In particular for the period here in question (1937–61) each annual measurement resulted in a negative variation of the terminus (Reference LiestølLiestøl, 1963). This regular behaviour makes Tunsbergdalsbreen most appropriate for long-term variation studies.
3. Mapping and Measuring the Variations of Tunsbergdalsbreen
In 1937 Tunsbergdalsbreen, Nigardsbreen and some other smaller outlet glaciers of Jostedalsbreen were surveyed by terrestrial stereophotogrammetry. In 1938 the whole Jostedalsbreen was to be surveyed by aerial photogrammetry by order of Norges Geografiske Oppmåling. However the large firn area proved to be too uniformly white at that season to give the stereo-effect necessary for the photogrammetric evaluation. It would have been necessary to mark the firn area in a similar way as the firn fields of the Grosser Aletschgletscher were marked on the occasion of its aerial survey in 1957. Recently Norges Geografiske Oppmåling has made a new aerial survey of the whole Jostedalsbreen, the results of which are not yet published. The re-survey of Tunsbergdalsbreen by terrestrial photogrammetry was done from 25 July to 1 August 1961, whereas in 1937 it was from 13 July to 18 July. The difference of 13 days within the ablation season may on an average cause too large values of the rate Δh of surface lowering. In the ablation area the error caused by neglecting this unknown effect is composed of the 13 days’ ablation minus the vertical component z of the ice motion (equation (2a)). As the mean daily ablation for the neighbouring Nigardsbreen at 750 m.a.s.l. in July 1962 proved to be 10 cm. (Reference Østrem and KarlénØstrem and Karlén, [1963], fig. 14, p. 182), the error is probably lower than 1 m., and its neglect in relation to the measured surface variations of −10 to −60 m. for the 24 yr. is justified.
For the full technical details of the survey see Reference Kick and DorrerKick and Dorrer (1964) where the coordinates and further data for future field work are published; only a summary is given here. For the triangulation it was a great advantage that the English Brathay Exploration Group had set up a series of 2 m. cairns well distributed round the glacier, which has saved us much field work. Dr. J. F. Nye, the adviser of the Group, will report on its glaciological work (see Appendix).
The accuracy of the very light phototheodolite TAF, giving the angles up to 1 centesimal minute, proved to be sufficient for the triangulation. The mean error for each of the triangulated points does not exceed ±1 m. within the local net of 1961. The position of this local net as a whole within the official survey net was found within ±4 m. The relative mean errors in the heights of the triangulated points lay between ±0.2 to ±0.6 m.; those of the absolute altitude came to about ±0.6 m.
In 1961 the four cairns of the two 1937 baselines could easily be found with the help of the foreground of the survey photographs of 1937. By this the advantage of terrestrial photogrammetry for measuring variations could be fully used: use of the same stations and same bearings for the photographs essentially improves the accuracy in comparison with aerial photogrammetry. At Tunsbergdalsbreen as at Nanga Parbat the 24 yr. old cairns of Finsterwalder have “survived” very well.
The four photogrammetric baselines of 1961 (Fig. 2) as well as the seven base lines of 1937 have been evaluated in 1963 at the Zeiss-Stereoautograph of the Institut für Photogrammetrie, Topographie und Allgemeine Kartographie of the Technische Hochschule München at 1 : 10,000 by E. Dorrer. The originals have been reduced to the scale of 1 : 25,000. The resulting map with the state of ice, snow and water in 1937 in blue, and with the state in 1961 in red, is enclosed with this paper.
Middle part of Tansbergdalsbreen 1961. In 1937 the side valley beyond the main glacier held the lake Brimkjelen. Copy of a photogrammetric glass plate; original size 13 × 18 cm.; focal length 16,228 cm. The one margin mark at the right side marks the horizon of the standpoint (1573.8 m.). Photographed on 28 July 1961 from the left standpoint of base line 20/1937 (20A on the map). The photographic axis is turned by 22° 30′ left from the normal to the base line
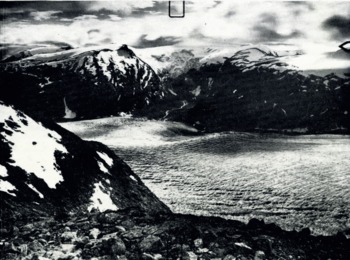
Unfortunately it is not possible to map the ice cap above the outlet glaciers by terrestrial photogrammetry, this ice cap not being towered over by rocks like the firn fields of the Alps. Moreover the forms of this old mountain range are not as well suited for terrestrial photogrammetry as those of the younger Alps. But had we had a few more days or better weather than in July 1961, it would easily have been possible to complete the survey of the tongue. At present some gaps still remain in the map. Nevertheless a study of the variations of the tongue remains possible.
Besides facilitating further glaciological work the purpose of the map is to represent the volumetric variations in a measurable manner. Furthermore the map should show the characteristic morphology of the side walls and the land below the terminus with various end moraines. P. J. Reference HowarthHowarth (unpublished) has written a thesis trying to date these moraines by comparing them with those of the neighbouring Nigardsbreen of which the dates of formation are known from historical records.
The mapped crevasses may give information about the stresses at the ice surface.
The method of measuring Δh from the map is described in the next section on p. 10.
4. The Variations
The most striking variation is the disappearance of Brimkjelen Sjø, which in 1937 measured about 800 m. in diameter and 0.48 km.2 in area. Its depth was 99 m. as can now be stated: in 1937 the water level was 858 m.a.s.l., and in 1961 the dry bottom measured 759 m. (red number on the map). 19.2 millions m.3 of water had filled this lake. Already between 1937 and 1938 the water surface had lowered considerably (Reference PillewizerPillewizer, 1952). In 1949 the lake finally disappeared (personal communication from G. Østrem). When breaking through the damming ice, the waters of Brimkjelen Sje will first be collected by the vast sandr-plain with the Tunsbcrgdals Vann (450 m.a.s.l.) and thus will not cause too much devastation. Literature on outbreaks of Brimkjelen Sjø, e.g. that of 6 August 1900, is listed in the bibliography of Norwegian glaciers (Reference Hoel and NorvikHoel and Norvik, 1962).
The variations of the location of the glacier snout are not represented on the map. They have been measured annually in relation to cairns by J. B. Rekstad, Oslo (1907–32), by Prof. K. Fægri, Bergen, and his assistants (1933–47), and (1948–61) with local assistance on behalf of the Norsk Polarinstitutt. For the period 1937–61, here in question, each of the annual measurements showed a recession. The sum of the single figures amounts to 430.5 m. Thus the length of the tongue decreased from 13.2 km. in 1937 to 12.8 km. in 1961. Beginning with 1937/38 the annual retreat in length in metres was: 10.5, 19.5, 19, 5, 5, 16, 18, 37, 17, 43, 23, 54, 23, 12.5, 17, 15.5, 20.5, 12, 10, 6, —, 5, 15, 27 (Reference FægriFægri, [1950]; Reference LiestølLiestøl, [1963] p. 188).
The annual rates of Δh t at the terminus—at present often almost equal to the net ablation, the velocity at the terminus being very small—could now be determined since

where the slope α of the ice surface in its state in 1937 is documented by the map, and the slope β of the bottom can now be measured in the field or taken from a new map surveyed by aerial photogrammetry in 1 : 50,000 in September 1964 by Widerøe, Norway (not yet published).
The loss ΔS in area for 1937–61 can only be estimated, the variations of the side margins being mapped only at some locations. For the margin at the terminus a plane-table sketch surveyed by the Brathay Exploration Group in 1957 has been used. Thus ΔS has been found to be about 1.5 × 10⁶ m.2, that is 7 per cent of the ablation area.
A remarkable variation figure is given by Reference RogstadRogstad (1951). In a hydrological study, using the varying ratio between the run-off in glacier rivers and the run-off in neighbouring rivers in the same general locality which are not fed by glaciers, for the period 1900–40 Rogstad computed an annual decrease of 0.4 m. of water-equivalent for the whole glacier mass of Jostedalsbreen. In section 5 this figure will be compared with a roughly corresponding figure for the eastern Alps.
The method and the results of determining Δh 1937–61
The horizontal shifts of the contour lines on the attached map contain the volumetric variation of Tunsbergdalsbreen from 1937 to 1961. In the case of the eastern Alpine glaciers Finsterwalder used these shifts and, by assuming the new slope to be sufficiently parallel to the former slope of the zone between the corresponding contour lines, computed the mean height variation of the surface level for each 100 m. zone, arising from the areas between the former and the new corresponding contour lines, measured by planimeter (Reference FinslerwalderFinsterwalder, 1954). This method is ideal for small variations occurring within a few years, but cannot be applied for such large variations as those of Tunsbergdalsbreen covering 24 yr. The assumption mentioned above is generally no longer valid, e.g. the former flat surface between the lines 875 and 900 in 1937 is in no way parallel to the steep descent of the ice fall between the same lines for 1961.
Therefore three longitudinal profiles have been constructed from the map, each showing the state in 1937 and that in 1961. One profile runs along the centre-line, the others some 400 m. distant on the left and right side. The heights have been drawn with a ten times larger scale than the distances (1: 2,500 cf. 1 : 25,000). The rates of the contour line shifts vary across the glacier in a sufficiently regular manner to justify their representation by these three longitudinal profiles. The vertical variations Δh have been obtained from the profiles at every horizontal distance of 250 m. The resulting three values for each transverse line have been averaged, giving the values along the centre-line double weight, as they represent a larger area. Finally the mean Δh for each 100 m. altitude zone has been determined.
The values of Δh for the surveyed region between the altitudes 800 and 1,600 m. form a remarkably regular, almost linear curve when plotted against altitude with a gradient of Δh/ΔA = −0.053/24 yr. = −0.0022/yr. (Fig. 3, Table II). Near the terminus the amount of shrinking is certainly more than 60 m. or more than 2.5 m./yr. Up-glacier it decreases. At the firn line near 1,500 m. it still reaches some 11 m./24 yr. or 0.46 m./yr. Owing to the reasons mentioned the variations of the ice cap in the accumulation area could not be measured, but the surveyed area reaches well up to the rim of the ice cap and the longitudinal profile provides the (negative) gradient of Δh at that location. Thus it can be deduced that for 1937–61 the surface of the ice cap dropped less than 0.4 m./yr. As Rogstad’s value of 0.4 m./yr. refers to the whole glacier mass, the ice cap alone had also for 1900–40 shrunk much less than 0.4 m./yr., as the rate Δh mc solely for the accumulation area generally is smaller than half the rate Δh m for the whole glacier. For seven east Alpine glaciers the average ratio Δh mc/Δh m was 0.47, whilst the ratio Δh ma/Δh m for the ablation areas was 1.83 (these figures computed from Reference FinsterwalderFinsterwalder’s data (1953)).
Four quantities as functions of the altitude:
(1) The geodetically measured surface-level variation Δh at Tunsbergdalsbreen, period 1937–61.
(2) Its comparison with ΔHA′, the mean for ten east Alpine glaciers, period 1920–50; the latter curve (Reference FinsterwalderFinsterwalder, 1953, fig. 4) is shifted by the altitude difference of 1,350 m., by which the firn line in the Alps is higher.
(3) Configuration of the net budget curve b : b Turnsbergdalsbre 1959–60 (Reference MaddeverMaddever 1961); b, Nigardsbre 1961–63 (Reference Østrem and KarlénØStrem and Karlén, 1963; Reference Østrem and LiestolØstrem and Liestal, 1964[b]).
(4) The vertical component z = Δh−b of the ice motion. As data from different glaciers are used this curve is realistic in its general shape only.

In some rather rare cases the lines of equal surface lowering Δh form ellipses on the map with their long axes approximately parallel to the general direction of flow. More often these isolines are drawn apart again in the direction of flow. Corresponding to this distribution of isolines a graph of Δh values along the centre-line or lines parallel to it form waves, but these waves are smooth and with only small amplitude. For successive horizontal distances of 250 m. along the centre-line up the glacier starting at 800 m.a.s.l. the following negative values of Δh in metres were found in 1961:
-
59, 53, 50, 45, 40, 36, 44, 42, 42, 36, 41, 44, 41, 36,…,
and upwards from 1,100 m.:
-
34, 33, 33, 32, 31, 32, 33, 32, 31, 30, 29, 26, 25, 19, 19, 15, 13, 11, 9, 9,….
The averaging of the three values at a given transverse line makes these waves disappear.
The series of these means each representing a large part of the glacier breadth, form the aforementioned almost linear curve (Fig. 3).
Furthermore the map shows that the lower of the two side glaciers at the right, the one above the former lake Brimkjelen, lost some 50 m./24 yr. between altitudes of about 900 and 1,100 m., and the upper one some 25 m. at between altitudes 1,200 to 1,300 m. Thus the losses are of the same order of magnitude as those of the trunk stream at the same altitudes. The rates of the surface lowering have been rather similar for the same altitudes all over the Tunsbergdal region. Quite obviously they depend on the altitude above sea-level or on the altitude distance from the firn line.
The amounts of Δh measured for the period 1937–61 would be of less use if within the 24 yr. the trend had changed from decreasing to increasing. Then the period would have been too long to interpret the variations. But in the case of Tunsbergdalsbreen we know from the annual measurements of the variations in length that the period was one of continuous recession and that turning points did not happen.
For the tongue the variation of the volume has been computed for each mapped 100 m. height zone, and estimated for the unmapped zones according to

The result was a loss of 787 × 106 m.3 of ice in the course of 24 yr., or an average annual loss of 30×106 m.3 of water, or, for comparison, in every year 1.6 times the amount of water in Brimkjelen Sjø in its state of 1937. These annual water masses of the glacier retreat fed the draining Tunsberg Elv in addition to the annual precipitation.
The mean surface lowering of the ablation zone alone has been computed from

the average shrinking for one year being −1.45 m. of water-equivalent.
5. Comparison of the Variations with those of Alpine Glaciers
The gradient of the altitude variation of Δh at the ablation area
The previously mentioned nearly linear function, valid for the ablation area, may be given as

where Δh A is the surface-level variation at the altitude A and ΔA = A−A 0 where A 0 is a datum altitude.
If we use the firn line, as this datum altitude A 0 (for this purpose the difference from the equilibrium line is unimportant), we may compare the result for Tunsbergdalsbreen, period 1937–61, with that for the eastern Alps averaged for ten glaciers, unfortunately at present available for the period 1920–50 only:

where the firn line of Tunsbergdalsbreen is supposed to be near 1,500 m. and that of the east Alpine glaciers near 2,850 m. The equation (4a) referring to the eastern Alps is a linearization of Finsterwalder’s parabola (Reference FinsterwalderFinsterwalder, 1953, fig. 4) and is a good approximation for a range of some 700 m. in altitude (from 2,200 to 2,900 m.a.s.l.), for which it is compared with the results of Tunsbergdalsbreen (from 850 to 1,550 m.a.s.l.). For a larger extension Reference FinsterwalderFinsterwalder (1953, p. 210 and fig. 4) found the parabola

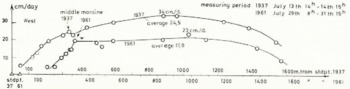
Temporary velocity transverse profile 1937 and 1961. Scale of the daily movement is 1,000 times the scale of the glacier breadth or of the distance from the fixed points. Even neglecting the particular velocity value at the middle moraine, the configuration of the 1961 curve towards the western border had changed to that of a Blockschollen movement
where the datum altitude is located by some 600 m. above the equilibrium line.
The comparison of equations (4a) shows that the gradient of the altitude variation of Δh in the ablation area is very nearly the same in the Alps as for the large and representative Tunsbergdalsbreen in Norway. Probably this conformity is primarily caused by a uniform regularity in the altitude variation of the ablation on which Haefeli has published an important paper (1962).
The mean surface-level variations
Some earlier data
As mentioned in section 4, for the period 1900–40 Jostedalsbreen, which includes Tunsbergdalsbreen, had decreased on an average by 0.4 m. of water equivalent annually (Reference RogstadRogstad, 1951). This value agrees well with the data for the eastern Alps which Finsterwalder gives: For 1890 to 1920 −0.30 m./yr. and for 1920 to 1950−0.61 m./yr. of ice (Reference FinsterwalderFinsterwalder, 1953; Reference Finsterwalder1961, p. 326); thus for Rogstad’s time period 1900–40 Finsterwalder reports nearly the same rate, namely −0.45 m./yr. of water equivalent. Though it is not quite correct to interpolate such an average value, the result at least proves a parallel trend apparently of the same order of magnitude. For the western Alps some data for the Grosser Aletschgletscher seem to confirm that large single glaciers with rather regular forms, or the average of several typical glaciers, are apparently responding to the same climatic trends by similar mean surface-level variation Δh m or similar values of net budget b (equation (3a)). At a point near the firn line, and therefore at a representative location of the Grosser Aletschgletscher, the lowering of the surface from 1851 to 1947 amounted to 0.54 m./yr. of ice (Reference HaefeliHaefeli, 1955–56, p.9). Now exact mapping has provided the average rate of shrinking of the whole Aletsch surface for the period 1926 to 1957 as 0.53 m./yr. of ice (Reference KasserKasser, 1961, p. 221), a value very near to the corresponding figure for the means for the eastern Alps (0.50 m./yr. of ice as interpolated from 0.61 for 1920–50 and 0.13 for 1950–59).
Comparison of the results from Tunsbergdalsbreen 1937–61 with the data from Alpine glaciers and Werenskioldbreen, Vestspitsbergen
The value of ΔH ma solely for the ablation areas, averaged for eight typical glaciers of the eastern Alps for the period 1920–50 is −1.12 m./yr. ±0.07 m./yr. of ice (computed from the data in Reference FinsterwalderFinsterwalder (1953)). The amount of ΔH m for the whole glacier areas decreased from −0.61 m. /yr. for 1920–50 to −0.13 m./yr. for 1950–59 (Reference FinsterwalderFinsterwalder, 1961, p. 331), though an assistant of Finsterwalder has recently told me that a new computation would come to a loss of more than 0.13 m./yr. Thus in reality the amount of the ΔH m for 1937–59 would be something larger than the result of the interpolation

As the rate of the local Δh is a function of the altitude, the mean Δh ma for the ablation area also depends on the altitude extension of this area. Therefore the only figures of Δh a which are comparable, are those which belong either to glacier tongues of a similar vertical extension or to corresponding altitude zones counted from the firn line. The values of ΔH ma used above for the Alpine glaciers on the average refer to six 100 m. zones below the equilibrium line. If we confine Δh (ma) for Tunsbergdalsbreen also to the first six 100 m. zones below its firn line, i.e. from 1,500 to 900 m., its value naturally gets smaller, namely −1.26 m./yr. of ice, or −1.15 m./yr. of water.
There is still a simpler substitution of the Δh m of the whole glacier area: Reference AhlmannAhlmann (1948, p. 56) and Reference HaefeliHaefeli (1955–56, p. 9) suggest the use of the Δh f at the firn line as a representative figure for the whole glacier variation. For Tunsbergdalsbreen this height variation, for the region near 1,500 m., amounts to −12 m. for 1937–61, or −0.50 m./yr. of ice, or −0.45 m./yr. of water. For eight east Alpine glaciers for 1920–50 ΔH f was −0.53 m./yr.; for the period 1937–59 it may be deduced in the same manner as for ΔH m to be −0.36 m./yr. of ice or −0.33 m./yr. of water.
For Werenskioldbreen in Vestspitsbergen the height variation at the firn line (near 300 m.a.s.l,) was about −1.45 m./yr. of ice or −1.32 m./yr. of water for the period 1936–58, covering 88 per cent of the measuring period for Tunsbergdalsbreen (Reference KosibaKosiba, 1960, table II , p. 17).
Mean variations of surface levels in m./yr. of water-Equivalent
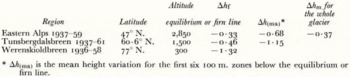
For Tunsbergdalsbreen the deficit or negative budget −Δh of the mass balance on the one hand and the ice motion on the other was 1.7 times larger than that of the east Alpine glaciers, as given by Δh (ma), or 1.4 times as given by Δh f. The corresponding value for Werenskioldbreen is again more than twice as large as that of Tunsbergdalsbreen. These comparisons partly need more detailed investigation during single budget years, and partly further investigation of longer-term variations so that short period influences cannot hide an overall large-scale correlation.
6. The Numerical Relations Between Altitude, Δh, b and z
Table II and Figure 3 show the geodetically measured rates of the surface lowering Δh related to the corresponding altitudes of Tunsbergdalsbreen. As previously mentioned Δh is a balance figure, resulting from the two counter motions b and z. As all these elements are functions of the altitude, they may be compared in a diagram (Fig. 3) referred to the altitudes. Unfortunately this cannot be done with values for Tunsbergdalsbreen itself and not for the same period. But the available figures of the net budget curve for the neighbouring Nigardsbreen averaged for the two budget years 1961–63 (Reference Østrem and KarlénØstrem and Karlén, [1963]; Reference Østrem and LiestølØstrem and Liestal, 1964[a], p. 5) seem to be plausible rates and not extreme values. At least the configuration of the curve may be confirmed by the values of b for Tunsbergdalsbreen in 1959/60 (Maddever, unpublished) in Figure 3. Hence the differences Δh−b provide a possible curve, likely to be at least of the right average slope, for the altitude variations of the vertical components z of the annual ice motion (equation (2a) with the mentioned assumptions).
VARIATION OF HEIGHT CHANGES, BUDGET AND VERTICAL ]V[OVEMENT WITH ALTITUDE
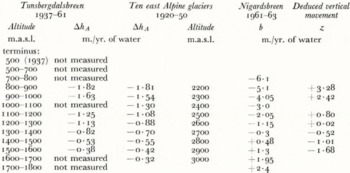
The “ablation gradient” a = ΔA/ΔH of Reference HaefeliHaefeli (1962) is, in the terms and symbols of this paper, the net budget gradient Δb/ΔA. For Nigardsbreen, the glacier near to Tunsbergdalsbreen, the average of this gradient for two budget years was +0.0085 (Table II), whereas the figures for the Grosser Aletschgletscher and of two American glaciers (lat. 46° to 47° N.), cited by Reference HaefeliHaefeli (1962, p. 52) are +0.0099, and +0.0108 respectively.
The marginal sketch in Figure 3 shows that the vertical component of the ice movement is

For a sufficiently flat surface slope

where v is the scalar magnitude of the velocity vector of a particle of ice (m./yr.), ψ is the angle of the velocity vector measured from the surface slope (Kriechwinkel β in Reference HaefeliHaefeli (1955–56), p. 5) so that

where ξ is the slope of the velocity vector measured from the horizontal and α is the slope of the surface.
For the ablation area the net budget b is negative and increasing with decreasing altitude or with increasing distance x from the firn line. Therefore according to (2a) the vertical component z of the ice movement must be positive and must increase with increasing distance from the firn line. By differentiating equation (5a) the gradient of z is given by

where

All quantities in this equation are measurable and thus could be checked along a longitudinal profile by combining geodetic and stake measurements. The velocities v for one year observation periods and the strain-rates have already been measured at Tunsbergdalsbreen by the Brathay Group since 1957/58. At the tongue v ranged between 73 and 153 m./yr. for 1959/60 and the strain-rate for 1957–60 between 0 and −0.030 yr.−1 with increasing negative rate (compression) towards the terminus. For a large part of the longitudinal profile dz/dx ≈ sin α Δz/ΔA = 0.0081 × 0.51 = 0.00041yr.−1.
For laminar flow the velocity vector is nearly parallel to the bottom slope β, so

The equations (5a), (6), (7) provide important relations for a mathematical description of the surface longitudinal profile, but the configuration given by them varies with time due to the kinematic waves continuously running down-glacier.
7. The Transverse Velocity Profile 1937 and 1961
The method of measuring the ice velocity by terrestrial photogrammetry has been briefly described in this Journal (Reference FinslerwalderFinsterwalder, 1954). Its advantage consists in providing quite a lot of data and in giving the opportunity for checking all results afterwards and for measuring additional data from the photographs at any later time.
In 1961 we did not succeed in finding exactly the same location again; the cairns of the two stations probably having been destroyed by avalanches. We therefore measured as near to the 1937 profile as we could estimate. Subsequent evaluation of the field work showed that the profile of 1961 was situated 50 m. further down glacier. The surface slope of the 1961 profile was 10 per cent steeper than that of the 1937 profile (α 1937 = 0.091).
The ice thickness at the location of the profiles changed on an average by Δh = −45 m./24 yr. An estimate of the thickness h itself might be attempted by using the following relation:
The ice discharge q through the vertical cross-section of the profile must be the same as the discharge through the surface S t between the profile and the terminus

The area of the cross-section is

where v is the annual movement averaged for the vertical area A. Then the average thickness is

where w is the width.
The available data, however, are not adequate. Estimated figures for the average annual budget and for the annual flow velocity over the cross-section are not reliable enough to yield a meaningful value for the thickness.
The maximum of the temporary velocity, near the centre-line, had decreased from 34 cm./day in 1937 (13/14 July) to 23 cm./day in 1961 (29/31 July) that is by 32 per cent. The Brathay Group measured at about the same location an annual velocity of 120 m. for 1959/60 or 33 cm./day. The average value for the whole transverse profile (area of the velocity profile divided by the breadth) decreased from 24.5 cm./day in 1937 to 17.0 cm./day in 1961, that is by 31 per cent.
The weather at the time of the survey in 1937 was outstandingly good. More melt water may have been running than in 1961 when we had particularly cloudy and rainy weather. Normally the rain water does not reach anywhere near the quantity of melt water on sunny days. More water penetrating to the glacier bed may have had an increasing effect on the velocity in 1937.
The velocity profile of 1937 for Tunsbergdalsbreen has become a prototype for a streaming glacier. The variation of the velocity rates along the transverse line has had the distinct parabolic form as in the case of viscous liquids, typical for slowly flowing valley glaciers (Reference PillewizerPillewizer, 1950, Reference Pillewizer1952). On the left half of the glacier the velocity curve remained in this same configuration in 1961. But on the right side (left in Fig. 4) the form had changed and had become that of a glacier with Blockschollen-movement. For this mode of flow the gradient of the velocity at a small margin zone is very great whereas the largest part of the profile is moving as a solid unit. This change in the profile form from 1937 to 1961 is the more remarkable as the velocity had decreased by 31 per cent. Obviously the two modes of flow do not only depend on the amount of the velocity nor only on the relation of the velocity to the breadth. Stress conditions caused by other reasons also influence the mode of flow.
Appendix Work on Tunsbergdalsbreen by the Brathay Exploration Group
By M. C. L. Herring, P. J. Howarth, R. J. Lorimer, R. S. Maddever, J. F., Nye A. B. Ware and D. C. Willatts
It may be useful to add that glaciological work has been carried out on Tunsbergdalsbreen by parties of the Brathay Exploration Group each summer since 1956 under the leadership of G. de Boer, W. G. Jenkins, R. J. Lorimer, R. S. Maddever, H. H. Mills, A. B. Ware and G. T. Wright. The main purpose has been to provide training for the boys involved. The primary scientific task was to measure the longitudinal strain-rate down the glacier by repeated annual surveys of a longitudinal line of markers. This has now been done for seven successive years. The line extended for almost the whole length of the tongue (8 km.) and attempts were made to extend it into the firn region. Measurements of the horizontal component of velocity, of surface slope, and hence of longitudinal surface curvature have also been made with a view to testing correlations with longitudinal strain-rate suggested by theory. The results of these and other measurements on the glacier will be reported later.



