Nomenclature
Symbols
-
 $a$
-
Local speed of sound
-
${c_{r}}$
-
Reference chord
-
${f_{i}}$
-
Variables in equation (4.4)
-
$l$
-
Characteristic length
-
$t$
-
Time variable
-
$u, v$
-
Velocity components
-
${u_{\infty}}$
-
Far field velocity component
-
$x, y, z$
-
Cartesian coordinates
-
$A$
-
Equation coefficient
-
$D, C$
-
Coefficients in boundary conditions
-
$F, G, H$
-
Coefficients in potential equation
-
$M$
-
Local Mach number
-
${M_{\infty}}$
-
Free stream Mach number
-
${U_{\infty}}$
-
Free stream velocity
-
$\beta$
-
Supersonic flow parameter or Mach cone angle,
${\sqrt{1-{{M}^{2}}}}$
-
$\phi$
-
Velocity potentials
-
$\gamma$
-
Ratio of specific heats
-
$\xi,\eta,\zeta$
-
Computational coordinates
-
$\tau$
-
Non-dimensional time variable


1. Introduction
The importance of unsteady transonic flows stems from the fact that a knowledge of the entire flow field is essential to predict the unsteady pressure distributions, forces and moments acting on an aircraft in flight near the speed of sound. This in turn is particular important as in this flow regime, there is always an increased possibility of the occurrence of an aeroelastic instability such as flutter or wing divergence within the flight envelope of the aircraft. This is due to a substantial increase in the non-conservative loads resulting in what is known commonly as the phenomenon of the transonic dip. Most modern commercial aircraft fly at a cruise speed just under the local speed of sound and for this reason, the estimation of the aeroelastic instability speeds is critical to ensure that the aircraft does not exhibit the instabilities within the flight envelope of the aircraft. Thus, the prediction of unsteady transonic flows, the unsteady pressure distributions, forces and moments acting on an aircraft is vital.
The equations governing transonic flows are fundamentally nonlinear, both in steady and unsteady flows. For this reason is convenient to adopt a computational approach in the prediction of transonic flow fields. In a landmark review of the field, Jameson [Reference Jameson1], identified four classes of methods based on boundary integral equations, transonic potential flows, the Euler equations modelling the flows and viscous flow models based on the Navier-Stokes equations. In the unsteady computations for aeroelastic applications, following the prediction of the unsteady forces acting on the elastic lifting surfaces, further computations of their responses must be carried out based on their structural dynamics. For this reason transonic potential flow-based methods and, in particular, methods based on the transonic small disturbance equations are often adopted to reduce the vast amount of computations that must be done to predict a flutter or divergence speed.
In this paper, the prediction of the unsteady flow field over typical high AR wings in the transonic flow regime but below the sonic Mach number is of particular interest. The prediction of the velocity potential, the pressure field and the lift and the induced drag of high AR wings is successfully undertaken. The methodology adopted is a computational approach based on the transonic small disturbance unsteady potential equation. The method was first validated by applying it to NASA’s common research model (CRM) wing, the AGARD 445.6 wing model and the ONERA M6 wing. In order to avoid any difficulties due to the inherent instabilities and uniqueness of the solutions in the flow regime of interest, the flow field and its features are first computed for a typical high AR wing, which is of a much lower AR than a similar planform as the wing under consideration. The wing is then gradually morphed, increasing its AR in small increments, so in the end the AR of the planform and its shape are that of the wing under consideration. The morphing is done only in the spanwise direction, thus maintaining the essential geometry of the section along the chord. This process allows one to use the converged solutions obtained for a particular AR as the starting solutions for the cycle of iterations corresponding to slightly higher AR wings. For this reason, the solutions for a particular AR are also relative fast, thereby facilitating the relatively fast further calculations of flutter speeds, if need be. It is shown that the higher AR wings generally have a higher lift coefficient as well as a higher lift to drag ratio. With NASA’s common research model (CRM) wing, there is an increase in maximum lift with increasing AR while the induced drag is almost the same. There is also an optimum sweep angle, which is different for each angle-of-attack so that variable sweep lifting surfaces may be designed to provide optimum solutions. The computed flutter speeds indicate a reduction with increasing aspect ratio.
2. Computational approaches to unsteady transonic flows
Before considering the application of unsteady potential flow theory to transonic flows, we shall briefly reconsider the methods that have evolved for the calculation of unsteady transonic flow fields, which may be primarily classified as boundary integral or panel methods, transonic potential flows, methods based on the Euler equations and methods based on the Navier Stokes equations. The panel methods are based on the linearized potential flow equations and are therefore valid only in a restricted flow regime. Most popular of these have been solutions based on a superposition of a distribution sources, doublets or vortices on the internal boundaries of the flow, namely the surface of aircraft’s fuselage, wings and/or control surfaces. Thus, their validity is mostly limited to Mach numbers far away from the critical sonic Mach number. The transonic potential flows involve the use of the full nonlinear potential flow equations or some simplified version of it where only the principal contributions are retained. As superposition is no longer valid, the nonlinear potential flow equation is solved by applying a computational technique of over the whole flow field or some truncated portion of it. The Euler equation approach is based on solving the complete set of flow field equations including the scalar continuity, the vector momentum and the scalar energy equations as a coupled set of equations. When applied to steady flows, there is a major advantage, as one does not need to distinguish between the numerical instabilities and physical instabilities, as most often the existence of steady solution implies that the physical instabilities are absent. In the case of unsteady flows, one cannot make such an assumption as instabilities such as flutter can exist, and one must necessarily differentiate between numerically induced instabilities or spuriously generated solutions and physically present instabilities. Moreover, since one is dealing with conservation laws, there is absence of dissipative terms. This situation is remedied by adding artificial dissipation or by considering the properties of conservation equations that led to the concepts of total variation diminishing of flux related quantity that can never increase and of flux limiting. Further in the case of three dimensions, when both forward and backward moving wave solutions are present one resorts to one of several flux-vector splitting schemes. The problem of dealing with spuriously generated solutions was dealt with by using specially constructed time stepping schemes and multiple grids. Thus, the methods based on the Euler equations were able to predict the shock waves that are present in unsteady transonic flows. Methods based on the numerical solution of the Navier stokes equation were able to predict the effects of the boundary layers on the flow field as well as the interaction between the shock waves and the boundary layers.
3. Transonic potential flow calculations
The approach based on transonic potential flow calculations is undoubted a much more simplified approach because of the need to generally deal with just one single partial differential equation. Yet the challenge has been to generate some of the key features that could be predicted by the preceding two approaches based on the Euler and Navier-Stokes equations.
For flows where the local Mach number exceed the critical Mach number, flow field may change locally from subsonic to supersonic and this often results in the appearance of shock waves, which generally strike the aerofoils curved surface and form a barrier between the trailing and leading edges of the aerofoil. Moreover, potential flows are isentropic flows and shock waves generate entropy. The steady lift of the aerofoil is significantly reduced, the drag increases and the pitching moment varies nonlinearly with angle-of-attack. Furthermore, the unsteady variations of the lift increase, and consequently there is a lowering of the flutter speed. Transonic potential flow-based methods are expected to predict all of these effects, and they must be suitably modified to generate the entropy-related effects of weak shock waves.
The full potential equation, can be derived from the Euler equations assuming adiabatic irrotational flow. In two dimensions,
 \begin{align}{\phi _{tt}} + 2u{\phi _{xt}} + 2v{\phi _{yt}} = \left( {{a^2} - {u^2}} \right){\phi _{xx}} - 2uv{\phi _{xy}} + \left( {{a^2} - {v^2}} \right){\phi _{yy}}.\end{align}
where the velocity vector is described by a potential through
 \begin{align}\left( {u,v} \right) = \nabla \phi,\end{align}
 $a$
is the local sound speed and subscripts
 $t$
,
 $x$
and
 $y$
denote the temporal and spatial partial derivatives. Simplification of the above system can be made by assuming a uniform flow with small disturbances superimposed on it. Assuming only small disturbances so
 $\phi $
is replaced by
 ${u_\infty }\left( {x + \phi } \right)$
, has the further benefit of eliminating the need for fluid mesh deformation to accommodate changes in the solid boundary geometry. By approximating the speed of sound, Equation (1) is linearised, retaining only the nonlinear term of the form
 ${\phi _x}{\phi _{xx}}$
as it is known to be relatively large near shocks. This implies that no account is made of shock components in the other direction, which is important to our implementation for high AR wings. The equation is brought into non-dimensional form by scaling the time variable by
 $l/a$
and spatial variables by
 $l$
, where
 $l$
is a characteristic length, which is usually chosen to be the root chord
 ${c_r}$
. The Equation (1) is reduced to
 \begin{align}{\phi _{tt}} + 2{M_\infty }{\phi _{xt}} = A{\phi _{xx}} + {\phi _{yy}}.\end{align}
where
 ${M_\infty }$
is the freestream Mach number and
 $A$
is a non-constant coefficient given by
 \begin{align}A = 1 - M_\infty ^2\left( {1 + \left( {\gamma + 1} \right){\phi _x}} \right)\!.\end{align}
The Equation (3) is nonlinear. Methods of transonic potential flow analysis have been developed based on both the full potential Equation (1) as well as on Equation (3). The latter class of methods are said to be based on transonic small disturbance (TSD) unsteady potential flow model.
4. Unsteady transonic small disturbance analysis
If one assumes small disturbances and a Mach number close to unity, the potential equation can be reduced to the steady transonic small disturbance equation in two-dimensions given by
 \begin{align}\left( {1 - M_\infty ^2 - \left( {\gamma + 1} \right)M_\infty ^2{\phi _x}} \right){\phi _{xx}} + {\phi _{yy}} = 0.\end{align}
If the free stream Mach number is not close to unity, the potential flow equation can be linearised as
 \begin{align}\nonumber\\[-25pt] \left( {1 - M_\infty ^2} \right){\phi _{xx}} + {\phi _{yy}} = 0.\end{align}
Murman and Cole [Reference Murman and Cole2] published a landmark paper to demonstrate a simple way to obtain the physically relevant solutions to the transonic small disturbance Equation (5). Writing Equation (5) as
 \begin{align}A{\phi _{xx}} + {\phi _{yy}} = 0,\end{align}
where
 $A$
is the nonlinear coefficient in the steady two-dimensional TSD equation, Murman and Cole [Reference Murman and Cole2] proposed the use of central differencing if
 $A \gt 0$
(subsonic flow), but upwind differencing (backward in the direction of flow) for
 ${\phi _{xx}}$
if
 $A \lt 0$
(supersonic flow). The ability to switch from a central to an upwind differencing scheme facilitated the analysis of nonlinear transonic flow, including shock waves.
In general three-dimensional flow, the unsteady potential function can be written in conservation form as
 \begin{align}\frac{{\partial {f_0}}}{{\partial \tau }} + \frac{{\partial {f_1}}}{{\partial {x^ * }}} + \frac{{\partial {f_2}}}{{\partial {y^ * }}} + \frac{{\partial {f_3}}}{{\partial {z^ * }}} = 0,\end{align}
where
 \begin{align}{f_0} = - {M^2}\left( {{\phi _\tau } + 2{\phi _{{x^ * }}}} \right)\!,\,{f_1} = \left( {1 - {M^2}} \right){\phi _{{x^ * }}} + F\phi _{{x^ * }}^2 + G\phi _{{y^ * }}^2,\,{f_2} = {\phi _{{y^ * }}} + H{\phi _{{x^ * }}}{\phi _{{y^ * }}},\,{f_3} = {\phi _{{z^ * }}}.\end{align}
In the Equation (9), the coefficients F, G and H are respectively given by
 \begin{align}F &= - \left( {\gamma + 1} \right)M^{2}/2,\,G = \left( {\gamma - 3} \right)M^{2}/2 \nonumber\\[3pt] H &= - \left( {\gamma - 1} \right){M^2}.\end{align}
where
 $M = {M_\infty }$
. Furthermore,
 \begin{align}{x^ * } = x/{c_r},\,{y^ * } = y/{c_r},\,{z^ * } = z/{c_r},\,\,\tau = t{U_\infty }/{c_r},\end{align}
There are alternative coefficients that could be used for the coefficients F, G and H.
The unsteady TSD equation is solved numerically on a finite-difference (FD) grid in a computational coordinate system (
 $\xi = \xi \left( {x,y} \right)$
,
 $\eta = y$
and
 $\zeta = z$
). The FD grids in both the physical and computational domains are contained within rectangular boundaries and conform to the leading and trailing edges of the horizontal lifting surfaces. Regions in the physical domain are mapped into rectangular regions in the computational domain using shearing transformations. The unsteady TSD potential equation is transformed to the computational domain using the modified shear transformation.
The flow tangency boundary conditions are imposed along the mean plane of the respective lifting surfaces, and the wakes are assumed to be planar extensions from the trailing edges to the downstream boundary of the FD grid. For unsteady applications, the far field boundary conditions can have a significant influence on the accuracy of the solution. Steady-state boundary conditions are inadequate for unsteady calculations, since disturbances reaching the boundaries are reflected back into the computational domain. Non-reflecting boundary conditions are implemented in the TSD codes. The boundary conditions are summarised in Table 1.
The applicable boundary conditions

In Table 1, the coefficients
 $\beta $
, D and C, are given by
 \begin{align}\beta &= \sqrt {{M^2} - 1} ,\,\,D = M\sqrt {1 + {M^2}/\left( {2F{\phi _x} - {\beta ^2}} \right)}, \nonumber\\ C &= \left( {D\sqrt {\left( {2F{\phi _x} - {\beta ^2}} \right)} - {M^2}} \right)/\left( {2F{\phi _x} - {\beta ^2}} \right).\end{align}
The streamwise flux is a major component in the potential equation and is
 \begin{align}{f_1} = \left( {1 - {M^2}} \right){\phi _{{x^ * }}} + F\phi _{{x^ * }}^2 + G\phi _{{y^ * }}^2.\end{align}
An efficient three-dimensional aerodynamic code based on the TSD theory was developed by Batina[Reference Batina3, Reference Batina4] and later improved by Kim et al. [Reference Kim, Kwon, Kim, Lee and Han5]. In the next three decades after the appearance of Batina’s work, several improvements of the transonic small disturbance based method were made based on dimensional splitting (Hung, Gear and Phillips [Reference Hung, Gear and Phillips6]), time marching analysis and fast prediction of flutter (Goura et al. [Reference Goura, Badcock, Woodgate and Richards7], Woodgate and Badcock [Reference Woodgate and Badcock8]), inclusion of entropy and vorticity effects (Ly and Nakamichi [Reference Ly and Nakamichi9]), unsteady shock wave motions (Tamayama, Weisshaar and Nakamichi [Reference Tamayama, Weisshaar and Nakamichi10]), corrections for viscous effects (Greco and Sheng [Reference Greco and Sheng11]) and nonlinear effects (Schewe et al. [Reference Schewe, Knipfer, Mai and Dietz12]), and viscous-inviscid interactions (Sekar and Laschka [Reference Sekar and Laschka13]). Although the analysis of transonic flows based on the full potential flow equations (Holst [Reference Holst14]) were initially preferred, the transonic small disturbance-based methods have proven to be not only as good as the full-potential and Euler-based methods (Timme and Badcock [Reference Timme and Badcock15]) but also as fast, particularly for unsteady flows. Thus, following Batina’s work, an entropy model was developed for the solution algorithm that includes (1) an alternative streamwise flux, (2) an entropy correction in the pressure formula and (3) a modified wake boundary condition to account for convection of entropy.
To solve the unsteady TSD equation, a time-accurate approximate factorisation (AF) algorithm was used by Batina [Reference Batina3, Reference Batina4]. In the following, the AF algorithm, which is based on the Newton linearisation procedure is briefly described. The AF algorithm of Batina et al. [Reference Batina, Bennett, Seidel, Cunningham and Bland16] consists of a Newton linearisation procedure coupled with an internal iteration technique. For unsteady flow calculations, the solution procedure involves two steps. First, a time linearisation step is performed to determine an estimate of the potential field. Second, internal iterations are performed to provide time-accurate modelling of the flow field. The AF algorithm is formulated by first approximating the second order time derivative terms and mixed time derivative terms by second-order-accurate FD formulas (Batina [Reference Batina17]). The resulting equation is then rearranged, and the left-hand side is approximately factored into a triple product of operators. These operators and the residual are explicitly defined by Batina [Reference Batina17]. The solution is obtained by three sweeps — one chordwise, followed by a spanwise sweep and by a vertical sweep.
Several algorithmic changes have been made to accelerate convergence to steady state. These include deletion of the time-dependent terms in the residual and the use of an over-relaxation parameter as outlined by Kwon, Yoo and Lee [Reference Kwon, Yoo and Lee18]. Although there have been several studies of transonic unsteady flows since the work of Batina [Reference Batina3, Reference Batina4] was published, these involve either the update the grid after each time step (Schuster, Vadyak, Atta [Reference Schuster, Vadyak and Atta19]) or the solution of the Euler or Navier-Stokes equations (Guruswamy and Byun [Reference Guruswamy and Byun20, Reference Guruswamy and Byun21], Farhat and Lesoinne [Reference Farhat and Lesoinne22], Soulaimani [Reference Soulaimani23] and Liu et al. [Reference Liu, Cai, Zhu, Tsai and Wong24]).
5. Application of the TSD unsteady potential method to high AR wings
Williams et al. [Reference Williams, Bland and Edwards25] investigated the stability of multiple non-unique solutions of the unsteady TSD equation due to the presence of shocks by a time-marching method. They were able to relate the asymmetric solution obtained to an extremely long time-scale instability of the symmetric solution. Caughey [Reference Caughey26] confirmed the existence of the non-unique solutions and studied the stability of non-unique solutions by using a Euler equations-based approach, by time-accurate simulations of the unsteady flow past aerofoils. Liu, Luo and Liu [Reference Liu, Luo and Liu27] have also investigated the unsteady TSD equation and showed the existence of multiple solutions due to the presence of shocks in the chordwise direction. Although the Endquist-Osher-type dependent switch of the AF algorithm has been extended for the improved second-order spatial accuracy, the use of the type-dependent switch in the chordwise direction or presence of the chordwise shocks and instabilities do not influence the convergence of the spanwise pressure distribution. The TSD theory is used to predict the behaviour at the shock wave-front, which is physically meaningful and consistent with experimental observations. Studies by Giddings, Rusak and Fish [Reference Giddings, Rusak and Fish28] have shown that the spanwise distributions of shock pressure distributions, although not uniform, are continuous in the spanwise direction and have discontinuous slopes in the chordwise directions, thus facilitating the stretching of the solutions along the span.
The application of the TSD algorithm to high AR wings is now described. An initial estimate of the potentials at each time level is required to start the iteration process. This is obtained from a solution of a much lower AR wing. The initial planform configuration of the lower AR is stretched in the spanwise direction and the TSD algorithm is applied to the new planform, which now has a higher AR. The reason for stretching only in the spanwise direction but not along the chordwise direction is because the spanwise operators are smooth and well behaved, and are also expected to converge monotonically to the actual solution. Thus the AR of the planform considered is increased step by step until the solution for the desired high AR planform is obtained.
6. Benchmarking examples and code validation
There are three primary validation models:
-
(i) NASA Common Research Model (CRM) Model (Fig. 1): The NASA Common Research Model (CRM) consists of a contemporary supercritical transonic wing (and a fuselage). The CRM is designed for a cruise Mach number of
${M_\infty }$
= 0.85. The corresponding design lift coefficient is
${C_L}$
= 0.5. The AR = 9.0, the quarter chord sweep angle is 35°. The CRM has been used extensively grid generation studies as reported by Woeber, Gantt and Wyman [Reference Woeber, Gantt and Wyman29] while experimental investigations have been carried out at ONERA by Cartieri et al. [Reference Cartieri, Hue, Chanzy and Atinault30]. -
(ii) AGARD 445.6 wing model (Fig. 2): The AGARD 445.6 wing model, proposed by Yates [Reference Yates31] is a standard aeroelastic configuration used for validation purposes. The AGARD 445.6 wing is a swept-back wing with a quarter-chord sweep angle of 45° with a NACA 65A004 aerofoil cross-section. It has a panel AR of 1.65 and a taper ratio of 0.66.
-
(iii) The ONERA M6 wing (Fig. 3): The ONERA M6 wing is a CFD validation model for external flows because of its simple geometry combined with complexities of transonic flow (i.e. local supersonic flow, shocks and turbulent boundary layers separation). It was tested in a wind tunnel at Mach numbers (0.7, 0.84, 0.88, 0.92) and various angles of attack up to 6°. The Reynolds numbers were about 12 million based on the mean aerodynamic chord. The wind tunnel tests are documented by Schmitt and Charpin [Reference Schmitt and Charpin32] while Euler code calculations are reported byBatina [Reference Batina33].


The CRM wing planform.

The AGARD wing model planform.

The ONERA M6 trapezoidal wing planform.

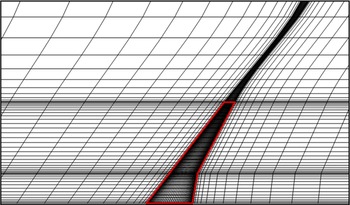
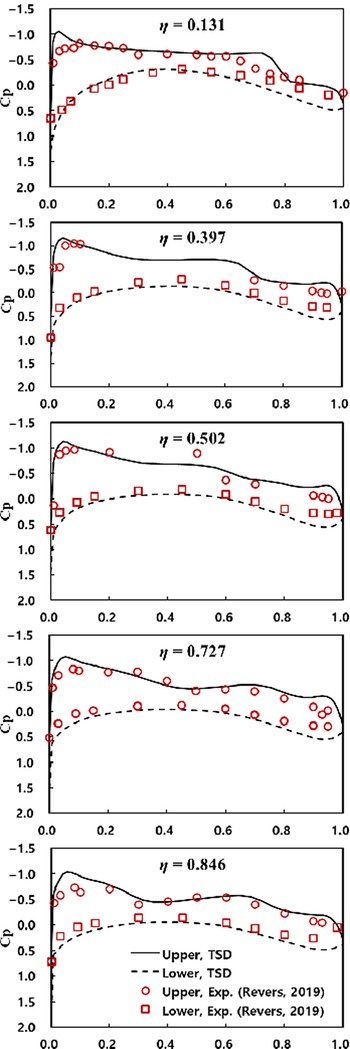
The above benchmarking or validation models have been extensively studied by several authors. In this paper we have used these examples to validate the TSD based method for high AR wings. Figure 4 shows the grid generated along the CRM planform. Figure 5 shows comparisons with experimental data (Rivers, [Reference Rivers34]) for the CRM wing at four different spanwise locations —
 $\eta = 0.131$
, 0.502, 0.727 and 0.846 at Mach 0.85 and α = 2.88°. This test data was obtained from the Ames 11-ft Transonic Wing Tunnel and was designated Test 216.
The grid generated along the planform of the CRM wing.

Comparisons with experimental data for the CRM wing at different spanwise locations,
 $\eta = $
0.131, 0.502, 0.727, and 0.846 at Mach 0.85 and α = 2.88o.

In Fig. 5, the test result and the analysis result are slightly different at
 $\eta = 0.131$
. The main reason of the discrepancy is that the fuselage was included in the tests whereas only the wing is considered in the analysis. In addition, a weak shock wave exists on the upper surface of the wing, which has been captured and successfully predicted in this paper.
In the test result, this weak shock wave occurred up to
 $\eta = 0.502$
, while in the TSD analysis, there was a shock wave up to
 $\eta = 0.397$
and the shock wave almost disappeared at
 $\eta = 0.502$
. Except for a slight difference in the location and intensity of the shock wave, the TSD analysis results agree relatively well with the test results. Considering that the time required for analysis is 1/100 or less compared to the case of using the Navier-Stokes equations for the same wing model, it can be seen that the TSD provides very effective and reliable results.
In another validation study, the pressure distributions on the ONERA M6 planform computed from the TSD theory were compared with the experimental results documented by Schmitt and Charpin [Reference Schmitt and Charpin32] as well as the Euler code calculations reported by Batina [Reference Batina33].
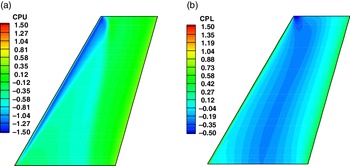
In this case comparisons were made with the pressures on both the upper and the lower surface of the wing. The pressure contours on both these surfaces are shown in Fig. 6 for
 ${M_\infty } = 0.84$
and α = 3.06°. The cross-sectional pressure distributions at six different spanwise locations are compared with the corresponding measurements and Euler code calculations of the flow properties in Fig. 7.
Pressure distribution contours generated on the upper surface (a) and lower surface (b) of the ONERA planform.

Comparisons with experimental and Euler analysis data for the ONERA M6 wing at different spanwise locations,
 $\eta = $
0.96, 0.9, 0.8, 0.65, 0.44 and 0.2.

In this figure, the TSD analysis results predict the location of the shock wave more precisely than the Euler results except at the wing tip. In the TSD algorithm, as the physical shape of the wing is expressed using only the slope information of the surface, there is a limit in reflecting the shape of the wing tip fairing. While this characteristic of the TSD code has the advantage of providing very fast and robust aerodynamic analysis results, it acts as a limitation in accurately reflecting three-dimensional shapes such as a blunt body or a wing tip fairing. This is the reason for not accurately predicting the exact location of the shock wave at the tip of the wing in Fig. 7. However, as the contribution of the tip part to the overall lift of the wing is small, the effect of this difference and its influence on the overall lift and moment will not be large.
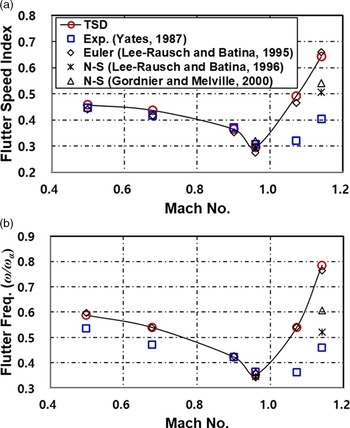
The Euler and the TSD potential method provide two competing numerical methods to simulate unsteady aerodynamic flows and are widely used. Comparing these numerical solutions is not quite straight forward. Euler equations are a simplified version of Navier-Stokes equations, obtained by excluding the effect of the viscosity on the fluid also known as inviscid flow, which only describes the fluid using the velocity, pressure and density as the state variables. The TSD potential method is based on a simplified form of the full potential equation that is intended to be used in situations where there are thin or slender bodies in the flow, such as aerofoils. The key difference between the two inviscid models is that the Euler model does not restrict the flow to be irrotational while the TSD model does. The Euler equations are described by five or more equations while the TSD method is based on a single equation for the scalar potential. One approach of comparing the two method is to use grids with similar spacing. It is on this basis that the results obtained by the TSD method are compared with the typical results obtained by the application of the Euler method. While it is true that the Euler Method is more correct in principle and physically most appropriate, the use of the Euler method requires discretisation of multiple equations, and this could and does cumulatively increase the total error due to discretisation. In the case of the TSD method, the numerical modelling process is simpler and more robust than the Euler equation. It is also true that the TSD method has its own limitations due to the inherent physical modelling as a potential flow. In view of the differing limitations, given a basis for a comparison, it is indeed possible that the results obtained by the TSD method are marginally better than the corresponding results obtained by the Euler formulation and the error is small for certain bodies such as thin aerofoils. So in these cases it does appear to be more accurate than the Euler equation. Within the limitations imposed by the numerical approximations, in this paper, the TSD analysis results predict the location of the shock wave more precisely than the comparable Euler method based on typical published results, except at wing tip, which is not particularly important for aeroelastic applications as shown in Fig. 8. This is very much dependent on the choice of the Euler model-based results and how the comparison is made. While the shock location and peak suction have been successfully captured and predicted, one cannot expect much more from the TSD-based numerical method. Although the TSD method is generally not a more accurate technique than the Euler model-based methods, it can sometimes show results that are closer to the test results, for the good reasons stated above.
Flutter speed index (a) and frequency boundaries (b) of the AGARD 445.6 wing.

The AGARD wing model has been used extensively for validating flutter predictions by Goura et al. [Reference Goura, Badcock, Woodgate and Richards7], Beaubien, Nitzsche and Feszty [Reference Beaubien, Nitzsche and Feszty35], Zhang et al. [Reference Zhang, Ding, Ji and Zhang36], Chaitanya et al. [Reference Chaitanya, Prasad, Pradeep, Sri Harsha, Shali and Nagaraja37], Li and Ekici [Reference Li and Ekici38] and Kwon et al. [Reference Kwon, Park, Lee, Kim, Lee and Kwon39] by amongst several others.
The results obtained in this paper, based on the unsteady potential TSD formulation, compare well with the published results of Yates [Reference Yates31], Lee-Rausch and Batina [Reference Lee-Rausch and Batina40, Reference Lee-Rausch and Batina41], Gordnier and Melville [Reference Gordnier and Melville42]. Comparisons of the flutter speed obtained for the AGARD wing model are shown in Fig. 8. In the figure, the flutter speed index is defined as the ratio
 ${U_f}/\!\left( {\sqrt \mu {\omega _\alpha }{b_s}} \right)$
, where,
 $\mu $
is the mass ratio, the ratio of wing mass to mass of air in the truncated cone that encloses the wing,
 ${U_f}$
is the flutter speed, the flutter frequency ratio is,
 $\omega /{\omega _\alpha }$
,
 ${\omega _\alpha }$
is the torsional natural frequency and
 ${b_s}$
is the reference semi-span. The results over a wide range of Mach numbers, are summarised in Table 2 clearly indicating the dip in the flutter speed at the sonic Mach number.
Summary of flutter analysis results for AGARD 445.6 wing

The application of the above TSD methodology for the synthesis of feedback control laws for the active suppression of flutter instabilities in the transonic flow domain has also been successfully demonstrated by Vepa and Kwon [Reference Vepa and Kwon43]. The synthesis methodology of the feedback control laws was successfully demonstrated with all of the above benchmarking examples, albeit for wings with not very high aspect ratios.
Another benchmarking model is the Benchmark Active Control Technology (BACT) model, (Waszak [Reference Waszak44]) which is a rigid, low-aspect ratio rectangular wing (AR = 4) with an NACA 0012 aerofoil section. The BACT wind tunnel model, a rigid rectangular wing, was originally conceived for testing at free stream Mach numbers less than 0.77 and not at transonic flow regimes. Yet some extremely interesting CFD-based studies (see for example Bennett, Scott and Wieseman [Reference Bennett, Scott and Wieseman45]) and validation tests of active flutter control have been completed in the past in the transonic regime. The TSD method as applied to the ONERA M6 planform (AR = 3.8) was easily adapted to the BACT wing due to its planform being un-swept and rectangular, with almost the same aspect ratio and for this reason it was decided not to consider the BACT wing any further in this paper.
7. Application to very high AR wings
The effects of increasing the AR by spanwise stretching are now shown. Each section of the wing has been simplified to have same ONERA D aerofoil. Although the pressure distribution contours were also computed in all cases, these are not shown.
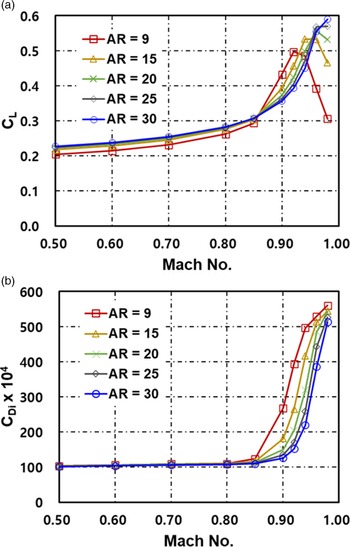
In Fig. 9(a) and (b) the lift and induced drag coefficients computed as the AR of the CRM wing is increased from 9 to 30 are respectively shown for increasing free stream Mach numbers, for
 ${M_\infty }$
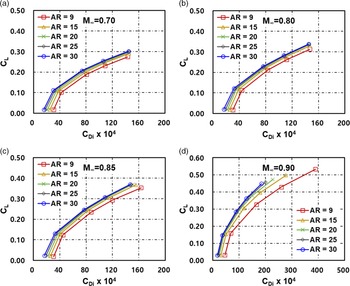
.Figure 10 shows the corresponding drag polars (plots of the lift coefficient with the induced drag coefficient) as the free stream Mach number is increased from 0.7 to 0.8, 0.85 and 0.9. Comparing the results plotted in Figs 9 and 10 it is quite clear that there is an increase in maximum lift with increasing AR while the induced drag is almost the same.
The lift (a) and induced drag (b) coefficient variation with increasing Mach numbers for the CRM planform.

The plots of lift versus the induced drag coefficients variation with for free-stream Mach numbers, 0.7, 0.8, 0.85 and 0.9.

Similar studies were conducted on the ONERA wing model as well. The effect of changing the planform sweep angle Λ is now considered. The study considers the effect of sweep angle variation along with changes in angle-of-attack. In Fig. 11 is shown the variation of the lift to drag ratio for a range of wing sweep angles and wing ARs for
 ${M_\infty } = 0.85$
and a given angle-of-attack of the ONERA wing model. For lower sweep angles, the lift-to-drag ratio is very much lower and, for this reason, they are not shown.
The variation of the lift to drag ratio for various sweep angles of the ONERA wing model.

One approach to apply a benchmarking model’s structural properties to a wing model that is stretched in the spanwise direction, with both the sectional bending rigidity and the sectional torsion rigidity scaled, albeit non-uniformly, so as to maintain almost similar flutter characteristics as those of the original upstretched CRM wing model (AR = 9). Such an approach is based on reducing the model to beam finite element model as outlined by Elsayed, Sedaghati and Abdo [Reference Elsayed, Sedaghati and Abdo46]. A systematic method of model scaling for aircraft wing structural design, and flutter analysis was introduced by Ricciardi et al. [Reference Ricciardi, Canfield, Patil and Lindsley47]. However, in this study the CRM model’s structural properties are applied to a model wing, stretched in the spanwise direction, with the same bending rigidity and the torsion rigidity as the original model. Assuming the structural dynamics is linear, the vibration modes of the stretched wing will remain the same as in the upstretched case.
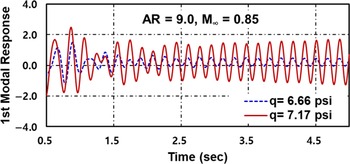
Figure 12 shows the first six modes of the CRM wing-box v15 model. In Figures 13 and 14, are shown the results of the flutter analysis of the stretched high AR wings with the same structural properties as those of the CRM wing model. The original CRM was the high-speed version and, the geometry and model files are available in the public domain (Rivers [Reference Rivers48]). Figure 13 shows the response of the CRM wing model as it approaches the flutter speed for two different values of the dynamic pressure,
 ${\bf{q}}$
, at
 ${M_\infty } = 0.85$
.
Structural mode shapes and frequencies of the CRM wing-box v15 model.

First mode aeroelastic response near flutter boundary of the CRM at
 ${M_\infty } = 0.85$
.

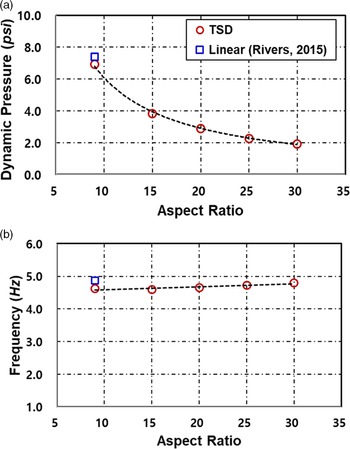
Flutter analysis results for CRM wing-box v15 model according to aspect ratios and comparison of NASA’s linear analysis results; (a) flutter dynamic pressure and (b) flutter frequency.

In Fig. 14 areshown the flutter dynamic pressure and frequency boundaries with 20 structural modes, by the present method for increasing aspect ratios and compared with the linear analysis results of Rivers [Reference Rivers48] for the standard model with aspect ratio equal to 9. In Table 3 a summary of the comparisons of the flutter speeds and frequencies for the wings with increasing aspect ratio are presented. The flutter speed ratio is the ratio of the flutter speed of the considered wing to the flutter speed of the corresponding wing with aspect ratio equal to 9, based on the TSD result. In particular it may be observed that, with the same structural properties as the original CRM model, both the flutter speed and flutter frequency decrease. From the table it is possible to predict the reduction in the flutter speed with the increase in the aspect ratio, for other high aspect ratios. The application of the above TSD methodology to the problem of active suppression of flutter instabilities in the high subsonic and transonic flow domain has already been discussed by Vepa and Kwon [Reference Vepa and Kwon43]. In that paper only Transonic Mach numbers were considered. In the current paper both low subsonic as well as transonic Mach numbers have been considered.
Alternative structural models may also be used based on the work of De et al. [Reference De, Jrad, Locatelli, Kapania, Baker and Pak49] and Jutte et al. [Reference Jutte, Stanford, Wieseman and Moore50]. In fact the aeroelastic tailoring approach of Jutte et al. [Reference Jutte, Stanford, Wieseman and Moore50] provides an alternative approach for scaling the stiffness properties of the stretched high-aspect ratio wings.
Summary of flutter analysis results for geometrically stretched CRM wing-box v15 model at Mach 0.85 for increasing AR

8. Discussion and conclusions
The methodology adopted in this paper based on stretching the spanwise coordinate, should in principle, give the exact solution, when the transonic small disturbance equation for the unsteady perturbation potential distribution is linear. The iteration scheme is equivalent to spatial iteration rather than the temporal iteration used in the classical algorithm of Batina et al. [Reference Batina, Bennett, Seidel, Cunningham and Bland16]. However to start the iteration for the first time, the method outlined by Batina et al. [Reference Batina, Bennett, Seidel, Cunningham and Bland16] is adopted. Once a solution for a wing with a given AR is known, the method proposed in this paper is generally faster especially when the calculations have to be repeated for several self-similar planforms with higher ARs.
As the AR increases, the results of the computations show that the lift coefficient increases, especially in the transonic region. There is an increase in maximum lift with increasing AR while the induced drag is almost the same. However, simply increasing the AR does not significantly improve the lift to induced-drag ratio.
The computations of the lift coefficient seem to point to an optimum sweep angle for each angle-of-attack at which the lift-to-drag ratio is indeed a maximum. Furthermore the optimum sweep angle is different for different angles of attack. Thus it appears that to completely reap the benefits of varying the sweep angle, variable sweep lifting surfaces may provide the best solutions.
The reductions in the flutter speeds with increasing aspect ratios and with the same structural properties as the standard CRM model allows one to develop scaling laws for increasing both the sectional bending and sectional torsional rigidities so as to maintain the flutter speed more or less at the same value.
Some of the other applications of the TSD unsteady potential methodology currently being investigated are the applications to the design of active flutter suppression control laws based on the computational model, presented by Vepa and Kwon [Reference Vepa and Kwon43], to the very high aspect ratio wings considered in this paper. These applications pose additional challenges because of the elastic deformations of the high aspect ratio control surfaces which must necessarily be modelled as well.
Acknowledgements
The authors gratefully acknowledge the support provided by Agency for Defence Development, South Korea, through the award of a post-doctoral fellowship to the first author while at Queen Mary, University of London, UK, as part of the Commissioned Continuing Education programme (2019-personnel appointments (Ga)-110).