


Introduction
The mass balance of Svalbard glaciers and ice caps has been calculated, using analysis of regional mass-balance gradients, to be slightly negative at –4.5 ± 1.0 km3 a-1, based on data covering approximately the last 30–40years (Reference Hagen, Melvold, Pinglot and DowdeswellHagen and others, 2003). This gives a specific net balance of -0.12 ±0.03 m a-1 w.e. for the archipelago. This is consistent with calculations of the mass balance of Arctic glaciers and ice caps in general, which have been calculated to have a specific net mass balance of −0.067 m a-1 between 1961 and 1990, contributing about 0.05 mm a-1 to global sea-level rise (Reference Dyurgerov and MeierDyurgerov and Meier, 1997). It has been suggested that this value is almost 20% of the total produced from glaciers and ice caps outside the great ice sheets. There have, however, been observations of substantial changes to the Arctic cryosphere in the last decade or so. Measurements of ice-surface elevation change over the Greenland ice sheet during the 1990s have shown extensive peripheral thinning that has been associated with a combination of increased ablation and ice-dynamic effects (Reference AbdalatiAbdalati and others, 2001). In addition, there is now a substantial body of evidence indicating a widespread change in climate during the 20th century in the Arctic (Reference SerrezeSerreze and others, 2000), and during summer 2002 a record minimum in Arctic sea-ice extent and a record maximum in melt area over the Greenland ice sheet were observed (Reference SerrezeSerreze and others, 2003).
Svalbard contains about 12% of the land-ice volume of the Arctic, excluding the Greenland ice sheet (Reference DowdeswellDowdeswell and others, 1997), and lies at the northern limit of the warm North Atlantic Drift. Consequently, it is a region believed to be particularly sensitive to climate change and might be expected to show a fairly rapid response to the warming during the 1990s (Reference AngellAngell, 2000).
During spring in 1996 and 2002, airborne laser-altimeter surveys were flown over a number of glaciers and ice caps in the Svalbard archipelago (Fig. 1). A complex pattern of elevation change was observed due to a variety of forcing factors including ice dynamics as well as climate. Here we report on the elevation changes measured on the glaciers and ice caps surveyed in Spitsbergen and western Nordaustlandet (Fig. 1). The anomalous elevation changes observed on the largest ice cap on Nordaustlandet, Austfonna, have been presented elsewhere (Reference Bamber, Krabill, Raper and DowdeswellBamber and others, 2004; Reference Raper, Bamber and KrabillRaper and others, 2005).

Statistics on mean elevation change (dh/dt), mean elevation, z, where observations were obtained, the standard deviation, σ, of dh/ dt and the number of points used to calculate the means for the 16 glaciers and ice caps sampled. The data have been ordered on a regional basis, and the five areas defined in the table are indicated by the dashed boxes in Figure 1

Methods
Ice-surface elevation measurements of very high accuracy were acquired using the Airborne Topographic Mapper 3 (ATM3; Reference KrabillKrabill and others, 2000). The instrument is a conical-scanning laser-ranging system with a pulse-repetition frequency of 5 kHz and a scan rate of 20Hz in 2002 and 10 Hz in 1996. This gives an along-track data-point spacing of 3 and 6m, respectively. At a flying altitude of 400 m the across-track width of the measurements is around 150 m. Aircraft location was determined by kinematic global positioning system techniques, and aircraft pitch and roll were measured using an inertial navigation system. Ice-surface elevations with root-mean-square accuracies of 10 cm or better were obtained from these campaigns (Reference Krabill, Thomas, Martin, Swift and FrederickKrabill and others, 1995), allowing unambiguous determination of elevation changes (dh/dt) with a magnitude >2.3 cm a–1 over the 6 year interval between observations. The data used here have been averaged across-track and over 300m in the along-track direction, which is why the number of data points on smaller glaciers is relatively small. This, however, reduces noise introduced by short-wavelength features (such as crevasses) that may have propagated downstream during the time interval between observations.
The flight-lines over Svalbard are shown in Figure 1. The tracks were flown in roughly straight lines as close to the central flowline of glaciers as possible. In some areas, the tracks inevitably wander away from the centre line onto areas of non-glacierized permafrost and rock outcrops. Manual inspection of vertical digital photographs, taken contemporaneously with the ATM3 data, was used in combination with Norsk Polarinstitutt maps, to identify such occurrences, which were usually characterized by sections of small elevation changes (typically <0.05m a–1). In the case of Austre Gronfjordbreen, the entire profile suffered from this problem and is therefore not included in the analysis presented here.
To aid the analysis and interpretation, the data have been partitioned and averaged over individual ice masses so that local climatological and/or glaciological effects can be considered. The boundaries between ice masses were identified by examination of the elevation profiles, in combination with 1 :250 000 Norsk Polarinstitutt maps, which provide a reasonable indication of ice divides and glacier margins. Inevitably, however, there is a certain level of subjectivity in partitioning the data.
Results
Repeat observations of ice-surface elevation using the ATM3 were obtained for twelve glaciers and four ice caps (excluding Austfonna, which has been discussed elsewhere (Reference Bamber, Krabill, Raper and DowdeswellBamber and others, 2004; Reference Raper, Bamber and KrabillRaper and others, 2005)), and the results are summarized in Table 1. The standard deviation, a, of dh/dt in column 3 of Table 1 provides an indication of the variability in elevation change and is not an estimate of the uncertainty or error in the measurement. It is largely a function of the altitude range of the glacier in question, which is indicated by the minimum and maximum elevations of the observations in columns 5 and 6 of Table 1. In general, thinning is observed except at higher elevations in the northeast of Spitsbergen. The highest individual and averaged thinning rates (up to 0.9 m a-1) were observed in south Spitsbergen (glaciers 1-4, Fig. 2a), and the mean dh/dt for these four glaciers (excluding Fridtjovbreen for reasons explained below) is -0.47 m a-1 , around four times the long-term estimate for the archipelago (Reference Hagen, Melvold, Pinglot and DowdeswellHagen and others, 2003). Even at the highest elevations on the ice cap of Asgardfonna (Fig. 2c), moderate thinning of about -0.05 to 0.1 ma–1 is obtained, while Lomonosovfonna appears to be close to balance (Table 1; Fig. 2b). The rates of thinning are, in general, significantly greater than the 30year average value estimated for the archipelago as a whole (−0.12 ± 0.03 m a-1 w.e. (Reference Hagen, Melvold, Pinglot and DowdeswellHagen and others, 2003)), although there is substantial regional variability in dh/dt and our survey is not comprehensive in coverage. Nonetheless, all but four ice masses show higher thinning rates than the published long-term value for the archipelago. The mean dh/dt for all ice masses sampled was –0.21m a–1 for a mean sampled elevation of 588 ma.s.l. These values were calculated from the individual dh/dt measurements rather than the aggregated means presented in Table 1. Consequently they are, by default, weighted more strongly, as they should be, toward the larger ice masses (as the number of observations is proportional to the length of the ice mass). Figure 2 shows the observed dh/dt values used to calculate the means in Table 1 for individual flight-lines and ice masses.
Maps showing the location of individual elevation change measurements for the various glaciers and ice caps. The size of the vertical bars indicates the magnitude of the change. Black bars indicate negative changes, grey bars positive. A bar representing an elevation change of 1 m a–1 has been plotted to provide a scale. (a) South Spitsbergen (note there are no positive values plotted for this region); (b) Fridtjovbreen; (c) Kongsvegen and Sveabreen; (d) central east Spitsbergen; (e) Asgardfonna and Dunebreen; and (f) Vestfonna and Sore Franklinbreen, northwest Nordaustlandet.

In general, there appears to be little correlation between dh/dt and altitude, z, for individual glaciers except perhaps in the case of Nordenskioldbreen (Fig. 3a), Kongsevegen (Fig. 3b) and Oslobreen (Fig. 2d). The location of zero elevation change was about 1050, 560 and 320m a.s.l., respectively. The long-term equilibrium-line altitudes (ELAs) for these three glaciers are around 550, 450 and 360 ma.s.l., respectively (Reference Hagen, Melvold, Pinglot and DowdeswellHagen and others, 2003).
Plots of elevation profiles and elevation changes shown by solid bars as in Figure 2. (a) Nordenskioldbreen; (b) Kongsvegen; (c) Fridtjovbreen; (d) Vegafonna; and (e) Vestfonna.

Fridtjovbreen shows an unusual pattern of elevation change, with thickening at lower elevations and its largest thinning rates in the upper reaches of the glacier (Fig. 3c). Interestingly, this glacier is believed to have started a surge between 1995 and 1996 (Reference Murray, Luckman, Strozzi and NuttallMurray and others, 2003). The pattern of elevation change appears to reflect the propagation of the surge down-glacier. As a consequence, elevation changes on this glacier are likely to reflect non-steady-state ice dynamics rather than mass balance.
On Vegafonna and Vestfonna, there is an asymmetry to the pattern of dh/dt, with higher thinning on the western side of Vegafonna and the opposite on Vestfonna (Figs 2f and 3d and e). These two ice caps lie on the same side of Nordaustlandet, to the west of Austfonna (Fig. 1). They are at similar altitudes and are separated by only about 50 km. The mean thinning rates are similar but the spatial pattern is quite different.
Interpretation and Discussion
The most comprehensive and recent review of the mass balance of Svalbard ice masses was undertaken by Reference Hagen, Melvold, Pinglot and DowdeswellHagen and others (2003). They combined measurements from shallow cores and field observations from stake networks on 13 glaciers to produce regional estimates of specific net balance gradients as a function of ice surface elevation for a period covering roughly the last 30 years. The specific net balance over the whole archipelago was estimated as -0.12 ± 0.03 m a-1 w.e., and the average ELA was calculated as about 450ma.s.l. (Reference Hagen, Melvold, Pinglot and DowdeswellHagen and others, 2003). For the 16 glaciers and ice caps investigated here, the average elevation change was found to be -0.21 m a-1 for the period 1996-2002. Using a mean ice density (i.e. including the firn layer) of 900 kg m–3 gives a value of -0.19 m a-1 w.e. To convert the elevation changes into estimates of mass change, however, several assumptions are required. First, we assume that the mean density of the combined firn-ice column has not changed during the measurement period. This is wholly reasonable in the ablation zone where the depth of the firn layer is small, but may be less valid in the accumulation area. Second, we assume that any vertical isostatic displacement of the underlying bedrock is small compared to the elevation changes. Values for Svalbard are typically about 1 mm a–1 (Reference FormanForman and others, 2004). Finally, we assume that the sampling of the ice masses is not biased between ablation and accumulation area, in other words, that the sampling equally weights all parts of the glaciers. This may be a less robust assumption as the ATM3 data are essentially one-dimensional profiles along glacier centre lines. As a consequence, they may be more heavily weighted (in terms of number of samples per unit area) to the narrower (in width) but longer ablation areas compared to the wider but shorter accumulation areas.
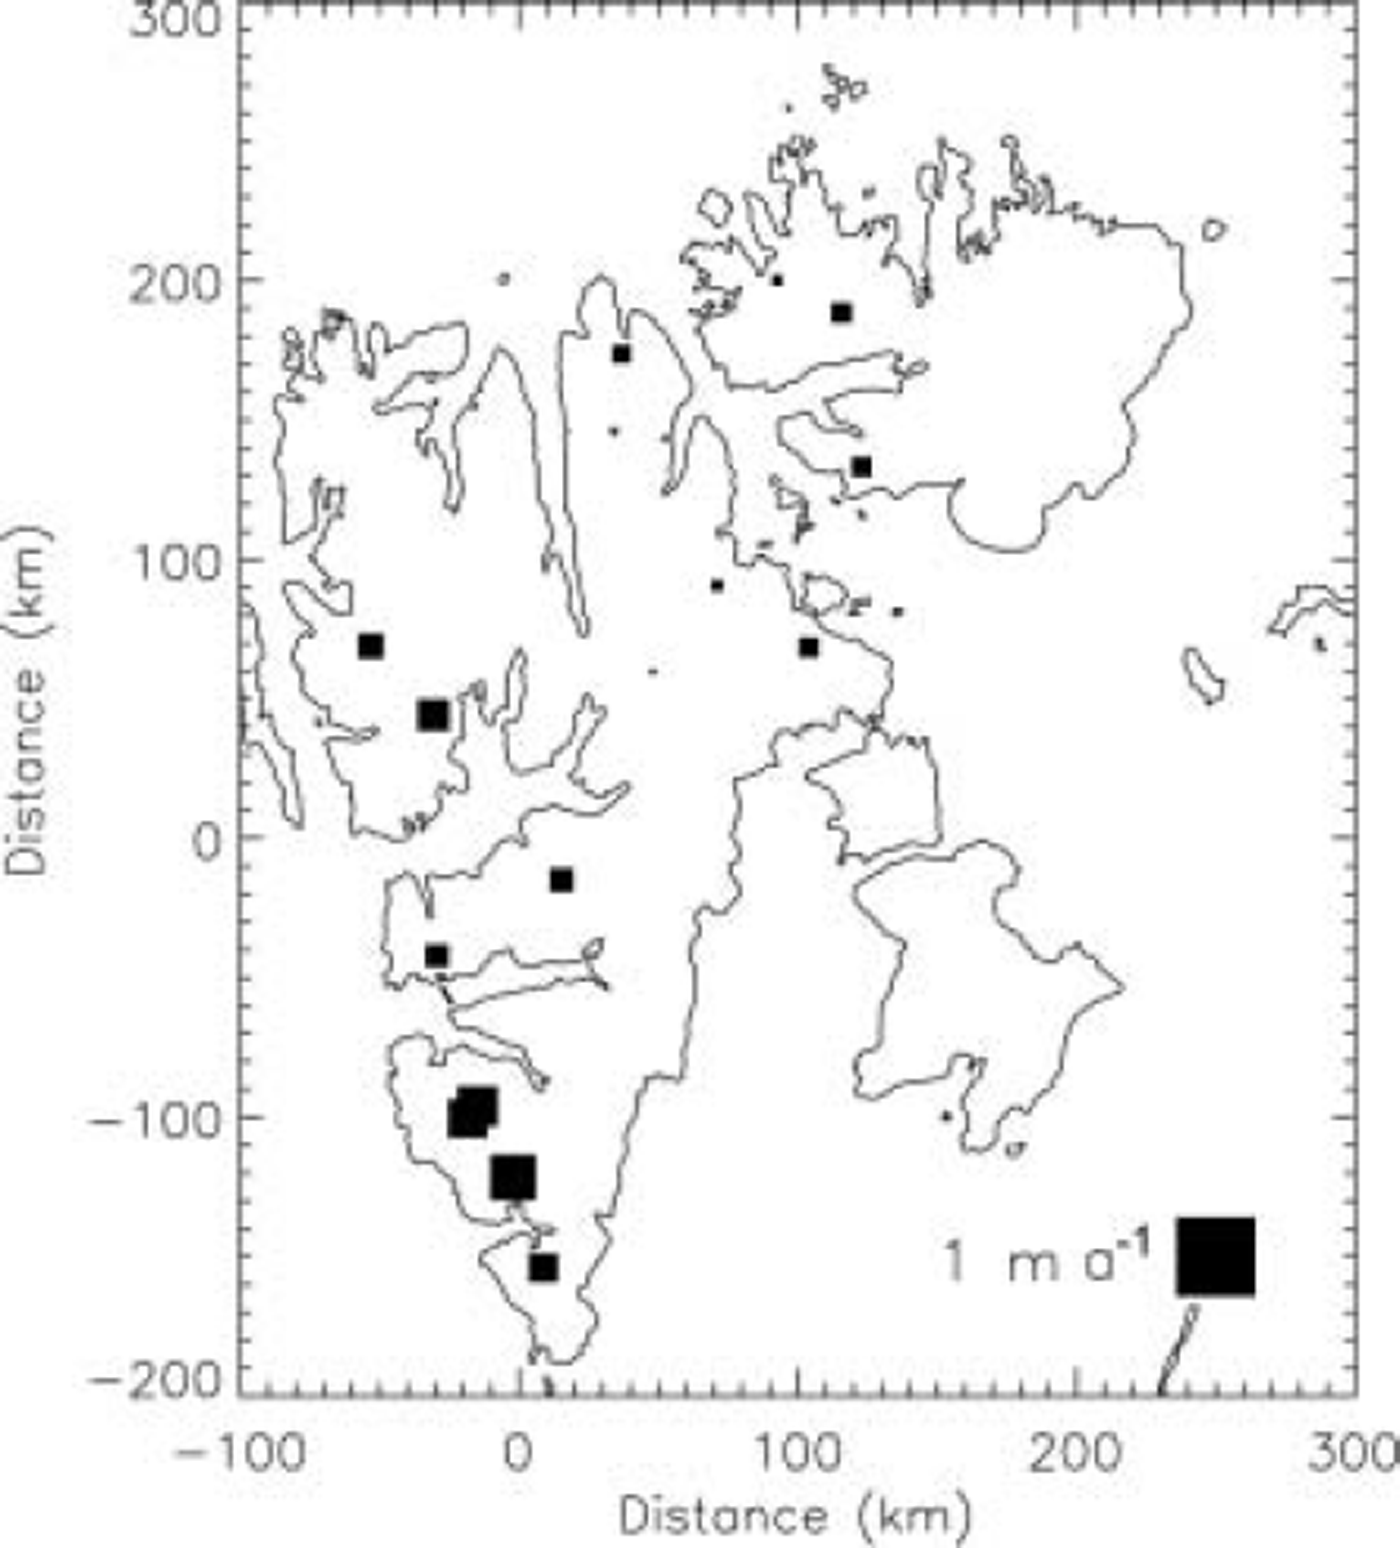
If we accept the three assumptions above, the results suggest that there has been an acceleration in mass loss in the period 1996–2002 compared with the longer-term in situ observations. In addition, there appears to be a regional mass-balance trend, with highest negative values in the south and a northeast gradient toward less negative mass balance. This is illustrated in Figure 4, which shows the mean dh/dt values for the 16 ice masses listed in Table 1. The squares for Lomonosfonna and Asgardfonna are only just visible, as they have a mean dh/dt close to zero, but it should be noted that these ice caps also have the highest mean elevations.
Plot of mean elevation changes for the 16 glaciers and ice caps listed in Table 1. The magnitude of the change is indicated by the size of the squares plotted. A square representing a change of 1 m a–1 is shown for scale. All changes are negative except for Sore Franklinbreen, Nordaustlandet, which is believed to be a surge-type glacier (Reference SchyttSchytt, 1969; number 16 in Fig. 2f).
A multiple linear regression with position x, y and mean elevation of the ATM samples, z, as the independent variables and dh/dt as the dependent variable produced the following relationship:

The units of the coefficients are a–1, with the origin chosen to be near Longyearbyen, close to the centre of Spitsbergen, as shown in Figure 4. The regression explained 82% of the variance of dh/dt, but only y was found to be a significant independent variable. The P values for x, y and z were 0.539, 0.018 and 0.118, respectively. A P value <0.05 is considered significant at the 95% confidence level (Reference Bevington and RobinsonBevington and Robinson, 1992). Removing x from the regression reduced the variance explained by only 2% and increased the adjusted R value to 0.59 from 0.56. This is a measure of the overall correlation taking into account the number of independent variables. It is not surprising that x was not found to have a significant linear relationship with dh/dt, as the contours of the ELA have a complex relationship with longitude (Reference Hagen, Melvold, Pinglot and DowdeswellHagen and others, 2003). A non-linear parametric regression is probably more appropriate, but, with such a small sample population, is unlikely to produce meaningful results. More surprising is that z was not found to be a significant variable. We can only assume that the small sample and differences in glacier size, aspect and glaciological setting (e.g. calving or non-calving) are folded into the influence of z on mass balance. It should be noted, as mentioned earlier, that dh/dt only appears to be reasonably correlated with z for three of the sixteen ice masses sampled. The highest-altitude ice masses (Lomonsovfonna and Asgardfonna) are the closest to balance, but they are also inland ice caps as opposed to coastal glaciers. It is also likely that a more appropriate variable than mean elevation would be ELA, but, in the absence of adequate data for this variable, it could not be used.
The longest meteorological record in Svalbard is for Longyearbyen airport and extends back to 1912 (Fig. 5). The smoothed mean annual air-temperature record suggests a warming trend of 0.67˚C per decade from about 1970 to 2000 (Fig. 5), and the period 1996–2001 was 0.97˚C warmer than the mean for 1970–2000. It should be noted, however, that this warming is not exceptional for the last century as there were similar warm periods during the 1930s and late 1950s. There is no discernible trend in the smoothed precipitation record (Fig. 5) during the measurement interval.
Mean annual air temperature and precipitation, 1912–2001, for the meteorological station at Svalbard airport, Longyearbyen. The location of the station is shown by the solid circle in Figure 1. Ten-year running mean curves are plotted for temperature and precipitation.

We have used seasonal sensitivity characteristics for temperature and precipitation (Reference Oerlemans and ReichertOerlemans and Reichert, 2000; Reference OerlemansOerlemans and others, 2005) to determine mass-balance anomalies for the periods 1970–2000 and 1996– 2001 (Fig. 6). The anomalies were calculated with respect to the monthly mean values for the entire length of the record (1912–2001). The mean net anomaly (precipitation plus temperature) for 1970–2000 was –0.002ma–1 and for 1996– 2001 it was –0.145 ma–1. In fact, the whole of the 1990s appears to have a substantial negative anomaly of –0.1 to –0.2 m a–1. It seems probable, therefore, that the enhanced negative mass balance (compared to the 30year value) implied by the ATM3 data can be explained by the weather during the measurement period. It is also likely that the sampling of the ATM3 flight-lines was not fully representative of the mass balance of the archipelago as a whole and is biased toward Spitsbergen glaciers and ice caps. No data were obtained from Barentsøya and Edgeøya, for example, and the results from Austfonna, Nordaustlandet, are believed to be unrepresentative of the general trend across the archipelago because of local micrometeorological effects (Reference Bamber, Krabill, Raper and DowdeswellBamber and others, 2004; Reference Raper, Bamber and KrabillRaper and others, 2005).
Mass-balance anomalies (dB n) calculated from monthly mass-balance sensitivity values for precipitation and temperature for Svalbard (Reference OerlemansOerlemans and others, 2005). Monthly deviations from the climatological mean (1912–2001) for Longyearbyen were calculated and summed for each year 1970–2001. The solid line is a 5 year running mean for the combined (net) annual precipitation and temperature anomalies.

Conclusions
Elevation changes were obtained for twelve glaciers and four ice caps over the 6 year period 1996–2002 (Table 1). The mean change for all the ice masses considered here is 1.6 times the value estimated using field data for the last 30– 40 years and we conclude that higher temperatures in recent years can explain the increased negative balance implied by our results (Fig. 6). Some of the patterns of elevation change cannot, however, easily be explained by climatological controls: for example, the contrasting behaviour of two adjacent ice caps, Vestfonna and Vegafonna (Fig. 3d and e), and the pattern of change on Fridtjovbreen (Fig. 3c). There appears to be a strong and significant latitudinal gradient in mass balance, with mean dh/dt values being most negative in south Spitsbergen and becoming less negative moving northward (Table 1 ; Fig. 4). The pattern of elevation changes cannot easily be explained by any single dominant factor, however, and there appear to be both glaciological and local meteorological controls on the changes observed. The results highlight the high degree of short-term variability in glacier and ice-cap mass balance, both regionally and locally. This, in turn, highlights the need for extensive and representative spatial and temporal sampling of ice masses of different size, altitude, aspect and glaciological setting, in order to be able to make accurate estimates of the medium-term mass balance of the region.
Acknowledgements
This work was funded by UK Natural Environment Research Council grant NER/B/S/2000/00083 and NASA’s Cryospheric Sciences Program and the European Union SPICE project. We thank the crew of the NASA P-3 aircraft. We acknowledge the technical support of R. Mitchell, A. Waller and J. Scott and the support and assistance of the NASA Cryospheric Sciences Program manager, W. Abdalati. We thank D. Ellis for assistance in drafting figures.



