Implications
Ingestion of small amounts of some types of condensed tannins (CTs) by ruminant livestock has potential to improve their productivity, their protein use efficiency, and reduce (i) the negative impact of gastrointestinal parasites, (ii) bloat, (iii) urine urea excretion and (iv) ammonia and methane emissions. Therefore, a reliable method is needed to provide small amounts of beneficial CTs to ruminants consuming high-quality forage. Results from this study indicate that sheep and cattle can develop a preference for drinking water that contains grape seed tannin, and intake of this tannin in water may reduce urine urea excretion. Thus, providing tannin to ruminants via their drinking water may be a useful technique.
Introduction
Ingestion of small amounts of condensed tannin (CT) with high-quality forage by ruminant livestock may reduce bloat (Min et al., Reference Min, Pinchak, Fulford and Puchala2005), gastrointestinal parasites (Lisonbee et al., Reference Lisonbee, Villalba, Provenza and Hall2009) and methane emissions and increase growth rate (Waghorn, Reference Waghorn2008). Ingestion of the CT in some CT-containing plant species by sheep and cattle may also improve their protein use efficiency by reducing protein digestion in the rumen and increasing protein flow to the abomasum and small intestines, and increasing net absorption of amino acids from the intestine (Waghorn et al., Reference Waghorn, John, Jones and Shelton1987a and Reference Waghorn, Ulyatt, John and Fisher1987b; Wang et al., Reference Wang, Waghorn, McNabb, Barry, Hedley and Shelton1996).
Another consequence of CT-related reduction in rumen protein digestion is reduced urine urea excretion and consequently reduced ammonia emission from surfaces where urea is excreted (Powell et al., Reference Powell, Aguerre and Wattiaux2011). Bacterial decomposition of urea in animal urine is the largest global source of ammonia emissions (Dentener and Crutzen, Reference Dentener and Crutzen1994).
Managing pasture forage such that ruminants ingest small amounts of CT is difficult. Tannin-containing forage plants such as birdsfoot trefoil (Lotus corniculatus) and sainfoin (Onobrychis viciaefolia) are difficult to grow and maintain in pastures for many years. A few CT extracts are commercially available and these or dried plant material with high levels of viable CT could be mixed into feed supplements, which the animals may or may not eat. However, research is needed to determine if this approach could be effective and economically viable. Another potential method for supplementing ruminants with CT in some situations may be via their drinking water. Therefore, we tested the technique of feeding small amounts of CT to ruminants via water (Kronberg, Reference Kronberg2008 and Reference Kronberg2010 and Kronberg and Liebig, Reference Kronberg and Liebig2011) and concluded that the approach had potential but required more evaluation and development.
The commercially available CT we used in previous studies (quebracho (Schinopsis spp.) and black wattle (Acacia mearnsii); Kronberg, Reference Kronberg2008 and Reference Kronberg2010 and Kronberg and Liebig, Reference Kronberg and Liebig2011), were crude extracts from trees with high concentrations of specific CT that may not be the most useful CT for ruminants (Komolong et al., Reference Komolong, Barber and and McNeill2001; Waghorn, Reference Waghorn2008). These extracts also contain small amounts of other compounds that may be toxic to cattle or sheep (Kirby and White, Reference Kirby and White1955; Hervás et al., Reference Hervás, Pérez, Giráldez, Mantecón, Almar and and Frutos2003; Mueller-Harvey, Reference Mueller-Harvey2006). Therefore, we evaluated the palatability to sheep and cattle of water containing small amounts of purified CT from grape (Vitus vinifera) seeds. This CT is expensive and therefore not practical for routine use with livestock; however, to the best of our knowledge it's the only purified CT available in large quantities. Trials with various concentrations of grape seed tannin (GST) in water were conducted to determine if sheep and cattle would develop a preference for water with GST in it and if they would prefer to drink water containing specific concentrations of this CT rather than water. Since there is now considerable evidence that ruminant livestock develop preferences for feeds and liquids that help them meet their nutritional needs and relieve ailments such as acidosis and gastrointestinal parasite infections (Burritt and Provenza, Reference Burritt and Provenza1992; Kyriazakis and Oldham, Reference Kyriazakis and Oldham1993; Provenza, Reference Provenza1995; Phy and Provenza, Reference Phy and Provenza1998; Villalba et al., Reference Villalba, Provenza and Shaw2006; Villalba and Provenza, Reference Villalba and Provenza2007; Lisonbee et al., Reference Lisonbee, Villalba, Provenza and Hall2009; Villalba et al., Reference Villalba, Provenza, Hall and Lisonbee2010), our hypothesis was: when consuming a high-quality forage diet, sheep and cattle would learn to prefer water that contained GST. However, because ruminants appear to need repeated exposure to a new flavor or food before they may develop a preference for it (Launchbaugh et al., Reference Launchbaugh, Provenza and Werkmeister1997), we anticipated that sheep and cattle would require repeated exposure to increasing concentrations of GST in water before they would learn to prefer water containing this tannin.
Material and methods
Animals and diets for sheep trial
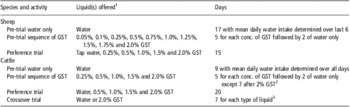
This trial was carried out first then followed by the cattle trials. Five mature Rambouillet ewes (74.5 ± 3.7 kg at the beginning of pre-trial period) were penned individually in 1.6 × 2.3 m2 side-by-side indoor pens in a barn with the temperature maintained at 13°C. They were fed lucerne (Medicago sativa) pellets (19% CP; 90% dry matter (DM)) at 2.7% of BW/day (DM basis) with half fed at 0800 h and the other half at 1530 h. The ewes consumed all lucerne pellets offered each day, and did not scour nor show any other signs of digestive problems that have been associated with lack of roughage in the diet. An outline of the sequence of activities for this trial is presented in Table 1. At the beginning of the pre-trial period, the ewes were given only tap water to drink for 17 days with each ewe's average daily water intake determined over the final 6 days. Then they were given increasing concentrations of CT (96% proanthocyanidins from grape seeds; Amax NutraSource, Inc.) in water to drink. Only one type of solution was given at a time during the pre-trial, and each solution was given for 5 days. Solutions were provided in 15-l buckets, and daily fluid intakes were determined by measuring the amount of fluid added to bring the fluid level back to a permanent mark on the inside of each container. The tannin was mixed with water and each concentration was offered to ewes in order to provide gradual exposure to GST solutions that provided them with 0.05%, 0.1%, 0.25%, 0.5%, 0.75%, 1.0%, 1.25%, 1.5%, 1.75% and 2.0% of their daily DM intake as tannin assuming they had the same mean daily water intake as they did during the final 6 days of the water-only phase of the pre-trial period. Results from previous research (Kronberg, Reference Kronberg2008 and Reference Kronberg2010) indicated that this was a valid assumption. After each 5-day period with a tannin solution, the ewes were offered water without GST for 2 days to give them a chance to rehydrate in case they had not drunk as much water as they desired when given only a tannin solution to drink. Tannin solutions were made at the beginning of each 5-day period and stored in 114-l plastic barrels with plastic sheets on top of the liquid to minimize tannin exposure to oxygen.
Sequences of activities for the sheep trial (first trial), the cattle preference trial (second trial) and the cattle crossover trial (last trial)

1GST = Grape seed tannin and each concentration was intended to provide the animals with the listed amount of GST (as % of daily dry matter intake) assuming they had the same daily water intake as during the initial period when daily water intake was measured.
2Jugular blood was collected on the 5th days after the heifers drank the 1.5% or 2% GST solutions and after drinking water for 7 days at the end of the pre-trial period.
3Jugular blood was also collected on the 7th day of each period of the crossover trial after heifers drank water or the 2% GST solution.
Immediately following the 87-day pre-trial period, the ewes were weighed (87.1 ± 3.9 kg) and the mean of their weights used to recalculate the amount of pellets fed and GST used to make five concentrations of tannin-water solutions for a 15-day preference trial, where pellets were offered at 2.7% of BW. For the trial, each ewe was simultaneously offered water and the following GST solutions, which were made as described above to provide: 0.25%, 0.5%, 1.0%, 1.5% and 2.0% of mean daily DM intake as tannin. The water and tannin solutions were offered in side-by-side buckets. Their daily intake of each solution was measured at 0830 h while the ewes were briefly removed from their pens, and the positions of the buckets were changed at 5-day intervals.
Animals and diets for cattle preference trial
Five yearling Angus heifers (296 ± 17 kg) were used for the trial and were individually penned in 3.5 × 5.8 m side-by-side outdoor pens, which had a canopy over them to prevent rain from entering their drinking containers and give them shade on hot sunny days. The heifers were fed lucerne pellets at 3.1% of BW/day (DM basis) and they ate all of them promptly on all days. Their feces appeared normal throughout the trial and they did not show any signs of digestive problems from eating the pelleted diet. Water containers had a capacity of 106 l. An outline of the sequence of activities of this and the other cattle trial is presented in Table 1. Average daily water intake was determined over 9 days at the beginning of the pre-trial period. The number of pre-trial tannin solutions that the heifers were exposed to was reduced to five (0.25%, 0.5%, 1.0%, 1.5% and 2.0% as described above) because the sheep responded better to the GST solutions than we expected and we anticipated a similar response from the cattle. Tannin solutions were stored in 189-l plastic barrels with floating impermeable tops to reduce tannin exposure to oxygen. Each solution was offered for 5 days, and after the 2.0% solution was offered, the heifers were given water to drink for 7 days.
Immediately following 7 days drinking water at the end of the pre-trial period, the heifers were reweighed (343 ± 16 kg) to ensure the correct feeding and tannin levels were offered during the preference trial. The preference trial was 20 days long during which the heifers were simultaneously offered water and the 0.5%, 1.0%, 1.5% and 2.0% tannin solutions with solutions in side-by-side 106-l containers. The position of the containers were not rotated during the trial because they were too heavy to move without spilling liquid from them, but the order of the concentrations of tannin and water in the row of containers was changed for each heifer such that no heifer had the same type of liquid in the same position in their row of containers. The heifers were not removed from their pens before intake of the solutions was measured but rather a temporary barrier was used to block access to all liquids while measurements were made.
During the final 6 days of the preference trial 4 kg of dry-rolled field peas (Pisum sativum; 25% CP and 3.84 Mcal/kg digestible energy (DE)) were substituted for 4 kg of lucerne pellets (19% CP and 2.65 Mcal/kg DE) for the morning feedings to determine if increasing their daily CP and DE intake would change their preferences for the solutions. The substitution of peas for some lucerne pellets was done at the normal time for morning feeding on day 15 after all fluid intakes were measured for the previous 24 h. All peas and lucerne pellets were consumed by all heifers on the 6 days that they were fed.
During the pre-trial period, jugular blood was collected at 1300 h from the heifers on the fifth days when the heifers had been drinking the 1.5% or 2.0% tannin solution (each for 5 days) and on day 7 of the water period. The blood was kept on ice until it was centrifuged at 1200 × g for 20 min to obtain plasma. The plasma was stored at −20°C until thawed and analyzed for urea N using a Sigma Diagnostic test kit (Sigma-Aldrich, St. Louis, MO, USA) following the procedure of Fawcett and Scott (Reference Fawcett and Scott1960) as modified by Chaney and Marbach (Reference Chaney and Marbach1962). Blood plasma urea concentration is closely correlated with urine urea concentration so it is a useful indicator of urine urea concentration (Zanton and Heinrichs, Reference Zanton and Heinrichs2009).
Animals and diets for cattle crossover trial
Immediately after the heifer preference trial ended, a two-period crossover trial was conducted in the same covered pens as described above with four of the heifers used in the preference trial. These heifers were fed only lucerne pellets at 3.1% of BW/day (DM basis) for this 2-week trial and they were fed at the same times and amounts each day as for the preference trial. Two heifers were given only the 2% GST solution to drink for 7 days, whereas another two heifers were given only water to drink for this week. Then for the second week, the solutions offered to the heifers were reversed. On the last day of each week, jugular blood was collected from each heifer at 1300 h and processed for urea concentration as described above.
Design and statistical analysis for all trials
Data on daily intake of water and each tannin solution as well as the total daily intake of all tannin solutions for each ewe or heifer was analyzed with a repeated measures design using the MIXED procedure (SAS, 1996) with individual animal (n = 5 per species) the random effect, type of liquids offered the fixed effect and daily liquid intakes the repeated measure. Unstructured, compound symmetry and heterogeneous compound symmetry covariance structures were compared for each analysis and the structure with the smallest value for adjusted Akaike's information criterion (AAIC) was used for the final analysis. Means were compared using pairwise differences of least squares means. Differences between treatment groups were considered significant at P ⩽ 0.10. For the heifer preference trial, data on blood plasma urea concentration were analyzed using the MIXED procedure of SAS with individual animal (n = 5) the random effect, type of liquid ingested the fixed effect and the concentration of urea on a particular day the repeated measure. A compound symmetry covariance structure was used for the analyses because it produced the smallest AAIC value. Differences between treatment groups were considered significant at P ⩽ 0.10. For the heifer crossover trial, data were analyzed using the MIXED procedure of SAS as described above. Differences between treatment groups were considered significant at P ⩽ 0.10.
Results
Sheep trial
During the long pre-trial period in which the ewes were gradually exposed to increasing amounts of GST in water, except for the final tannin concentration, only one or two ewes drank numerically similar or greater average daily amounts of a specific tannin solution compared with their average daily water intake during the 2 days that followed exposure to each tannin solution. The exception was the final 2.0% tannin solution in which four ewes had average daily intakes of this solution that were numerically greater than their average daily intake of water.
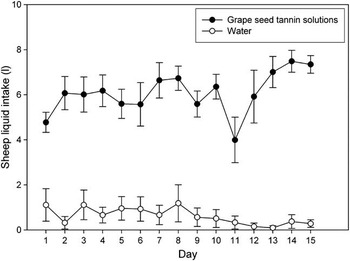
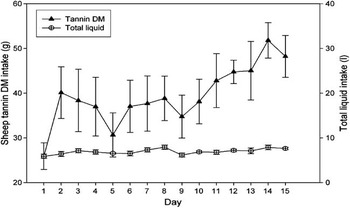
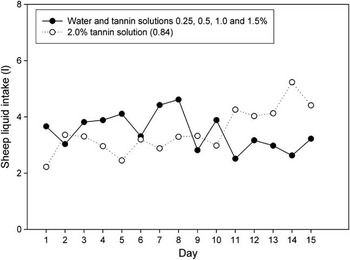
During the 15-day preference trial, mean daily water intake was 0.6 l and mean daily intake of the tannin solutions (combined total) was 6.1 l (Figure 1). There was a significant interaction between type of liquid consumed and day of the trial (P = 0.008) with mean intakes of water and tannin solutions varying from day to day. However, the sheep always drank considerably more (4 to 26×) of the tannin solutions than water. Mean total daily GST DM intake varied from a low of 25.9 g on the 1st day of the trial to a high of 51.8 g on the 14th day of the trial (P < 0.0001; Figure 2). Daily liquid intake varied from 5.9 to 7.9 l/day (P = 0.02; Figure 2). There were no differences in daily intakes of water and tannin solutions containing 0.25%, 0.50%, 1.0% and 1.5% tannin during the trial (P = 0.63) which totaled, on average, 3.5 l/day (Figure 3). In contrast, mean intake of the 2% tannin solution alone was 3.5 l/day, and the sheep drank more of this tannin solution than water on most days (except 1 and 5) of the trial (treatment by day interaction, P = 0.0001; Figure 3).
Sheep (n = 5) mean daily intakes (l) of water and all five grape seed tannin solutions (total for all tannin solutions) during the 15-day preference trial. Bars indicate standard error for each daily mean.

Sheep (n = 5) mean daily intake (g) of grape seed tannin dry matter (DM) and liquid (total l for all liquids) during the 15-day preference trial. Bars indicate standard error for each daily mean.

Sheep (n = 5) mean daily intakes (l) of the 2.0% grape seed tannin solution and total intake of water plus tannin solutions containing lower concentrations (0.25% + 0.5% + 1.0% + 1.5%), which had similar (P = 0.63) daily intakes, during the 15-preference day trial. S.e.m. for the 2% solution is in parentheses in the figure legend.

Cattle trials
When the heifers were exposed to gradually increasing concentrations of GST in water during the pre-trial period, only two of the five heifers drank numerically similar or greater average daily amounts of the 0.25% and 1.0% tannin solutions compared with their daily water intake during the 2 days that followed exposure to each tannin solution. All five heifers had average daily intakes of the 0.5% tannin solution that was numerically similar or greater than their average daily intake of water during the following 2 days, and four heifers had average daily intakes of the 1.5% and 2.0% tannin solutions that was numerically similar or greater than their average daily intake of water during the 2 days that followed exposure to each tannin solution.
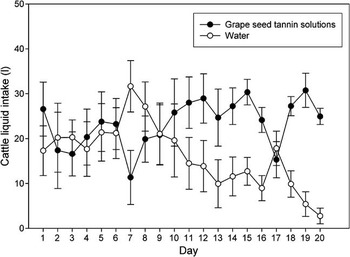
Comparing intake of water v. combined intake of all four tannin solutions, there was a significant interaction between type of liquid consumed and day of the trial (P < 0.0001; Figure 4). There was no consistent preference for either water or tannin solutions during the first 10 days of the trial (mean daily intakes of water and the tannin solutions were 21.8 and 20.6 l, respectively) but during the last 10 days a preference for tannin solutions over water (26.1 v. 10.8 l/day) became apparent.
Cattle (n = 5) mean daily intakes (l) of water and the total of all four grape seed tannin solutions during a 20-day preference trial. Bars indicate standard error for each daily mean.

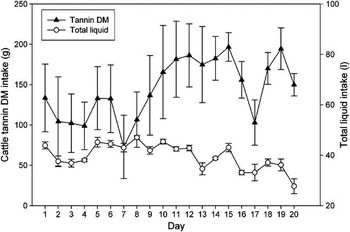
Mean daily intake of GST DM ranged from a low of 73 g on day 7 to 196 g on day 15, but there was not substantial day-to-day variation over the 20-day trial (P = 0.12; Figure 5). Variation between days was generally greater during the first 10 days of the trial than subsequently and GST intakes were relatively stable on days 11 to 15 before substitution of peas for lucerene pellets affected intake of GST solutions.
Cattle (n = 5) mean daily intake (g) of grape seed tannin dry matter (DM) and total daily intake (l) of all five liquids during the 20-day preference trial. Bars indicate standard error for each daily mean.

When 4 kg of rolled field peas (22% CP) were substituted for 4 kg of lucerne pellets (19% CP) on the morning of day 15, the 120 g increase in daily CP intake was associated with similar intakes of GST solutions and water on day 17 (P = 0.74), after which daily intakes averaged 27.6 l/day in total for the GST solutions and 6.0 l/day of water, which were different at (P ⩽ 0.02). The 120 g increase in daily CP intake appeared to temporarily disrupt the trend for tannin solution intake on days 16 and 17.
Total daily liquid intake varied between 27.7 and 47.0 l during the trial (P < 0.0001; Figure 5). S.e.m. for total daily liquid intake were small throughout the trial, and air temperature was not correlated with intake of either total liquids (R 2 = 0.13, P = 0.12) or GST solutions (R 2 = 0.002, P = 0.83).
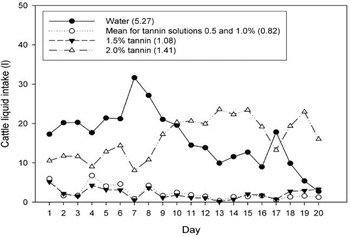
Comparison of water intakes with each of the four tannin solutions was more complicated and there were significant interactions between days for each of the four comparisons (P < 0.0001; Figure 6). For water v. the 0.5% and 1.0% tannin solution, which were not different, the heifers drank more (P ⩽ 0.08) water on the first 15 days and on day 17. However, their intakes of water and these two tannin solutions were similar (P ⩾ 0.12) on days 16, 18, 19 and 20. For water v. the 1.5% tannin solution, the heifers drank more (P ⩽ 0.10) water on days 1 to 11 and days 13, 15 and 17. Intakes of these two options were similar (P ⩾ 0.14) on the other days. Finally, for water v. the 2.0% tannin solution, there were no differences (P ⩾ 0.15) in intake of the two options on days 1 to 6, 9 to 12 and 14 to 18 with more (P < 0.05) water ingested on days 7 and 8 and more (P ⩽ 0.08) tannin solution ingested on days 13, 19 and 20.
Cattle (n = 5) mean daily intakes (l) of water and two concentrations of grape seed tannin (GST) solution (0.5, 1.0%, which were similar (P = 0.42)), and of 1.5% and 2.0% GST solution, which were all offered simultaneously during the 20-day preference trial. Standard errors of the means for the solutions are in parentheses in the figure legend.

Blood plasma urea concentrations measured during the pre-trial period were 17.8 and 16.7 mg/dl, respectively, when the 1.5% and 2.0% GST solutions were consumed (these concentrations were not different (P = 0.15)), and increased to 19.1 mg/dl (P = 0.02) after only water was consumed during the 7 days before the preference trial began. The lowering of plasma urea concentrations was also evident during the crossover trial when the values were 20.2 and 18.4, respectively, when water and the 2.0% GST solution were consumed (P = 0.10).
Discussion
Results from the sheep trial suggest that each ewe developed a preference for the 2.0% tannin solution either during their pre-trial exposure to each tannin solution or early in the preference trial. The reason for their preference for the 2% GST solution was not examined in this study, but it could have been because of improved protein nutrition since Villalba and Provenza (Reference Villalba and Provenza1997 and Reference Villalba and Provenza1999) demonstrated that sheep can develop preferences for flavors and feedstuffs that improve their protein nutrition. To the best of our knowledge, it is not known if GST can improve the protein nutrition of sheep and cattle, but Waghorn et al. (Reference Waghorn, John, Jones and Shelton1987a and Reference Waghorn, Ulyatt, John and Fisher1987b) have shown that the CT in Lotus corniculatus does this in sheep so it is reasonable to assume that tannin from other CT-containing plant species may also improve their protein nutrition.
The cattle appeared to take longer to develop a preference for tannin in water although their average daily intake of tannin DM did not change across the trial because of the large variation in daily tannin DM intake by individual heifers. When Villalba et al. (Reference Villalba, Provenza and Banner2002) offered sheep and goats a ration containing 15% quebracho tannin then supplemented the diets of groups of both sheep and goats with either energy or protein concentrates, they also observed differences between the two species in their response to and rates of increased intake of the tannin containing material.
The inconsistent intake of tannin solutions during the 20-day cattle preference trial occurred because some of the heifers were slow to drink the tannin solutions in the first half of the trial but all heifers drank the tannin solutions in the second half. Heifer initial response to increased CP intake on days 15 and 16 of the trial, which was decreased intake of tannin solutions, may have been because of short-term disruption of rumen digestion of CP and carbohydrates (Kyriazakis and Oldham, Reference Kyriazakis and Oldham1997; Reynolds and Kristensen, Reference Reynolds and Kristensen2008) which may have stabilized after day 17.
In respect to the higher plasma urea concentration after the heifers drank water v. lower urea concentration when they drank the 2.0% tannin solution, a similar increase in blood urea concentration was measured in yearling steers fed lucerne-pea cubes and drinking water containing small amounts of quebracho tannin (Kronberg and Liebig, Reference Kronberg and Liebig2011). Fernández et al. (Reference Fernández, Catanese, Puthod, Distel and Villalba2012) observed depressions in rumen ammonia and blood urea concentrations when sheep consumed a supplement containing quebracho tannin along with a 19% CP basal diet, and Grainger et al. (Reference Grainger, Clarke, Auldist, Beauchemin, McGinn, Waghorn and and Eckard2009) observed less feed nitrogen lost in urine when dairy cows were dosed with black wattle (Acacia mearnsii) tannin in water. The results of the present study, which are consistent with other studies, suggest that there was less microbial proteolysis of plant protein in the rumen and less urine urea excretion when the cattle drank the 2.0% GST solution.
An advantage to providing small amounts of CT to ruminants via drinking water, rather than in feed supplements, is that two or more tannin solutions could be provided along with water to allow the animals to self-regulate their tannin and water intake with potentially less impact on their forage or feed intake. Tannin intake can vary considerably among individual ruminants (Kronberg, Reference Kronberg2008 and Reference Kronberg2010) as a function of several factors including individual physiological and morphological differences and related variation in their response to tannins (Provenza et al., Reference Provenza, Villalba, Dziba, Atwood and Banner2003).
Summary
Both the sheep and cattle developed a preference for drinking water that had small amounts of purified GST in it. The sheep showed a preference for the tannin solutions early in their trial; whereas, the cattle did not show a preference until the second half of their trial. Although both sheep and cattle drank some of each of the tannin solutions, the solution that both sheep and cattle drank most during the second half of the trials was the 2% tannin solution. Our results suggest that sheep and cattle will voluntarily drink water with purified GST in it and may experience nutritional benefits with greater productivity and less environmental impact with respect to ammonia emission to the atmosphere. Our results also suggest that providing sheep and cattle with both water and a tannin solution to drink may provide optimal water and tannin intake since sheep and cattle in the present trials voluntarily drank water and tannin solutions daily. However, more research is needed to determine if putting small amounts of CT in water could become an effective and practical way to reduce urine urea excretion and improve the productivity of sheep and cattle.
Acknowledgments
The authors thank Clay Erickson, Faye Kroh, Stephanie Schmidt and Becky Wald (USDA, ARS, Northern Great Plains Research Laboratory, Mandan, ND) and Marsha Kapphahn (Department of Animal Sciences, North Dakota State University) for technical assistance with the study. We also thank John Grabber, Fred Provenza, Matt Sanderson, Eric Scholljegerdes and anonymous reviewers for helpful comments that improved the manuscript.