The 2012 presidential campaign takes place at a time of deep political division in the United States. Democrats and Republicans differ sharply over Barack Obama's performance in office as well as a wide range of issues ranging from government spending and health care to immigration and gay marriage. These divisions are shaping the strategies of the candidates and the outlook for November. Overwhelming majorities of Democrats and Republicans, including overwhelming majorities of independents who lean toward a party, can be expected to support their own party's nominee. As a result, the outcome will depend on which party does a better job of mobilizing its supporters and appealing to a small group of swing voters in 10 or 12 battleground states.
I have modified my Time for Change Model to take into account the impact of growing partisan polarization on presidential elections. The basic Time for Change Model uses three factors—the incumbent president's net approval rating at the end of June, the change in real GDP in the second quarter of the election year, and a first-term incumbency advantage—to predict the winner of the national popular vote. Based on the results of the 16 presidential elections since World War II, the estimates for the basic model are as follows:
 $$
{\rm PV} = 47.3 + (.107 * {\rm NETAPP}) + (.541 * {\rm Q2GDP}) + (4.4 * {\rm TERM1INC}).
$$
PV stands for the predicted share of the major party vote for the party of the incumbent president, NETAPP stands for the incumbent president's net approval rating (approval − disapproval) in the final Gallup Poll in June, Q2GDP stands for the annualized growth rate of real GDP in the second quarter of the election year, and TERM1INC stands for the presence or absence of a first-term incumbent in the race.
This basic model does an excellent job of predicting the outcomes of presidential elections. It has correctly predicted the winner of the popular vote in the last five presidential elections with an average error of about 2 percentage points. This is a margin of error that is close to that of the final preelection Gallup Poll. In the last four elections, however, including the last two elections involving first-term incumbent presidents, the basic model overestimated the winning candidate's vote share. The model predicted that Bill Clinton would receive slightly more than 57% of the major party vote in 1996 but he actually received less than 55%, and the model predicted that George W. Bush would receive slightly more than 53% of the major party vote in 2004 but he actually received slightly more than 51%.
THE POLARIZATION EFFECT
The unexpected closeness of all four presidential elections since 1996 suggests that growing partisan polarization is resulting in a decreased advantage for candidates favored by election fundamentals including first-term incumbents. This change is the product of a close division between party supporters within the electorate and a decrease in the willingness of voters to cross party lines to vote for any candidate from the opposing party including an incumbent. As a result, election outcomes tend to reflect the underlying division between supporters of the two major parties.
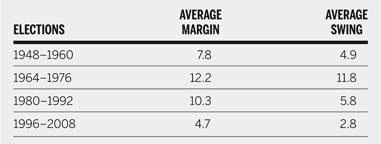
The data displayed in table 1 show that when we group the 16 presidential elections that have taken place since World War II into four sets of four consecutive elections, 1948–1960, 1964–1976, 1980–1992, and 1996–2008, the last four elections have had by far the closest average victory margins and smallest average interelection party swings. In fact, the last four presidential elections have produced the closest average victory margins and the smallest average interelection swings of any four consecutive elections in the past century. Most of the presidential elections in the past century have not been very close and large interelection swings have been common. The current situation is quite unusual.
Average Margin of Victory and Average Interelection Party Swing in Postwar Presidential Elections

Note: Margin based on overall vote; swing based on Democratic or Republican share of major party vote.
Source: Data compiled by author.
To incorporate the polarization effect into the Time for Change Model, I added a new predictor (POLARIZATION) for elections since 1996. For elections since 1996, the polarization variable takes on the value 1 when there is a first-term incumbent running or in open-seat elections when the incumbent president has a net approval rating of greater than zero; it takes on the value −1 when there is not a first-term incumbent running and the incumbent president has a net approval rating of less than zero. The estimates for the revised model are as follows:
 $$
{\rm PV} = 46.9 + (.105 * {\rm NETAPP}) + (.635 * {\rm Q2GDP}) + (5.22 * {\rm TERM1INC}) - (2.76 * {\rm POLARIZATION}).
$$
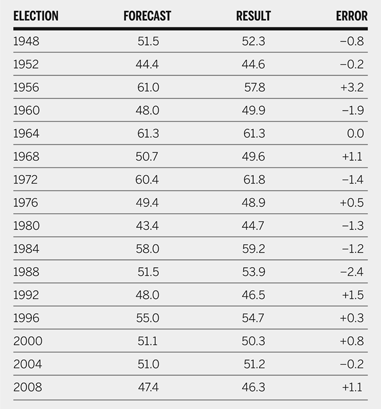
Adding the polarization correction to the basic model substantially improves its overall accuracy and explanatory power. All of the predictors have statistically significant effects including the new polarization term and the predictions for the four elections since 1996, including the two involving first-term incumbents, are much more accurate. In fact, the data displayed in table 2 show that the average out-of-sample forecasting error for all 16 postwar elections is only 1.1 percentage points, less than half of the average margin of error of the final preelection Gallup Poll during the same time. The correlation between the out-of-sample forecasts and the actual election results is an extraordinary .97, so the out-of-sample forecasts explain 94% of the variance in the election results. Finally, the out-of-sample forecasts correctly predict the winner of the popular vote in 15 of the 16 postwar elections.
Accuracy of Out-of-Sample Forecasts of Postwar Presidential Elections

Note: Based on share of major party vote for incumbent party candidate.
Source: Data compiled by author
The estimates for the revised model indicate that in the current era of partisan polarization, the advantage enjoyed by a first-term incumbent is less than half of what it was earlier—about 2.5 percentage points instead of 5.2 percentage points. This is not only a statistically significant difference; it is also a substantively significant difference. In the case of the 2012 election, it means that President Obama is likely to have a much tougher fight to win a second term than a first-term incumbent with similar approval numbers and economic conditions in the era before polarization.
With the release of the federal government's first estimate of GDP growth during the second quarter of 2012, all of the predictors used in the revised model are now available although the final GDP estimate will not be known until late September. President Obama's net approval rating in the final Gallup Poll in June was +2 percentage points (48% approval vs. 46% disapproval). And Obama's advantage as a first-term incumbent in the current era of polarization is 2.5 percentage points. Finally, real GDP growth was estimated at 1.5% during the second quarter of 2012.
Based on these values, the revised model including the polarization adjustment predicts a one percentage point victory for Barack Obama, 50.5% to 49.5%. Barring any changes in the second quarter GDP estimate, this is the closest popular vote margin predicted by the model in the entire postwar era although it is only slightly smaller than the 1.2 point margin predicted for Jimmy Carter in 1976. Moreover, based on the 16 out-of-sample forecasts, about one third of incumbent party candidates have fallen at least one-half percentage point below the share of the vote predicted by the model. This suggests than Barack Obama has about a two-thirds chance of winning the popular vote this year.
CONCLUSIONS
Growing partisan polarization has important implications for forecasting the outcome of the 2012 presidential election. With the American electorate both closely and deeply divided along party lines, we can expect another close election this year—probably closer than the 2008 election and possibly as close as the 2000 election.
Of course, the winner of the 2012 presidential election will actually be determined by the electoral vote. There is a very close relationship between the national popular vote and the electoral vote—the correlation between the two for the 16 elections since World War II is .97. The 2000 election is the only one since 1888 in which the winner of the popular vote did not also win the electoral vote. However, given the expected closeness of the popular vote in 2012, another Electoral College misfire has to be considered a possibility. In the end, the outcome could come down to one or two closely contested battleground states. And the next “Florida” might not be Florida—it might be Colorado, Ohio, or Virginia. According to the revised Time for Change Forecasting Model, one prediction seems very safe right now—it's going to be a long election night.