Introduction
Ruminant amphistomosis is an infection of cattle, sheep, goats and other wild ruminants caused by a severe infection with immature amphistomes in the small intestines of immunologically incompetent hosts (Dutt, Reference Dutt1980; Gupta, Reference Gupta1993). Amphistomosis occurs in many countries (Eduardo, Reference Eduardo1988) and the genera mainly associated with the disease in domestic ruminants have been described (Hanna et al., Reference Hanna, Williamson, Mattison and Nizami1988; Gupta, Reference Gupta1993). In Africa and other tropical countries the genera Paramphistomum Fischoeder (1901) and Calicophoron Nasmark (1937) are the most commonly encountered (Horak, Reference Horak1971; Rolfe et al., Reference Rolfe, Boray, Nichols and Collins1991) and Calicophoron microbothrium has been incriminated in the majority of outbreaks of amphistomosis in ruminants in southern Africa (Horak, Reference Horak1971; Over, Reference Over1982).
The pathogenicity of C. microbothrium, and other amphistomes in general, is caused by severe infections with juvenile flukes in the small intestines of susceptible hosts, causing severe gastroenteritis (Horak, Reference Horak1971). Using their acetabula, the immature flukes anchor and strangulate the intestinal mucosa as they migrate to the submucosa (Singh & Lakra, Reference Singh and Lakra1971; Dutt, Reference Dutt1980; Rolfe et al., Reference Rolfe, Boray and Collins1994). The strangulated mucosae become necrotic and eventually slough-off leaving raw erosions and petechiae (Boray, Reference Boray and Gaafar1971; Dutt, Reference Dutt1980) through which protein molecules can be lost (Horak, Reference Horak1966).
The clinical pathology associated with the pathogenicity of amphistome infections has been studied in sheep (Singh et al., Reference Singh, Sahai and Prasad1984; Boray, Reference Boray, Gafaar, Howard and Marsh1985; Misra et al., Reference Misra, Panda and Parida1996) but the haematological profiles have been inconsistent, varying from one study to the other. Nevertheless, a trend emerged that plasma protein loss occurs in ruminants infected with juvenile amphistomes (Pillai & Alikutty, Reference Pillai and Alikutty1995).
Clinical amphistomosis has been described in sheep and goats (Boray, Reference Boray1969; Rolfe et al., Reference Rolfe, Boray and Collins1994), in buffaloes (Panda & Misra, Reference Panda and Misra1980) and in cattle (Pillai & Alikutty, Reference Pillai and Alikutty1995). Besides Pillai & Alikutty's (Reference Pillai and Alikutty1995) report describing biochemical and haematological changes in one cow infected with an unknown amphistome species, no other reports describe the clinical pathology of amphistome infections in a bovine host. This study was therefore conducted to determine the haematological and biochemical changes in cattle experimentally infected with C. microbothrium.
Materials and methods
Study area and selection of experimental animals
The study was conducted at Grassland Research Station, a Government Farm in Marondera about 80 km south-east of Harare, Zimbabwe. The farm is amphistome-free and mainly raises Tuli cattle for commercial beef production. Prior to the commencement of the study, faecal samples were collected from 30 1-year-old Tuli-weaner steers for coprological examination using the sedimentation technique and the modified McMaster technique (Anonymous, 1986) to screen for trematode and nematode infections, respectively. Out of the 30 animals screened for the presence of gastrointestinal parasites, 16 parasite-free animals were selected randomly for the study on the basis of age and weight. The selected animals were allowed to graze in paddocks and had access to clean borehole water provided in concrete troughs and were de-wormed with 10% fenbendazole to control gastrointestinal nematodes, which was stopped a month prior to commencement of the study.
Parasite identity and production of metacercariae
Mature Bulinus tropicus snails naturally infected with C. microbothrium were collected from a small communal dam and maintained under laboratory conditions for periodic shedding of cercariae. Calicophoron microbothrium was presumed to be from cattle as they were the only livestock in that area frequenting the dam during grazing and when drinking water, and this was evidenced by the presence of cattle faeces only on the edges of the dam. The mass production of cercariae (Mavenyengwa et al., Reference Mavenyengwa, Mukaratirwa, Obwolo and Monrad2006) was achieved by confining 20 infected snails in individual small nylon gauze bags (aperture 2 mm), immersing each bag in a plastic cup carrying 500 ml pond water and exposing them to direct sunlight for 3 h. To confirm the identity of the parasite we were dealing with, the above collection procedure was used to collect cercariae from the naturally infected B. tropicus and infecting an amphistome-free sheep. The infected sheep was slaughtered at day 56 post-infection and the mature amphistomes from the rumen were recovered and identified as C. microbothrium using the methods described by Eduardo (Reference Eduardo1982, Reference Eduardo1983) and by Gupta (Reference Gupta1993).
Experimental infection of cattle
The metacercaria doses used in this study were based on data from Rolfe et al. (Reference Rolfe, Boray, Nichols and Collins1991) where fluke burdens ranging from 4000 to 20,000 were recovered from cattle, which had exhibited clinical disease before they were slaughtered. Also taken into consideration were viability studies conducted by Swart & Reinecke (Reference Swart and Reinecke1962), which showed that less than 50% of metacercariae ingested by ruminants establish and cause clinical disease. Using this information, 16 Tuli weaner steers aged 1 year were randomly divided into four equal groups (I–IV) and each group was infected with a different dose of C. microbothrium by injecting the metacercariae directly into the rumen using a trocha and cannula. On day zero, group I animals received a low dose (LD) of 5000 metacercariae each; group II, a medium dose (MD) of 15,000 metacercariae each, group III received a high dose (HD) of 25,000 metacercariae each while group IV animals remained as uninfected controls (C). The doses of metacercariae were estimated by counting the cysts in several aliquots as described by Rolfe et al. (Reference Rolfe, Boray and Collins1994).
The animals were monitored daily for the development of clinical signs until day 28 post-infection and, during the course of the study (on days 28, 42, 56 and 84), one animal from each group was randomly chosen, stunned using a stun gun and slaughtered to determine fluke infection levels.
Sample collection and processing
Ethylene diamine tetraacetic acid (EDTA) blood and sera were collected weekly from day zero post-infection to day 28 post-infection when sample collection was terminated. EDTA blood was processed for full blood count and eosinophils, while blood biochemical parameters including calcium, phosphorus, total protein and albumin were determined from sera. A Coulter T890 (Beckman Coulter, Brea, California, USA), was used for full blood count analysis while differentials for eosinophils were done manually using a light microscope. Staining using a modified Wright's stain was done using a Hema Tek 1000 machine (Bayer Diagnostics, Newbury, Berks, UK). An ACE clinical chemistry analyser (Alfa Wassermann, Woerden, The Netherlands), a spectrophotometry-based analyser, was used to determine blood biochemistry values.
Fluke recovery
Flukes were recovered following the method described by Mavenyengwa et al. (Reference Mavenyengwa, Mukaratirwa, Obwolo and Monrad2008). The small intestines of each animal were separated from the rest of the organs with minimal manipulation. Starting from the distal end of the jejunum, 1 m long small intestinal loops were selected, tied at both ends, cut and placed in labelled plastic containers for fluke recovery.
The distribution of flukes along the small intestines was established by scraping the mucosa from the intestinal segments to the level of the muscular tunic with glass slides. The contents of the abomasum, omasum and the reticulum were washed into separate containers and serially sieved under pressure through 2400 μm and 850 μm sieves, respectively. The mucosal scrapings were similarly sieved and the flukes collected at the bottom of a 10-litre capacity jar. Excess water was decanted and the recovered flukes preserved in 70% alcohol for identification and counting.
Data analysis
Values for the biochemical and haematological parameters were analysed using SPSS for windows, version 8.0 (SPSS Inc., Chicago, Illinois, USA). The mean values of the various parameters were compared among the different treatment groups at various stages of infection using analysis of variance (ANOVA). Pairwise comparisons of means were done using the 5% least significant difference (LSD) method and P values of less than or equal to 0.05 were considered significant.
Results
Clinical signs
All animals in the LD and C groups were clinically normal at every stage of slaughter. Three of the animals in the MD group developed a foul-smelling projectile diarrhoea from days 21 to 24 post-infection and thereafter two of the animals recovered. The diarrhoea in the third animal persisted for 1 week and the animal became anorexic, dehydrated, emaciated, lagged behind the group and never fully recovered until it was slaughtered at day 56 post-infection. No clinical signs were evident in the fourth animal in this group.
In the HD group a non-projectile diarrhoea developed in all animals at day 21 post-infection and persisted for 3 days before all the animals recovered. All the animals were clinically normal until the last slaughter at day 56 post-infection when the study was terminated.
Fluke numbers and distribution
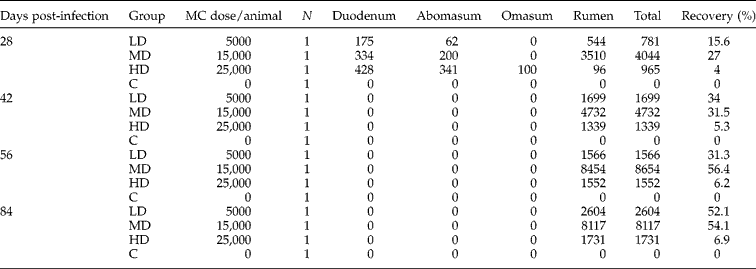
The distribution of flukes and the number recovered from the various gut sites are presented in table 1. In the LD and MD groups, the animals slaughtered at day 28 post-infection had immature flukes in the proximal third of the duodenum while the animal in the HD group had the majority of the immature flukes distributed along the proximal half of the duodenum. In all the infected animals slaughtered at day 28 post-infection, the majority of the immature flukes were concentrated along the oesophageal groove and along the anterior pillar of the rumen. From day 42 to 56 post-infection all the flukes were concentrated along the anterior pillars of the rumen. The percentage of flukes recovered at each slaughter point ranged from 4 to 56% among the infected groups at different days post-infection (table 1). The total recoveries in the late stages of the study tended to be higher in comparison with early stage recoveries.
Number of Calicophoron microbothrium recovered from different gut sites of four groups of cattle experimentally infected with different doses of metacercariae.
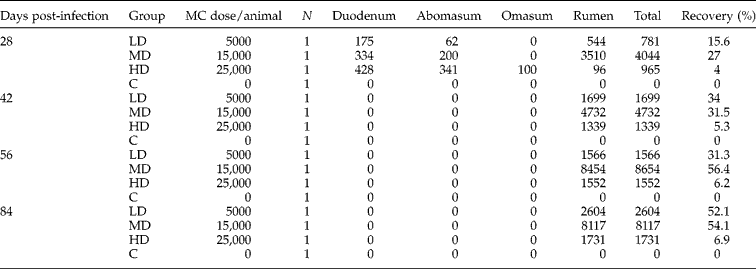
C, Control; HD, high dose; LD, low dose; MC, metarcercariae; MD, medium dose; N, number of cattle.
Total plasma protein and albumin
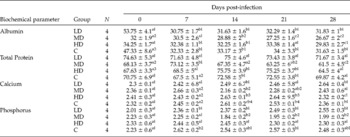
Mean total plasma protein levels for all the groups remained within the normal reference range (53–75 g/l) for the duration of the study, with no significant differences in values among the LD, HD and the C groups (table 2). However, the total plasma protein levels for the MD group decreased significantly (P < 0.05) from day 14 post-infection until day 28 post-infection. Similarly, the mean plasma albumin levels remained within the normal reference range (29–40 g/l) throughout the experiment for animals in LD, HD and the C groups and no significant differences in the mean values were noted amongst the three groups. In the MD group, the mean plasma albumin levels decreased significantly (P < 0.05) from day 14 post-infection in comparison with other groups and remained below the normal value range until the end of the study (table 2).
Mean total protein, albumin, calcium and phosphorus values (±SD) of different groups of cattle infected experimentally with Calicophoron microbothrium.

C, control; HD, high dose; LD, low dose; MD, medium dose. Data with a different superscript letter in the same column for each biochemical parameter are significantly different (P < 0.05). Data with a different superscript number in the same row for each group are significantly different (P < 0.05).
Calcium and phosphorus levels
The mean values for calcium and phosphorus levels for all the groups remained within the normal reference ranges of 2–3 mmol/l for calcium and 1.6–2.9 mmol/l for phosphorus and no specific trends were detected for the LD, HD and the C groups (table 2). However, calcium levels for the MD group decreased significantly (P < 0.05) from day 14 post-infection until day 21 and then rose significantly (P < 0.05) to levels similar to the first week of the study. Similarly, phosphorus levels for the MD group showed the same trend as calcium, decreasing significantly (P < 0.05) at days 14 and 28 post-infection, after which it rose to levels similar to the first week of the experiment (table 2).
Packed cell volume, haemoglobin and red blood cells
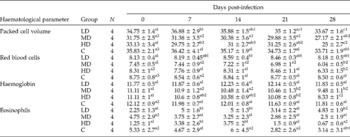
Mean packed cell volume (PCV), haemoglobin (Hb) and the red blood cell (RBC) values remained within the normal reference ranges of 24–46% for PCV, 8–15 g/l for Hb, and 5–1012/l for RBC during the study in all the groups, and no trends could be detected in the LD and C groups (table 3). However, the PCV levels decreased significantly (P < 0.05) in the HD and the MD groups at days 7 and 21 post-infection, respectively, and remained low in both groups for the rest of the study period. Similarly, RBC and Hb levels decreased significantly (P < 0.05) in the MD and the HD groups at days 7 and 28 post-infection, respectively, and remained low for the rest of the study period.
Mean haematocrit, red blood cells, haemoglobin and eosinophil values (±SD) of different groups of cattle experimentally infected with Calicophoron microbothrium.

C, Control; HD, high dose; LD, low dose; MD, medium dose; N, number of cattle. Data with a different superscript letter in the same column for each haematological parameter are significantly different (P < 0.05). Data with a different superscript number in the same row for each group are significantly different (P < 0.05).
Eosinophils
Circulating eosinophils remained within the normal reference range (0–20) in all the experimental groups. The eosinophil levels increased significantly (P < 0.05) in the LD and HD groups on day 7 post-infection and remained high until day 21, when they decreased significantly (P < 0.05) and remained at low levels similar to those at the beginning of the study (table 3). There were no significant differences in the levels of circulating eosinophils at any stage of infection in the MD group until day 35 post-infection when they decreased significantly (P < 0.05) until day 42 post-infection.
Discussion
The clinical pathology of acute amphistomosis in ruminants has been studied extensively, but exclusively in sheep, using data from both experimental and field infections (Boray, Reference Boray, Gafaar, Howard and Marsh1985; Misra et al., Reference Misra, Panda and Parida1996). This study is the first report on the clinical pathology of amphistomosis in cattle infected experimentally with different doses of C. microbothrium. The clinical signs exhibited in this study were similar to experimental and field observations made in other reports (Rolfe et al., Reference Rolfe, Boray and Collins1994; Pillai & Alikutty, Reference Pillai and Alikutty1995). However, polydypsia described in sheep (Horak, Reference Horak1966; Boray, Reference Boray1969) was not evident in this study and could have been missed since the experimental animals were allowed to fend for themselves in paddocks and were not under close observation.
The occurrence of clinical amphistomosis and subsequent clinical pathology in ruminants is dependent on the dose, the pathogenicity and the establishment levels of the metacercariae in the small intestine of the host (Horak, Reference Horak1967; Rolfe et al., Reference Rolfe, Boray and Collins1994). The metacercaria doses used in this study were adequate and reproduced the clinical disease for clinico-pathological studies. The parasite establishment rates obtained for the LD and MD groups are comparable to those obtained by Horak (Reference Horak1967) and elicited expected clinical trends of the disease. However, parasite establishment in the HD group was low and could be related to either complete failure of parasite establishment or overcrowding of the immature amphistomes in the small intestine and subsequent expulsion of unestablished parasites by the host during the diarrhoeic phase of the infection (Boray, Reference Boray1969). The highest number of immature amphistomes was recovered from the small intestines of the HD group, making the latter hypothesis more likely. It is also evident that fluke migration to the rumen was slow in the HD group and only a small proportion of the flukes had migrated to the rumen by day 28 post-infection. Similar trends have been observed in sheep heavily infected with immature amphistomes (Rolfe et al., Reference Rolfe, Boray and Collins1994). Overall, the fluke numbers recovered at day 28 post-infection in all groups were low and this might have been due to the limitation of the method we used to recover the immature flukes in the intestinal mucosa. The fluke establishment rates had a bearing on clinical disease manifestation, with major symptoms of disease and clinical pathology being more evident in the MD group where fluke establishment was, on average, higher than the other groups. In the LD group, fluke establishment was comparable to the MD group but it would appear the dose used was not adequate to produce disease in the host.
The decrease in total plasma protein levels observed in this study is probably related to the pathogenic mechanism of amphistomes which, upon infection and excystment in the small intestine, cause tissue destruction during the migratory phase through the tunica muscularis to the submucosa (Singh & Lakra, Reference Singh and Lakra1971). During the migratory phase, the immature flukes attach to the mucosa using acetabula (Dutt, Reference Dutt1980; Rolfe et al., Reference Rolfe, Boray and Collins1994) and cause strangulation of the engulfed mucosa. The strangulated tissues become necrotic and eventually slough-off leaving raw erosions and petechiae (Dutt, Reference Dutt1980) through which protein molecules can be lost (Horak, Reference Horak1966). The decrease in total plasma protein concentration appeared to be almost entirely due to a drop in plasma albumin concentration, which decreased simultaneously. Protein loss commenced on day 14 post-infection and probably coincided with the excystment of amphistomes in the small intestine and subsequent migration into the submucosa, creating avenues for protein loss. The changes observed in this study are similar to those described by Horak & Clark (Reference Horak and Clark1963) when they conducted similar studies in sheep and also corroborate the findings of Pillai & Alikutty (Reference Pillai and Alikutty1995) who described hypoproteinaemia in a cow infected with amphistomes of an unidentified species. However, in this study, a significant drop in total plasma protein and plasma albumin concentrations was only observed in the MD group where fluke establishment was high.
The decrease in the mean calcium and phosphorus values in the MD group coincided with the protein loss, which commenced on day 14 post-infection. The loss of calcium would be expected as 30–50% of total blood calcium in domestic ruminants is bound to proteins, including albumin (Kaneko, Reference Kaneko and Kaneko1989), and thus a loss of albumin automatically leads to a loss of calcium and a subsequent physiological phosphorus loss. A similar result was obtained in sheep infected experimentally with C. microbothrium (Horak & Clark, Reference Horak and Clark1963).
Although the mean values for the PCV, Hb and RBC varied within the normal reference ranges for all the treatment groups, analysis of the results showed a tendency towards anaemia, particularly for the MD and the HD groups. This is in contrast to the findings of Horak & Clark (Reference Horak and Clark1963), where sheep experienced absolute and relative polycythaemia following a marked drop in plasma protein concentration and a drop in plasma volume. Several authors have reported a tendency towards a subclinical anaemia in heavy amphistome infections in sheep and cattle (Panda & Misra, Reference Panda and Misra1980; Singh et al., Reference Singh, Sahai and Prasad1984; Boray, Reference Boray, Gafaar, Howard and Marsh1985; Pillai & Alikutty, Reference Pillai and Alikutty1995; Misra et al., Reference Misra, Panda and Parida1996). The mechanisms of anaemia development have been controversial and linked to the blood-feeding habits of the amphistomes and haemorrhage that occurs as the parasite migrates to the submucosa (Singh et al., Reference Singh, Sahai and Prasad1984; Misra et al., Reference Misra, Panda and Parida1996). However, blood feeding is not a feature of amphistomes as demonstrated by Deorani & Jain (Reference Deorani and Jain1969), where only ingested epithelial tissues with no RBCs were found in the gut of the parasite. While destruction of mucosal tissues and haemorrhage occurs during parasitic migration, no report describes the presence of blood in the intestines in sufficient quantities to warrant a relationship between mucosal haemorrhage and development of anaemia. While Horak (Reference Horak1971) suggested that anaemia is related to certain species of amphistomes, it is our opinion that subclinical anaemia that is associated with amphistomosis might be related to protein loss and anorexia, particularly in subacute active disease. In such cases, the appetite and nutritional status of the affected animals should be assessed before a diagnosis of blood loss anaemia is claimed. However, despite the hypotheses so far described, the mechanisms of the subclinical anaemia that ensues in amphistomosis remains obscure.
Circulating eosinophilia has been reported to be a feature of helminth infections (Ovington & Behm, Reference Ovington and Behm1997; Rainbird et al., Reference Rainbird, Macmillan and Meeusen1998) and in this study circulating eosinophils peaked in the LD and HD groups at days 7 and 14 post-infection. After this period the eosinophil levels fluctuated among the groups. The eosinophil peak that occurred at days 7 and 14 post-infection probably coincided with the parasite excystment and penetration into the gut wall. This would be expected since parasite antigens are believed to activate eosinopoiesis in the bone marrow (Ovington & Behm, Reference Ovington and Behm1997). However, from this study, considering the magnitude of the eosinophil response elicited by the infection among the infected groups, eosinophilia does not seem to be a feature in primary C. microbothrium infections in cattle.
While this study might have been compromised by possible poor parasite establishment rates, particularly in the HD group, it has demonstrated the clinico-haematological events that occur in acute bovine amphistome infection and is the first report of this kind. The loss of albumin, calcium and the presence of subclinical anaemia, together with the consistent and characteristic foul-smelling diarrhoea in heavy infections, may be used be used as a baseline in further studies to establish a presumptive diagnosis of the disease.
Acknowledgements
DANIDA through the ENRECA-Livestock Helminths Research Project is acknowledged for the provision of funds. Our tribute also goes to all support staff in the Paraclinical Department, University of Zimbabwe (UZ) for their assistance in the collection of samples, staff in the Clinical Pathology Laboratory, UZ, for assisting in the processing of samples, and Ms Munyombwe for her assistance in data analysis.