


Introduction
Allorecognition is the ability of an organism to detect and distinguish between self and non-self tissues within the same species (Buss, Reference Buss1982; Dishaw and Litman, Reference Dishaw and Litman2009; Nydam et al., Reference Nydam, Stephenson, Waldman and De Tomaso2017). Allorecognition has been found in all taxa across the tree of life, including bacteria (Gibbs et al., Reference Gibbs, Urbanowski and Greenberg2008), fungi (Glass et al., Reference Glass, Jacobson and Shiu2000), angiosperms (Allen and Hiscock, Reference Allen, Hiscock and Franklin-tong2008), tunicates (Burnet, Reference Burnet1971), and jawless fish (Burnet, Reference Burnet1971). Xenorecognition is the process of discriminating between self and non-self tissues in different species, and aside from corals (reviewed in Rinkevich, Reference Rinkevich2004), it has primarily been studied in a very specific context: how human T-cells, natural killer cells, and macrophages respond to mouse or pig cells (Yun and Yang, Reference Yun and Yang2024). In the context of the many marine species that are colonial, competition for space necessitates complex interactions within and between species (Grosberg and Plachetzki, Reference Grosberg, Plachetzki, Breed and Moore2010). Physical contact between colonies of different species may result in no reaction (Hirose et al., Reference Hirose, Shirae and Saito2002), aggression (Genin et al., Reference Genin, Karp and Miroz1994; Peach and Hoegh-Guldberg, Reference Peach and Hoegh-Guldberg1999), or rejection (Hirose et al., Reference Hirose, Shirae and Saito2002), while similar contact between colonies of the same species leads to aggression, rejection, or fusion (Grosberg and Plachetzki, Reference Grosberg, Plachetzki, Breed and Moore2010). When xenorecognition (between colonies of different species) and allorecognition (between unrelated colonies of the same species) both result in rejection reactions, are the processes at the genetic and cellular level also the same, or do allorecognition and xenorecognition occur via different molecular pathways? Answering this question requires an understanding of the genetic underpinnings of both allorecognition and xenorecognition, which is not currently available in any marine colonial species. However, in colonial ascidians of the Family Styelidae, this question can be approached through an analysis of the two genes serving as the allorecognition determinants.
Ascidians are sessile marine invertebrates, and 61% of the described species are colonial (Shenkar and Swalla, Reference Shenkar and Swalla2011). Ascidians belong to the Class Ascidiacea of the Subphylum Tunicata, the taxon that diverged over 600 Ma ago from its sister taxon, the Subphylum Vertebrata (Grosberg and Plachetzki, Reference Grosberg, Plachetzki, Breed and Moore2010). Ascidians are therefore the closest extant invertebrate relatives to humans (Delsuc et al., Reference Delsuc, Philippe, Tsagkogeorga, Simion, Tilak, Turon and Douzery2018). Botryllid ascidians are a clade of 53 colonial ascidian species from the Family Styelidae of the Order Stolidobranchia (Nydam et al., Reference Nydam, Lemmon, Cherry, Kortyna, Clancy, Hernandez and Cohen2021).
Xenorecognition in botryllid ascidians has been observed in the laboratory (Taneda et al., Reference Taneda, Saito and Watanabe1985; Hirose et al., Reference Hirose, Shirae and Saito2002; Saito, Reference Saito2003). While fusion has never been observed, there are different types of xenorecognition-mediated rejections that depend on the species in contact: intense rejection in both colonies in contact, intense rejection in one colony and no reaction in the other, and no reaction in both colonies (Taneda et al., Reference Taneda, Saito and Watanabe1985). The cellular processes of rejection in xenorecognition and allorecognition are very similar, although the initiation of the process is much slower in xenorecognition (Taneda et al., Reference Taneda, Saito and Watanabe1985; Saito, Reference Saito2003). Specifically, xenorecognition and allorecognition rejections in Botryllus primigenus and Botrylloides simodensis show attachment of blood cells to the walls of the ampullae (terminal projects of the vascular network), cluster formation of blood cells in blood vessels, shrinking, amputation, and/or withdrawal of ampullae, and movement of blood cells into the tunic (Saito, Reference Saito2003). These similarities have led to the hypothesis that the same mechanisms are involved in xenorecognition and allorecognition rejection (Saito, Reference Saito2003).
The highly polymorphic FuHC locus regulates allorecognition in Botryllus schlosseri and presumably other botryllid ascidian species (De Tomaso and Weissman, Reference De Tomaso and Weissman2003; De Tomaso et al., Reference De Tomaso, Nyholm, Palmeri, Ishizuka, Ludington, Mitchel and Weissman2005). The FuHC locus in B. schlosseri includes two independent genes separated by a 227 bp intergenic region: a secreted gene that is 17 exons in length, termed FuHC-sec, and a transmembrane gene that is 15 exons in length, termed FuHC-tm (Nydam et al., Reference Nydam, Netuschil, Sanders, Langenbacher, Lewis, Taketa and De Tomaso2013a). Individuals that share at least one FuHC-sec and at least one FuHC-tm protein allele will fuse and often form a chimeric colony, whereas those that do not will engage in a rejection reaction (De Tomaso et al., Reference De Tomaso, Nyholm, Palmeri, Ishizuka, Ludington, Mitchel and Weissman2005; Nydam et al., Reference Nydam, Netuschil, Sanders, Langenbacher, Lewis, Taketa and De Tomaso2013a).
In order to address the question, ‘Are the same mechanisms involved in allorecognition and xenorecognition reactions in botryllid ascidians?,’ we took a genetic approach. We sequenced FuHC-sec and FuHC-tm from two Botryllus and four Botrylloides species, and created pairwise alignments of all combinations of species within each genus. We then calculated the percentage of species-specific amino acids at each exon. Similar patterns of species-specificity within and between species could provide evidence for similar mechanisms of allo- and xenorecognition rejections.
Materials and methods
Sampling
Colonies from Botrylloides diegensis, Botrylloides giganteus, Botrylloides niger, and Botrylloides violaceus were collected from harbours and marinas across Southern California, Panama, Belize, France, and the United Kingdom. A single system from each individual colony was cut with a razor and immediately placed in RNAlater® (Thermo Fisher Scientific, Waltham, MA, USA) before being transferred to storage at −80°C.
Mitochondrial COI sequencing
Because morphological identification of Botrylloides and Botryllus in the field can be difficult, all samples except for B. giganteus were first identified to species through amplification and sequencing of the mitochondrial cytochrome oxidase I gene. Genomic DNA was extracted from the tissue of each colony using the Nucleospin Tissue Kit® (Macherey-Nagel, Düren, Germany). Polymerase Chain Reaction (PCR) amplification was performed with Phusion High-Fidelity DNA Polymerase (New England Biolabs, Ipswich, MA, USA). Phusion reactions consisted of 20 μl total reaction volume with 10.8 μl of nuclease-free water, 4 μl of 5× HF buffer, 0.4 μl of 10 mM dNTPs, 0.6 μl of 100% DMSO, 0.2 μl of Phusion polymerase, 1 μl of 10 μM forward primer, 1 μl of 10 μM reverse primer, and 2 μl of 50–500 ng/µl DNA template. A nested PCR approach was used. DNA templates were amplified with dinF/nux1R primers (Salonna et al., Reference Salonna, Gasparini, Huchon, Montesanto, Haddas-sasson, Ekins, McNamara, Mastrototaro and Gissi2021), and these PCR products were diluted 1:100 in nuclease-free water. This dilution was then used as the DNA template for amplification with cat1F/ux1R primers (Salonna et al., Reference Salonna, Gasparini, Huchon, Montesanto, Haddas-sasson, Ekins, McNamara, Mastrototaro and Gissi2021). PCRs were performed using the following thermocycling conditions: 98℃ for 30 sec, 35× (98℃ for 10 sec, 48℃ for 30 sec, 72℃ for 30 sec), 72℃ for 5 min. PCR products were visualized on an agarose gel and sent for Sanger sequencing in both directions at the Eurofins Genomics sequencing facility in Louisville, KY. Sequences were aligned and edited in the Aligner 10.0.2 software (CodonCode Corporation, Centerville, MA). Edited sequences were exported and compared to nucleotide sequences in the GenBank database using BlastN. Species identities were confirmed by 100% matches to sequences on GenBank that had been deposited by ascidian taxonomy experts.
FuHC gene sequencing
Total RNA was extracted from a separate piece of the same colony extracted for genomic DNA. The NucleoSpin RNA Kit® (Macherey-Nagel, Düren, Germany) was used for all species except for B. diegensis. The Monarch Spin RNA Isolation Kit® (New England Biolabs, Ipswich, MA) was used for B. diegensis. Single-stranded cDNA was synthesized using SuperScript III reverse transcriptase (Invitrogen, Carlsbad, CA, USA) and an oligo (dT) primer. Species-specific primers for FuHC genes were designed from transcriptomic data sequenced from a single individual per species (Rodriguez-Valbuena et al., unpublished). Primer sequences are available in Supplementary Material 1. cDNA was then amplified in an 18.5 μl total reaction volume with 10.8 μl of nuclease-free water, 4 μl of 5× HF buffer, 0.4 μl of 10 mM dNTPs, 0.6 μl of 100% DMSO, 0.2 μl of Phusion® High-Fidelity DNA Polymerase (New England Biolabs, Ipswich, MA), 1 μl of 10 μM forward primer, 1 μl of 10μM reverse primer, and 0.5 μl of cDNA template. The thermocycling conditions for B. diegensis were 35× (98℃ for 30 sec, 59℃ for 30 sec, 72℃ for 2 min), 72℃ for 5 min. The thermocycling conditions for B. giganteus, B. niger, and B. violaceus were 35× (98℃ for 30 sec, 50℃ for 30 sec, 72℃ for 2 min), 72℃ for 5 min. Amplified PCR products were visualized on an agarose gel and cleaned with the QIAquick PCR Purification Kit® (Qiagen, Hilden, Germany). Poly-A tails were added to the PCR products, which were then ligated and transformed into JM109 E. coli cells using the pGEM®-T Easy Vector kit (Promega, Madison, WI). Single clones were amplified in a 10-μl total reaction volume with 2 mM MgCl2, 0.2 mM dNTPs, 1 μl of 10X buffer (50 mM KCl, 20 mM Tris [pH 8.4]), 0.2 μM of m13F primer, 0.2 μM of m13R primer, 0.08 U of NEB Standard Taq Polymerase (New England Biolabs, Ipswich, MA) and 1 μl of template DNA. The cycling conditions were 35× (95℃ for 30 sec, 57℃ for 1 min, 72℃ for 1 min). The length of the insert in each clone was then examined on an agarose gel. Inserts of the correct length were Sanger sequenced in both directions at the Eurofins Genomics sequencing facility in Louisville, KY. The forward and reverse sequences for every insert were aligned to create consensus sequences in the Aligner 10.0.2 software (CodonCode). The consensus sequences of all inserts for each individual were then aligned to identify one or both nucleotide alleles. For FuHC-sec, 12 nucleotide alleles were obtained for B. diegensis, 20 for B. giganteus, 11 for B. niger and 19 for B. violaceus (Table 1). For FuHC-tm, 1 nucleotide allele was obtained for B. diegensis, 21 for B. giganteus, 9 for B. niger and 16 for B. violaceus (Table 1).
Number of retrieved FuHC alleles from each species

Table 1 Long description
For FuHC-sec, 12 nucleotide alleles were obtained for B. diegensis, 20 for B. giganteus, 11 for B. niger and 19 for B. violaceus. For FuHC-tm, 1 nucleotide allele was obtained for B. diegensis, 21 for B. giganteus, 9 for B. niger and 16 for B. violaceus.
Sequence alignment and phylogenetic tree construction
A subset of FuHC-sec and FuHC-tm nucleotide alleles for B. diegensis, B. giganteus, B. niger, and B. violaceus were aligned with FuHC-sec and FuHC-tm sequences from Botryllus gaiae and Botryllus schlosseri (Nydam et al., Reference Nydam, Stephenson, Waldman and De Tomaso2017), as well as B. tuberatus as the outgroup, in Aligner 10.0.2 software (CodonCode) using the Muscle Algorithm. The FuHC-sec alignment was 91 sequences (9 B. diegensis, 7 B. giganteus, 11 B. niger, 16 B. violaceus, 11 B. gaiae, 25 B. schlosseri, 11 either B. gaiae or B. schlosseri (could not be genotyped) and 1 B. tuberatus). The FuHC-tm alignment included 99 sequences (18 B. giganteus, 7 B. niger, 16 B. violaceus, 19 B. gaiae, 26 B. schlosseri, 12 either B. gaiae or B. schlosseri (could not be genotyped), and 1 B. tuberatus).
ModelTest NG 0.1.7 was used on the CIPRES Science Gateway (Miller et al., Reference Miller, Pfeiffer and Schwartz2010) to determine the correct substitution model for the alignment, which was HKY + I + G4 for both FuHC-sec and FuHC-tm. Phylogenetic trees were created using the CIPRES Science Gateway (Miller et al., Reference Miller, Pfeiffer and Schwartz2010), specifically RAxML HPC 8.2.12 on BlackBox (Stamatakis, Reference Stamatakis2014) and MrBayes 3.2.7a on ACCESS (Ronquist et al., Reference Ronquist, Teslenko, Van Der Mark, Ayres, Darling, Höhna and Huelsenbeck2012). Maximum likelihood inference on RAxML began with 100 runs, and node support was evaluated by 1,000 bootstrap replications. For the Bayesian tree, four Markov chain Monte Carlo chains were run for 50 million generations with sampling every thousand generations. Two runs were completed. The likelihood scores of the combined runs were assessed with Tracer 1.7.1 (Rambaut et al., Reference Rambaut, Drummond, Xie, Baele and Suchard2018) for convergence and to allow for burn-in, which was set at 10%. A majority rule consensus tree was then made from the remaining trees. FigTree v.1.4.4 was used to format both trees (Rambaut, Reference Rambaut2018).
Determination of species-specificity
The nucleotide sequences for each species for each gene were aligned and translated in all six reading frames in CodonCode Aligner. For the Botrylloides species, the number of sequences is listed in Table 1. For the Botryllus species, the number of sequences for FuHC-sec was 26 for B. gaiae and 73 for B. schlosseri, and the number of sequences from FuHC-tm was 51 for B. gaiae and 76 for B. schlosseri. The open reading frame was determined, aided by a +1 translation using the online ExPasy tool. Exon boundaries for each gene were determined from B. schlosseri and marked using tags in CodonCode Aligner (De Tomaso et al., Reference De Tomaso, Nyholm, Palmeri, Ishizuka, Ludington, Mitchel and Weissman2005). The amino acid(s) for each position (e.g. Exon 5, amino acid position 1) were noted for each species and each gene. A BlastP pairwise alignment of the sequences obtained from the transcriptome (in the case of the Botrylloides species) or from De Tomaso et al. (Reference De Tomaso, Nyholm, Palmeri, Ishizuka, Ludington, Mitchel and Weissman2005) (in the case of the Botryllus species) was then used to correctly align the amino acid positions for each pairwise species comparison. For each amino acid position, a ‘0’ was noted if the amino acid(s) were shared between the two species and a ‘1’ was noted if the amino acid(s) were not shared between the two species. Percent specificity for each exon was calculated by summing the ‘0’ and ‘1’s and dividing by the number of amino acid positions in the exon.
Each of the Botrylloides species (B. diegensis, B. giganteus, B. niger, and B. violaceus) was compared to each of the other three Botrylloides species, and B. schlosseri was compared to B. gaiae. Botrylloides and Botryllus sequences are too divergent for meaningful comparisons of exon-by-exon species specificity between genera.
Primers for the four Botrylloides species (B. diegensis, B. giganteus, B. niger, B. violaceus) were developed from the single transcriptome sequence we obtained from each species for each gene, and the primers that successfully PCR-amplified sequences were not always the primers at the 5’ end of the transcript (see Supplementary Material 1). For FuHC-sec, our B. diegensis sequences started at the fourth amino acid in Exon 3, B. giganteus at the 18th amino acid in Exon 4, and B. niger at the 1st amino acid in Exon 3. For FuHC-tm, our B. diegensis sequences started at the 20th amino acid in Exon 4, B. giganteus at the 1st amino acid in Exon 1, B. niger at the 7th amino acid in Exon 1, and B. violaceus at the 1st amino acid in Exon 1. Analysis of species-specific differences in regions that were not PCR-amplified (e.g. Exons 1 and 2 for B. niger FuHC-sec) came from the single transcriptome sequence. B. gaiae and B. schlosseri sequences came from Nydam et al. (Reference Nydam, Stephenson, Waldman and De Tomaso2017) and started at the 1st amino acid of Exon 2 for FuHC-sec and the 1st amino acid of Exon 3 for FuHC-tm.
Simple Modular Architecture Research Tool (SMART) version 10 on the EMBL website (Letunic and Bork, Reference Letunic and Bork2026) in normal mode was used to identify domains associated with FuHC-sec and FuHC-tm proteins in B. diegensis, B. giganteus, B. niger, B. violaceus, and B. schlosseri.
Results
Figures 1 and 2 show FuHC-sec and FuHC-tm trees using Bayesian inference, with Supplementary Materials 2 and 3 trees from RAxML. Supplementary Material 4 shows the full pairwise BlastP results for both FuHC-sec and FuHC-tm sequences for Botrylloides, including bit score, e-values, positives, identities and gaps. The percent identities are represented in Table 2.
FuHC-sec sequences in a phylogeny created in MrBayes 3.2.7a. B. dieg is an abbreviation for Botrylloides diegensis, and B. gig is an abbreviation for Botrylloides giganteus. The scale bar represents the number of nucleotide substitutions per site.

Figure 1 Long description
The phylogenetic tree is oriented vertically, depicting evolutionary relationships among Botryllus and Botrylloides species. The tree includes an outgroup labeled Botryllus tuberatus. The main branches are divided into several clades, each representing different species. The right side of the tree is color-coded with labels: Botryllus gaiae/Botryllus schlosseri in blue, B. dieg in green, B. niger in yellow, B. gig in pink, and Botrylloides violaceus in orange. Each clade contains multiple nodes with labels such as BsCU15, BsBP13, BsHPM12, and others, indicating specific sequences or samples. The branches are marked with numerical values representing support or confidence levels, such as 0.91, 1, and 0.68. The scale bar at the bottom represents 0.2 nucleotide substitutions per site, indicating genetic distance. The tree structure shows branching patterns, with some branches merging and others splitting, illustrating the evolutionary divergence and relationships among the species.
FuHC-tm sequences in a phylogeny created in MrBayes 3.2.7a. B. dieg is an abbreviation for Botrylloides diegensis, and B. gig is an abbreviation for Botrylloides giganteus. The scale bar represents the number of nucleotide substitutions per site.

Figure 2 Long description
The phylogenetic tree displays relationships among Botryllus and Botrylloides species. The tree is oriented vertically with branches extending from a common ancestor at the bottom. The outgroup, Botryllus tuberatus, is labeled at the top. The main branches are labeled with support values, such as 0.53 and 0.72, indicating confidence levels. The tree includes several clades, each representing different species or groups. On the right, color-coded labels identify species: Botryllus gaiae/Botryllus schlosseri in blue, Botrylloides violaceus in orange, B. niger in green, and B. giganteus in pink. The scale bar at the bottom represents 0.07 nucleotide substitutions per site. Each branch is labeled with specific identifiers, such as BScP01 and BScP02, indicating individual samples or sequences within the clades.
Percent identities between Botrylloides species for FuHC-sec and FuHC-tm

Table 2 Long description
Supplementary Material 4 shows the full pairwise BlastP results for both FuHC-sec and FuHC-tm sequences for Botrylloides, including bit score, e-values, positives, identities and gaps. The per cent identities are represented in Table 2. The phylogenetic trees indicate that B. diegensis and B. niger are sister taxa, corroborated by the high BlastP per cent identity between the two species (78% for FuHC-sec and 92% for FuHC-tm) (Figures 1 and 2, Table 2). B. giganteus is the sister clade to the B. diegensis/B. niger clade (Figures 1 and 2), with 45% identity between B. giganteus/B. diegensis and B. giganteus/B. niger for FuHC-sec, and 77-78% identities between B. giganteus/B. diegensis and B. giganteus/B. niger for FuHC-tm (Table 2). B. violaceus is the sister clade to the B. diegensis/B. giganteus/B. niger clade (Figures 1 and 2), with an average identity between B. violaceus and B. diegensis/B. giganteus/B. niger of 38.67% for FuHC-sec and 76.67% for FuHC-tm (Table 2). The Botryllus gaiae/Botryllus schlosseri clade is separate from the Botrylloides clade (Figures 1 and 2). The percent identity between B. gaiae and B. schlosseri is 99% for FuHC-sec and 88% for FuHC-tm. All of the phylogenetic relationships evidenced by FuHC-sec and FuHC-tm trees are identical to those from nuclear loci (Nydam et al., 2021).
The phylogenetic trees indicate that B. diegensis and B. niger are sister taxa, corroborated by the high BlastP percent identity between the two species (78% for FuHC-sec and 92% for FuHC-tm) (Figures 1 and 2, Table 2). B. giganteus is the sister clade to the B. diegensis/B. niger clade (Figures 1 and 2), with 45% identity between B. giganteus/B. diegensis and B. giganteus/B. niger for FuHC-sec, and 77–78% identity between B. giganteus/B. diegensis and B. giganteus/B. niger for FuHC-tm (Table 2). B. violaceus is the sister clade to the B. diegensis/B. giganteus/B. niger clade (Figures 1 and 2), with an average identity between B. violaceus and B. diegensis/B. giganteus/B. niger of 38.67% for FuHC-sec and 76.67% for FuHC-tm (Table 2). The B. gaiae/B. schlosseri clade is separate from the Botrylloides clade (Figures 1 and 2). The per cent identity between B. gaiae and B. schlosseri is 99% for FuHC-sec and 88% for FuHC-tm. All of the phylogenetic relationships evidenced by FuHC-sec and FuHC-tm trees are identical to those from nuclear loci (Nydam et al., Reference Nydam, Lemmon, Cherry, Kortyna, Clancy, Hernandez and Cohen2021).
Results of the specificity analyses are presented in Table 3, and the raw data with statistical calculations are available in Supplementary Material 5. Table 3 shows exons that have both high and low specificity compared to the mean specificity for each species pair. Exons in red text have specificities more than one standard deviation higher than the mean for that species pair, and exons in blue text have specificities more than one standard deviation lower than the mean for that species pair.
Exons with low (blue text) and high (red text) specificities compared to the average specificity in each species pair

Table 3 Long description
The table consists of two sections: FuHC-sec and FuHC-tm, each with six columns representing species pairs: B. diegensis B. giganteus, B. diegensis B. niger, B. diegensis B. violaceus, B. giganteus B. niger, B. giganteus B. violaceus, B. niger B. violaceus. FuHC-sec section: B. diegensis B. giganteus has identifiers 1, 7, 8, 11, 17; B. diegensis B. niger has 1, 2, 8, 7, 12, 17; B. diegensis B. violaceus has 1, 5, 7, 8, 15, 16; B. giganteus B. niger has 1, 3, 7, 9, 17; B. giganteus B. violaceus has 2, 3, 11, 15, 16; B. niger B. violaceus has 2, 4, 7, 8, 15, 17. FuHC-tm section: B. diegensis B. giganteus has 6; B. diegensis B. niger has 9; B. diegensis B. violaceus is NA; B. giganteus B. niger has 11; B. giganteus B. violaceus has 2; B. niger B. violaceus has 2. B. gaiae and B. schlosseri entries are present in both sections but have no numeric identifiers. Red numbers indicate specific categories, while blue numbers denote another category. FuHC-sec has more identifiers overall, with some species pairs showing more shared identifiers. FuHC-tm has fewer identifiers, with one entry missing data (NA). The table has six columns and two main sections, highlighting numeric patterns and missing data.
For FuHC-sec, there is little overlap in the exons in Table 3 between Botrylloides and Botryllus, so the two genera will be discussed separately. Exons 1 and 8 are >1 standard deviation above the mean in 4/6 Botrylloides pairs, and never >1 standard deviation below the mean (Table 3). Exon 2 is >1 standard deviation above the mean in 3/6 Botrylloides pairs, and never >1 standard deviation below the mean (Table 3). Exon 7 is >1 standard deviation above the mean in 4/6 Botrylloides pairs, and >1 standard deviation below the mean in 1/6 Botrylloides pairs (Table 3). Exons 15, 16, and 17 are >1 standard deviation below the mean in 3/6, 2/6, and 4/6 pairs, respectively, and never >1 standard deviation above the mean (Table 3). Exons 5 and 6 are >1 standard deviation above the mean in Botryllus, and Exons 12 and 14 are >1 standard deviation below the mean in Botryllus (Table 3). FuHC-sec has between 4 and 6 exons in each pairwise comparison that are outside ±1 standard deviation of the mean (Table 3). For FuHC-tm, Exons 2 and 11 are each >1 standard deviation above the mean in 2/7 pairs. There are no exons >1 standard deviation below the mean in Botrylloides, while Exons 5 and 12 are >1 standard deviation below the mean in Botryllus (Table 3). FuHC-tm has between 0 and 3 exons in each pairwise comparison that are outside ±1 standard deviation of the mean (Table 3).
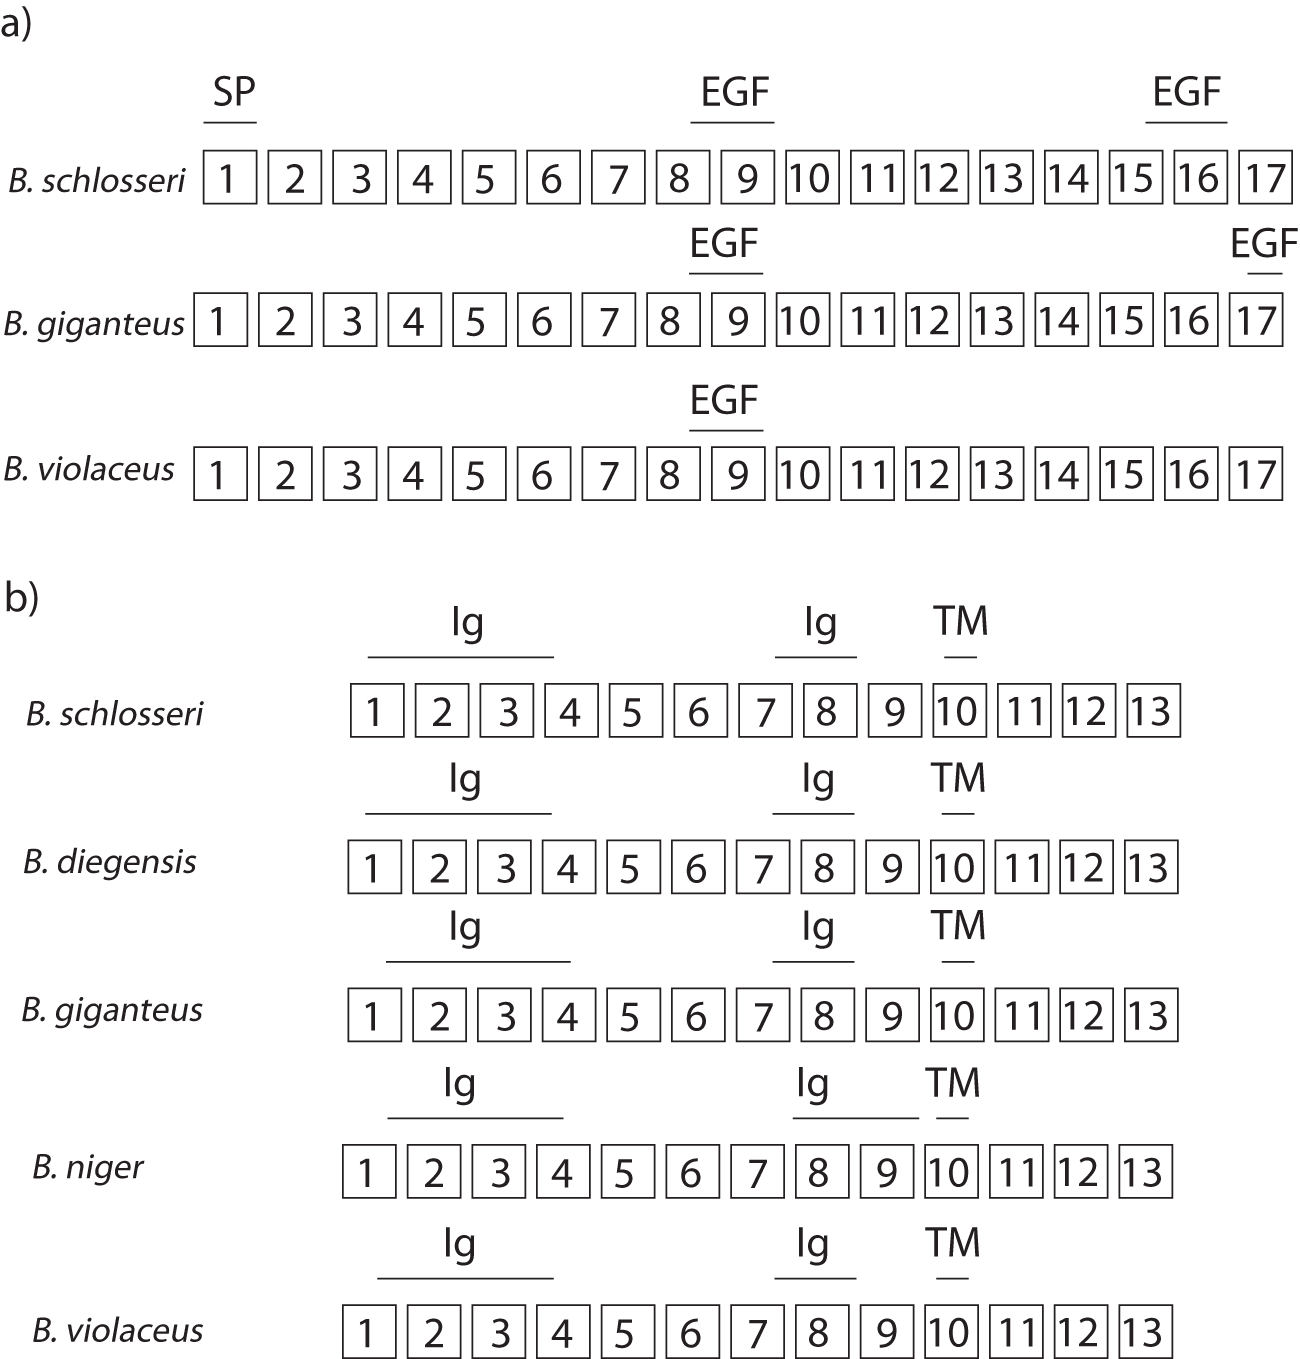
The domain architecture of FuHC-sec and FuHC-tm in B. schlosseri, as determined by SMART v. 10, is diagrammed in Figure 3. The FuHC-sec protein contains a signal peptide from amino acid 1–20/bp 1–60 (Exon 1), an epidermal growth factor (EGF)-like domain from amino acid 262–295/bp 784–885 (the last four amino acids of Exon 8 and all of Exon 9), and another EGF-like domain from amino acid 517–551/bp 1549–1653 (the last seven amino acids of Exon 15 and all of Exon 16) (Figure 3). The FuHC-tm protein contains two Ig (Immunoglobulin)-like domains (Figure 3). The first Ig is from amino acid 11–119/bp 31–357 (the last 23 amino acids of Exon 1, all of Exon 2, all of Exon 3, and the first 5 amino acids of Exon 4), and the second from amino acid 262–334/bp 784–1002 (the last 25 amino acids of Exon 7 and all of Exon 8) (Figure 3). A TM (transmembrane) region is present from amino acid 363–385/bp 1087–1155 (amino acids 15–37 in Exon 10) (Figure 3).
Diagram of protein domains predicted by SMART v. 10. SP = signal peptide, EGF = epidermal growth factor-like, Ig = immunoglobulin-like, TM = transmembrane. (a) FuHC-sec. (b) FuHC-tm.

In B. diegensis and B. niger FuHC-sec, no domains were confidently predicted. In B. giganteus FuHC-sec, the EGF-like domains were found in similar locations to B. schlosseri: the first EGF-like domain is amino acid 263–300/bp 787–900 (the last eight amino acids of Exon 8 and all of Exon 9), and the second EGF-like domain is amino acid 557–591/bp 1669–1773 (the last 23 amino acids of Exon 17) (Figure 3). However, the signal peptide was not predicted. In B. violaceus FuHC-sec, the first EGF-like domain was recovered in amino acids 262–304/bp 784–912 (the last seven amino acids of Exon 8 and all of Exon 9) (Figure 3), but the second EGF-like domain and the signal peptide were not predicted.
In B. diegensis, B. giganteus, B. niger, and B. violaceus FuHC-tm, the domain architecture is similar to B. schlosseri: there are two Ig domains and a TM region at similar locations to B. schlosseri (Figure 3). In B. diegensis, the first Ig domain is from amino acid 6–117/bp 16–351 (the last 28 amino acids of Exon 1, all of Exon 2, all of Exon 3, and the first six amino acids of Exon 4), the second from amino acid 258–330/bp 772–990 (the last 25 amino acids of Exon 7 and all of Exon 8) (Figure 3). The Tm region is from amino acid 359–381/bp 1075–1143 (amino acids 8–22 in Exon 10) (Figure 3). In B. giganteus, the first Ig domain is from amino acid 25–121/bp 73–363 (the last nine amino acids of Exon 1, all of Exon 2, all of Exon 3, and the first 29 amino acids of Exon 4), the second from amino acid 258–330/bp 772–990 (the last 27 amino acids of Exon 7 and all of Exon 8) (Figure 3). The Tm region is from amino acid 359–381/bp 1075–1143 (amino acids 8–22 in Exon 10) (Figure 3). In B. niger, the first Ig domain is from amino acid 33–133/bp 97–399 (the last amino acid of Exon 1, all of Exon 2, all of Exon 3, and the first 17 amino acids of Exon 4), the second from amino acid 284–356/bp 850–1068 (all of Exon 8, all of Exon 9, and the first five amino acids of Exon 10) (Figure 3). The Tm region is from amino acid 384–406/bp 1150–1218 (amino acids 24–46 in Exon 10). In B. violaceus, the first Ig domain is from amino acid 25–125/bp 73–375 (the last 10 amino acids of Exon 1, all of Exon 2, all of Exon 3, and the first nine amino acids of Exon 4), the second from amino acid 276–348/bp 826–1044 (the last 7 amino acids of Exon 7 and all of Exon 8) (Figure 3). The Tm region is from amino acid 375–397/bp 1123–1191 (amino acids 16–37 in Exon 10) (Figure 3).
In FuHC-sec, Exons 15–17 are low-specificity exons and encode (Exons 15 and 16) ‘or are adjacent to (Exon 17) an EGF domain in B. schlosseri’ (Figure 3). Interestingly, the high-specificity exons are also adjacent to an EGF domain (Exon 7) or encode an EGF domain (Exon 8) in B. schlosseri (Figure 3). The other two high-specificity exons are adjacent to the signal peptide (Exon 2) or encode the signal peptide (Exon 1) in B. schlosseri (Figure 3). In FuHC-tm, Exon 2 is involved in encoding one of two predicted Ig domains (Figure 3).
Discussion
In order to determine whether the mechanisms of allorecognition and xenorecognition are the same when the outcomes are the same (e.g. a rejection reaction), exons that have high specificity at the inter-specific level can be compared to exons that are under selection at the intra-specific level. In a population genetic study of B. schlosseri, codons in FuHC-sec with a selection statistic >1 in at least 50% of the populations are clustered in Exons 5 and 6 (Nydam et al., Reference Nydam, Taylor and De Tomaso2013b, Reference Nydam, Stephenson, Waldman and De Tomaso2017). Exons 5 and 6 are also the only two exons in FuHC-sec that have high specificity when B. schlosseri is compared with B. gaiae. A selection statistic value >1 was determined to indicate balancing selection, and B. schlosseri and B. gaiae share many alleles at the FuHC-sec gene (Nydam et al., Reference Nydam, Stephenson, Waldman and De Tomaso2017). But the high specificity in Exons 5 and 6 suggests that selection statistic values >1 in these Exons 5 and 6 codons may also indicate directional selection: non-synonymous substitutions producing high-specificity codons differentiating the two species at these particular exons. It is therefore possible that Exons 5 and 6 in B. schlosseri are involved in both allorecognition and xenorecognition.
From the same population genetic study of B. schlosseri, codons in FuHC-tm with a selection statistic >1 in at least 50% of the populations are clustered in Exons 3 and 10. Neither Exon 3 nor Exon 10 is high-specificity in B. schlosseri vs. B. gaiae, so the exons under balancing selection intra-specifically in B. schlosseri (allorecognition) are not the same exons differentiating the two species (xenorecognition).
The FuHC-sec high-specificity exons identified most frequently in the Botrylloides species pairs (Exons 1, 2, 7, and 8) do not overlap at all with Exons 5–6, which are high-specificity in B. schlosseri vs. B. gaiae, and under selection in B. schlosseri (Nydam et al., Reference Nydam, Taylor and De Tomaso2013b, Reference Nydam, Stephenson, Waldman and De Tomaso2017). In FuHC-tm, Exon 11 was identified as high-specificity in one Botrylloides species pair, and in B. schlosseri/B. gaiae, but there were no other overlaps. This may mean that the FuHC protein regions critical in allorecognition and xenorecognition may be different in Botryllus and Botrylloides, with the possible exception of FuHC-tm Exon 11.
Several of the high-specificity exons in FuHC-sec and FuHC-tm are associated with protein domains. In FuHC-sec, Exons 1, 2, 7, and 8 had high specificity in Botrylloides. Exon 1 encodes a signal peptide. Signal peptides guide proteins to specific locations inside or outside the cell (Gemmer and Förster, Reference Gemmer and Förster2020; Liaci et al., Reference Liaci, Steigenberger, de Souza, Tamara, Gröllers-mulderij, Ogrissek and Förster2021). In the case of FuHC-sec, the signal peptide targeted the protein expressed in mammalian cells to the plasma membrane for export (Nydam et al., Reference Nydam, Netuschil, Sanders, Langenbacher, Lewis, Taketa and De Tomaso2013a). Signal peptides are normally conserved domains (Duan et al., Reference Duan, Chen, Cai, Song and Li2025) and mutations in these domains are associated with genetic disorders in humans (Jarjanazi et al., Reference Jarjanazi, Savas, Pabalan, Dennis and Ozcelik2008). However, Exon 1 is divergent, even between the closely related B. diegensis and B. niger. FuHC-sec localization has primarily been studied in B. schlosseri, not Botrylloides, so future functional studies could examine the consequences of the divergence for signal peptide function.
The last four amino acids of FuHC-sec Exon 8 in Botrylloides (along with Exon 9, which was not high-specificity) encode an EGF-like domain. The third and the fourth of these amino acids are different between B. diegensis and B. giganteus, the first is different between B. diegensis and B. niger, all four are different between B. diegensis and B. violaceus, the first and the fourth are different between B. giganteus and B. niger, all four are different between B. giganteus and B. violaceus, and the first, second and third are different between B. niger and B. violaceus. EGF-like domains are common in secreted proteins like FuHC-sec (Brewitz et al., Reference Brewitz, Onisko and Schofield2022). Selectins (cell adhesion during inflammation) (Ley, Reference Ley2003) and laminins (cell adhesion, migration and differentiation) (Durbeej, Reference Durbeej2010) are well-known proteins containing EGF-like domains.
Exons 5 and 6 showed high specificity in Botryllus, but no protein domains are associated with Exons 5 and 6 as predicted by SMART v.10. However, tertiary structure predictions of FuHC-sec reveal that Exons 4–6 encode β-sandwich domains (Rodriguez-Valbuena et al., unpublished data). β-sandwich domains are a very large category: approximately 1/3 of β-sheets are in a sandwich structure, which means two sheets layered face-to-face (Fokas et al., Reference Fokas, Gelfand and Kister2004). Subtypes of β-sandwich domains include Ig domains, which are found in FuHC-tm (Chidyausiku et al., Reference Chidyausiku, Mendes, Klima, Nadal, Eckhard, Roel-touris and Marcos2022), and jelly roll domains (Aik et al., Reference Aik, McDonough, Thalhammer, Chowdhury and Schofield2012).
In FuHC-tm, Exons 2, 6, 9, and 11 were high-specificity. Exons 1–4 all encode an Ig-like domain, so it is interesting that only Exon 2 was high-specificity. Ig-like domains in secreted proteins contribute to cell-cell recognition and immune function (Teichmann and Chothia, Reference Teichmann and Chothia2000). Exons 6, 9, and 11 are not associated with any protein domains.
The evolution of allorecognition in colonial ascidians in the genera Botrylloides and Botryllus can be connected to general models of allorecognition. Gilbert (Reference Gilbert2015) describes two models: Minor and Major Histocompatibility. In Minor Histocompatibility, rejection between two incompatible colonies of the same species occurs after fusion has been initiated, and in Major Histocompatibility, rejection between two incompatible colonies of the same species occurs before fusion (Gilbert, Reference Gilbert2015). All rejections documented in the literature occur after fusion has been initiated (Genin et al., Reference Genin, Karp and Miroz1994; Nydam et al., Reference Nydam, Lemmon, Lemmon, Ziegler, Cohen, Palomino-alvarez and Gissi2023) and would therefore be classified by Gilbert as Minor Histocompatibility. But there are five types of rejections, defined by how far fusion progresses before rejection begins (Genin et al., Reference Genin, Karp and Miroz1994; Nydam et al., Reference Nydam, Lemmon, Lemmon, Ziegler, Cohen, Palomino-alvarez and Gissi2023). In the Botrylloides genus, rejection occurs at the first stage of fusion, and the Botrylloides genus evolved after Botryllus species, where rejection occurs at later stages of fusion (Nydam et al., Reference Nydam, Lemmon, Lemmon, Ziegler, Cohen, Palomino-alvarez and Gissi2023). In this way, the evolution of allorecognition in colonial ascidians in the genera Botrylloides and Botryllus supports Gilbert’s argument of gradual evolution from Minor Histocompatibility to Major Histocompatibility (Gilbert, Reference Gilbert2015).
The evolution of allorecognition has been extensively studied in one other group of invertebrates: hydroids in the genus Hydractinia (Grosberg et al., Reference Grosberg, Levitan and Cameron1996; Rosengarten and Nicotra, Reference Rosengarten and Nicotra2011; Nicotra, Reference Nicotra2022). The phylogenetic position of ascidians as invertebrate chordates differs substantially from the basal position of hydroids (Phylum Cnidaria) (Grosberg and Plachetzki, Reference Grosberg, Plachetzki, Breed and Moore2010). It is therefore useful to compare allorecognition in ascidians and hydroids to identify common features despite very large evolutionary distances. From a parsimony perspective, ascidians and hydroids evolved allorecognition separately (Grosberg and Plachetzki, Reference Grosberg, Plachetzki, Breed and Moore2010) and similarities in allorecognition between these two groups are therefore the result of convergent evolution (Grosberg and Plachetzki, Reference Grosberg, Plachetzki, Breed and Moore2010). Two major commonalities have been identified: very high specificity controlled by a few loci, and recognition of self, rather than non-self (Grosberg and Plachetzki, Reference Grosberg, Plachetzki, Breed and Moore2010).
Supplementary material
The supplementary material for this article can be found at https://doi.org/10.1017/S0025315426101568.
Acknowledgements
We would like to thank Tony De Tomaso, Henry Rodriguez-Valbuena, and Laurel Hiebert for valuable discussions, and Henry Rodriguez-Valbuena for generating the transcriptomic data. We would also like to thank two anonymous reviewers for helping us to improve the manuscript.
Author contributions
Q.N.P. collected the data, analysed the data, interpreted the findings, and wrote the article. S.N. analysed the data. W.A., T.B., W.O.S., and H.T.A.S. collected the data. M.L.N. formulated the research question, designed the study, collected the data, analysed the data, interpreted the findings, and wrote the article.
Declaration of interest
The authors declare none.
Data availability statement
The data that support the findings of this study are available from the corresponding author, M.L.N
Ethics and approach
No animals subject to regulatory oversight were used in this study.
Funding statement
This study was financed by Soka University of America.




 Open access

