Introduction
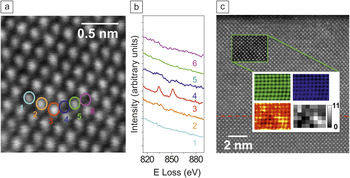
With the advent of spherical aberration correction in the electron microscope, the last decade witnessed a major revolution in real space characterization techniques, making atomic resolution spectroscopic characterization accessible to virtually any materials scientist. The enhanced capabilities of modern aberration-corrected electron microscopes allow spatial resolutions of the order of 0.1 nm or below to be routinely reproduced in laboratories and universities around the world.Reference Browning, Chisholm and Pennycook1–Reference Lazar, Etheridge, Dwyer, Freitag and Botton10 This article will review some state-of-the-art applications of electron energy-loss spectroscopy (EELS) in the aberration-corrected scanning transmission electron microscope (STEM) to oxide materials. STEM-EELS is now capable of not just producing elemental maps with atomic resolutionReference Bosman, Keast, Garcia-Muñoz, D’Alfonso, Findlay and Allen6–Reference Muller, Fitting-Kourkoutis, Murfitt, Song, Hwang, Silcox, Dellby and Krivanek8 but also detecting individual atoms in materialsReference Varela, Lupini, Christen, Dellby, Krivanek, Nellist and Pennycook11 and producing elemental maps of impurities in low concentrations.Reference Pennycook and Nellist12, Reference Pennycook and Varela13 An example of such a possibility is summarized in the spectrum imageReference Jeanguillaume and Colliex14, Reference Hunt and Williams15 shown in Figure 1. Individual La atoms in a CaTiO3 matrix can be detected by annular dark field or Z-contrast imaging and also by EELS (Figure 1a–b),Reference Varela, Lupini, Christen, Dellby, Krivanek, Nellist and Pennycook11 and a quantification of the number of La atoms per atomic column in a Ca0.95La0.05TiO3 layer can be attempted by analyzing the La elemental maps (Figure 1c).Reference Pennycook and Nellist12, Reference Pennycook and Varela13
(a) Z-contrast image of a CaTiO3 thin film doped with isolated La impurities. (b) La M4,5 lines obtained from the different atomic columns marked on (a), showing a clear signal from the La single atom. The spectra have been displaced vertically for clarity. Adapted from Reference 11. (c) Z-contrast image of a Ca1–xLaxTiO3 (top)/CaTiO3 (bottom) bilayer doped with x = 0.05 La impurities. The red dotted line marks the position of the interface. The inset marked with a green rectangle shows the region where a spectrum image was acquired. The simultaneously acquired annular dark field signal is overlaid, showing some spatial drift. The white rectangle shows the Ca L2,3, Ti L2,3, and La M4,5 atomic resolution maps (in false color blue, green, and red, respectively). The adjacent inset shows, in gray scale, an estimation of the actual number of La atom impurities per atomic column. Adapted from References Reference Varela, Lupini, Christen, Dellby, Krivanek, Nellist and Pennycook11–Reference Pennycook and Varela13.

Spectrum imaging with atomic resolution
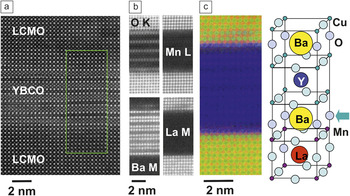
Atomic resolution spectroscopic imaging in the electron microscope is becoming an unprecedented tool for chemical identification in real space. When it comes to applications to low dimensionality systems, such as 2D interfaces between different materials, EELS imaging permits unambiguously identifying the interface structure atomic plane by atomic plane, atomic column by atomic column. An example is shown in Figure 2, where an image of a ferromagnetic/superconducting/ferromagnetic La0.7Ca0.3MnO3/YBa2Cu3O7–x/La0.7Ca0.3MnO3 (LCMO/YBCO/LCMO) heterostructure is depicted.Reference Visani, Tornos, Nemes, Rocci, Leon, Santamaria, te Velthuis, Liu, Hoffmann, Freeland, Garcia-Hernandez, Fitzsimmons, Kirby, Varela and Pennycook16 This system is the oxide counterpart of classic ferromagnetic/superconducting superlattices, which were obtained to study the interplay of these competing order parameters.Reference Vasko, Larkin, Graus, Nikolaev, Grupp, Nordman and Goldman17–Reference Gonzalez, Okamoto, Yunoki, Moreo and Dagotto22 The interface structure and atomic plane stacking sequence has a direct impact on the physical properties of these heterostructures. Atomic resolution spectroscopic images show how in this system, the YBCO interface unit cell is not complete: a CuO chain atomic plane is missing, and hence the YBCO BaO plane at the interface is bound to the first MnO2 plane of the manganite (see the sketch in Figure 2).Reference Varela, Lupini, Pennycook, Sefrioui and Santamaria19 This interface structure has tremendous implications: charge transfer from the ferromagnet into the superconductorReference Varela, Lupini, Peña, Sefrioui, Arslan, Browning, Santamaria and Pennycook20–Reference Gonzalez, Okamoto, Yunoki, Moreo and Dagotto22 gives rise to an orbital reconstruction between the Cu and the Mn atoms that dominates the system properties at the interface.Reference Varela, Lupini, Peña, Sefrioui, Arslan, Browning, Santamaria and Pennycook20–Reference Gonzalez, Okamoto, Yunoki, Moreo and Dagotto22
High resolution Z-contrast image of a La0.7Ca0.3MnO3/YBa2Cu3O7–x/La0.7Ca0.3MnO3 (LCMO/YBCO/LCMO) heterostructure. The inset marks the region where an electron energy-loss spectroscopy spectrum image was acquired, along with the simultaneous annular dark field signal. (b) O K, Mn L2,3, Ba M4,5, and La M4,5 atomic resolution images. (c) RGB overlay of the Mn (red), La (green), and Ba (blue) images in (b). The sketch shows the interface structure; an arrow marks the interface plane. The interfaces are defect free and atomically sharp. Adapted from References Reference Visani, Tornos, Nemes, Rocci, Leon, Santamaria, te Velthuis, Liu, Hoffmann, Freeland, Garcia-Hernandez, Fitzsimmons, Kirby, Varela and Pennycook16 and Reference Varela, Lupini, Pennycook, Sefrioui and Santamaria19.

Near-edge fine structure
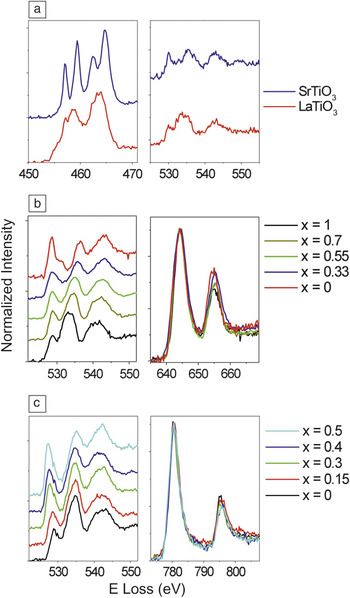
Beyond elemental mapping, EELS also provides a powerful tool to study optical, electronic, and even magnetic properties through the analysis of changes of the absorption edge fine structure.Reference Egerton23, Reference Garcia de Abajo24 As described in detail in the article by Botton, the fine structure at the absorption edge maps out the local electronic structure. Complex oxide materials are ideal test beds for these measurements, especially transition metal oxides. In the dipole approximation, the O K near edge structure (with an onset around 530 eV) is related to excitations of O 1s electrons to the 2p bands, while transition metal L2,3 edges ensue from the excitation of 2p electrons into 3d bands and empty bound states.Reference Egerton23 In transition metal oxides, the O 2p bands and the metal 3d bands are strongly hybridized with each other. Therefore, significant variations are expected in both edges when the occupation of the 3d bands (i.e., the metal atom valence) changes.Reference Sparrow, Williams, Rao and Thomas25–Reference Luo, Varela, Tao, Pennycook and Pantelides33 An example is shown in Figure 3, which depicts the O K and metal L2,3 edges for a series of different Ti, Mn, and Co oxides at various doping levels.Reference Pennycook and Nellist12, Reference Varela, Luo, Tao, Oxley, Watanabe, Lupini, Pantelides and Pennycook32–Reference Garcia-Barriocanal, Bruno, Rivera-Calzada, Sefrioui, Nemes, Garcia-Hernández, Rubio-Zuazo, Castro, Varela, Pennycook, Leon and Santamaría34 All of the materials depicted have perovskite structures with an ABO3 chemical formula, where the A position is occupied by a divalent or a trivalent cation, or a solid solution of both. The specific stoichiometry will determine the occupation of the 3d bands of the metal and hence the fine structure of the EELS edges. In general, the O K edge shows a pre-peak feature with significant spectral weight associated with hybridization with the metal 3d bands. The more holes introduced in the system (e.g., by doping a divalent cation into an ABO3 compound based on an A trivalent cation), the higher the oxidation state of the metal and the higher the relative intensity of the O K edge pre-peak. Simultaneously, the ratio between the relative intensities of the L3 and L2 lines, the L23 intensity ratio, changes as well.Reference Waddington, Rez, Grant and Humphreys26–Reference Krivanek and Paterson28, Reference Kurata and Colliex30–Reference Varela, Luo, Tao, Oxley, Watanabe, Lupini, Pantelides and Pennycook32
O K and L2,3 electron energy-loss spectroscopy edges of a number of transition metal oxides: (a) LaTiO3 and SrTiO3, (b) La1–xCaxMnO3 system, and (c) La1–xSrxCoO3 system. The data have been normalized and displaced vertically for visual clarity. The edge fine structure depends on the chemical composition. Data adapted from References Reference Pennycook and Nellist12, Reference Varela, Luo, Tao, Oxley, Watanabe, Lupini, Pantelides and Pennycook32, and Reference Garcia-Barriocanal, Bruno, Rivera-Calzada, Sefrioui, Nemes, Garcia-Hernández, Rubio-Zuazo, Castro, Varela, Pennycook, Leon and Santamaría34.

From the examples included in Figure 3, it is especially interesting to compare the La1–xCaxMnO3 (LCMO) and the La1–xSrxCoO3 (LSCO) systems.Reference Pennycook and Nellist12, Reference Varela, Luo, Tao, Oxley, Watanabe, Lupini, Pantelides and Pennycook32, Reference Luo, Varela, Tao, Pennycook and Pantelides33 Both series of materials show intriguing physical properties and complex phase diagrams as a function of doping.Reference Dagotto, Hotta and Moreo35 LCMO shows colossal magnetoresistance for 0.2 < x < 0.5 doping,Reference Dagotto, Hotta and Moreo35 while LSCO is very intriguing from the point of view of the strong magnetoelectronic phase separation characteristic of the systemReference Wu and Leighton36 and also the new degree of freedom added by the variable spin state of Co.Reference Senaris-Rodriguez and Goodenough37–Reference Podlesnyak, Streule, Mesot, Medarde, Pomjakushina, Conder, Tanaka, Haverkort and Khomskii39 While we will review properties associated with these behaviors later in the text, the common features shared by their fine structures are worth commenting on. Since the transition metal atoms are surrounded by six oxygen atoms in octahedral coordination, the degeneracy of the 3d levels is lifted into three lower lying t 2g orbitals and two upper e g bands, which can also be separated by Jahn Teller splitting induced by deformation of the O octahedra.Reference Maekawa, Tohyama, Barnes, Ishihara, Koshibae and Khaliullin38 Assuming a relatively high occupation of the t 2g orbitals, doping of divalent Ca or Sr in both systems introduces holes in the e g band, increasing the valence of the metal from +3 to +4, depending on x.
Spectroscopy in the aberration-corrected STEM is, therefore, a very powerful tool to study oxides at the atomic scale. But for these techniques to achieve full potential, the proper interpretation of results is a key issue. In most cases, any attempt at quantification of EELS experiments must be supported by theoretical simulations.Reference Pennycook and Nellist12 Effects such as dechanneling of the electron beam or surface amorphous layers may give rise to electron beam broadening, and the ensuing artifacts may obscure interpretation of elemental maps and atomic resolution measurements.Reference Oxley and Allen40–Reference Oxley, Chang, Borisevich, Varela and Pennycook43 The fine structure of EELS edges itself cannot be understood without access to the material’s density of states (DOS), which can be provided by density functional theory (DFT). This article will review a few examples of applications of STEM and EELS combined with DFT to problems that represent open questions in materials physics and show the reader how in the nanotechnology era, real space characterization is very often the most direct approach to understanding materials.
Spectroscopic imaging of light atoms: Oxygen in perovskites
For decades, light atom imaging was one of the milestones that electron microscopists dreamed of achieving. Light atoms with poor scattering powers hardly give any contrast in electron microscopy observations. Thanks to the correction of spherical aberration, successful imaging of atoms such as B, C, N, O, and even Li has now been demonstrated in laboratories.Reference Jia and Urban44–Reference Findlay, Shibata, Sawada, Okunishi, Kondo, Yamamoto and Ikuhara46 Such light atoms have high signal EELS absorption edges ideally suited for the optics of current electron energy-loss spectrometers. For this reason, resolving O atoms in oxide materials became possible almost as soon as aberration correction was available.Reference Oxley, Varela, Pennycook, van Benthem, Findlay, D’Alfonso, Allen and Pennycook42
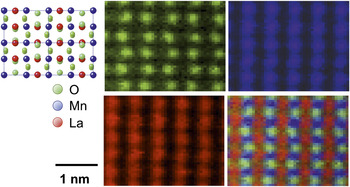
A more recent example of O atom imaging in a two-dimensional image of a material is exhibited in Figure 4. This figure shows a set of high-resolution spectroscopic images of the perovskite LaMnO3 (LMO) down the pseudocubic [110] axis, using the O K, Mn L2,3, and the La M4,5 edges. The different columns are clearly resolved, and the structure shows good agreement with the bulk (sketch on the left).Reference Rodriguez-Carvajal, Hennion, Moussa, Moudden, Pinsard and Revcolevschi47 LMO is not a perfectly cubic perovskite but exhibits distorted O octahedra around the Mn atoms that give rise to the ripple observed in the O sublattice. EELS images pick up this behavior and clearly show the zig-zag associated with the distorted O octahedra. Thanks to EELS images, measurements in real space reveal such distortions simultaneously with fine structure changes ensuing from alterations of atomic bonds.Reference Pennycook and Nellist12 It is worth mentioning that not all of the O atoms in the structure are visible. The contrast associated with O atoms sitting on heavy La columns is lost due to scattering.Reference Oxley, Chang, Borisevich, Varela and Pennycook43 Simulations including dynamical scattering of the electron probe as it propagates through the crystal, therefore, are needed to interpret these images in great detail. These calculations highlight the fact again that interpretation of EELS images may not always be straightforward, especially in thick specimens and in the presence of heavy atoms.Reference Oxley, Chang, Borisevich, Varela and Pennycook43
Spectroscopic imaging of LaMnO3 (LMO) down the pseudocubic [110] axis. The sketch shows the projected structure of LMO down this direction. In green, the O K edge image, in blue the simultaneously acquired Mn L2,3 image, and in red the La M4,5 image. The RGB overlay of the three elemental maps is also shown. Adapted from References Reference Pennycook and Nellist12 and Reference Pennycook and Varela13.

Applications to interfaces: Ionic conductor superlattices
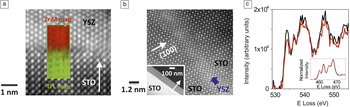
Fast ionic conductors are widely used in solid oxide fuel cells. The transport of current occurs via the movement of ions through voids and vacant positions in the crystal structure. One of the most common solid electrolytes is yttria-stabilized zirconia, Y2O3-ZrO2 (YSZ). The doping of zirconia with small amounts of yttria causes some of the Zr+4 atoms to be replaced with Y+3. As a result, and to preserve neutrality, some O vacancies are introduced in the system.Reference Ostanin, Craven, McComb, Vlachos, Alavi, Finnis and Paxton48–Reference Goodenough51 If the O vacancy mobility is sufficiently high, behavior typically reached by increasing the temperature, YSZ becomes an O ionic conductor. It has been reported that the coherent growth of strained interfaces in heterostructures with different degrees of lattice mismatch may also enhance ion diffusivity, so these systems may play a determining role in the optimization of materials for energy generation and storage.Reference Kosacki, Rouleau, Becher, Bentley and Lowndes52–Reference Cavallaro, Burriel, Roqueta, Apostolidis, Bernardi, Tarancón, Srinivasan, Cook, Fraser, Kilner, McComb and Santiso54 A colossal increase of nearly eight orders of magnitude of the ionic conductivity near room temperature has been reported in Y2O3- ZrO2/SrTiO3 (YSZ/STO) superlattices,Reference Garcia-Barriocanal, Rivera-Calzada, Varela, Sefrioui, Iborra, Leon, Pennycook and Santamaria55 such as the one shown in Figure 5. In this system, different structures (YSZ fluorite versus STO perovskite) with a large lattice mismatch close to 7% are combined. In principle, YSZ layers grown on STO substrates should relax after a few monolayers and show incoherent interfaces (see Figure 5a). But when ultrathin YSZ layers (1 nm thick) are sandwiched in between STO layers, the YSZ deforms to match the underlying STO, giving rise to a coherently strained interface (Figure 5b).
(a) High-resolution annular dark field image of an incoherent Y2O3-ZrO2/SrTiO3 (YSZ/STO) interface along with an electron energy-loss spectroscopy map showing that the interface is, nevertheless, chemically abrupt. (b) Z-contrast image of a coherently strained YSZ layer 1 nm thick in a (YSZ1nm/STO10nm) superlattice. The blue arrow marks the position of the YSZ layer. The inset is a low magnification image of the same sample. White arrows mark the growth direction. (c) O K and Ti L2,3 (inset) spectra from the interface (red) and the middle of the STO layers (black). Adapted from Reference Reference Garcia-Barriocanal, Rivera-Calzada, Varela, Sefrioui, Iborra, Leon, Pennycook and Santamaria55. Note: E, energy.

The features of the O K edge structure, especially the reduced pre-peak intensity of interface spectra, demonstrate that the interfaces are O deficient.Reference Garcia-Barriocanal, Rivera-Calzada, Varela, Sefrioui, Iborra, Leon, Pennycook and Santamaria55 Meanwhile, the Ti L2,3 edge does not change in an appreciable fashion. The lack of Ti+3 character at the interface (compare Figure 5c inset with the LTO spectrum in Figure 3a), excludes the possibility of major electronic conduction. It also has been suggested that contributions from the substrate could be responsible for the colossal conductivity as well,Reference Guo56 but even the most conducting STO substrates show conductivity values that are at most four orders of magnitude or more below the values reported by Garcia-Barriocanal and co-workers.Reference Garcia-Barriocanal, Rivera-Calzada, Varela, Sefrioui, Iborra, Leon, Penycook and Santamaria57 The colossal conductivity, therefore, is not due to electronic conduction through the STO substrate, so it is possible to conclude that the conductivity is ionic in nature and related to the strained ultrathin YSZ layers.
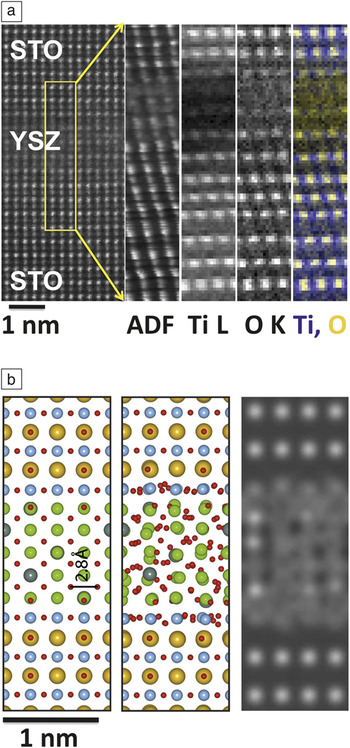
Further theoretical and experimental work has demonstrated that the O sublattice in these heavily strained YSZ layers is extremely disordered, as shown in Figure 6. Such heavy disorder can enhance O mobility in a dramatic way, as demonstrated by calculations.Reference Pennycook, Beck, Varga, Varala, Pennycook and Pantelides58, Reference Pennycook, Oxley, Garcia-Barriocanal, Bruno, Leon, Santamaria, Pantelides, Varela and Pennycook59 These calculations confirm that epitaxial strain leads to extreme disorder of the O sublattice, with dramatically enhanced O ion mobility. The calculations estimate the activation energy to be around 0.4 eV, which is in close agreement to the 0.6 eV value measured experimentally.Reference Garcia-Barriocanal, Rivera-Calzada, Varela, Sefrioui, Iborra, Leon, Pennycook and Santamaria55 Hence, it is confirmed that the colossal enhancement in conductivity near room temperature observed in this system is due to enhanced O ion mobility ensuing from epitaxial strain.
(a) High-resolution annular dark field (ADF) image of a strained Y2O3-ZrO2/SrTiO3 (YSZ/STO) heterostructure viewed down the STO [110] axis, showing a clearly distorted ultrathin YSZ layer. The inset marks the region where a spectrum image was acquired. The ADF signal and the Ti L and O K maps are also shown, along with a colored map where the Ti (blue) and the O (yellow) maps have been overlaid. Some spatial drift is present, but it can be clearly seen how the O sublattice looks diffuse in the YSZ while it is ordered in the STO layers. (b) Model of a STO/YSZ/STO trilayer before (left) and after (middle) relaxation using molecular dynamics.Reference Pennycook, Beck, Varga, Varala, Pennycook and Pantelides58, Reference Pennycook, Oxley, Garcia-Barriocanal, Bruno, Leon, Santamaria, Pantelides, Varela and Pennycook59 Red atoms are O, blue are Ti, yellow are Sr, and green are Zr. The right panel shows a simulation of the O K map of the relaxed structure. The O atomic positions in the YSZ are not resolved any more due to disorder, as observed experimentally in (a). Adapted from References Reference Pennycook, Beck, Varga, Varala, Pennycook and Pantelides58 and Reference Pennycook, Oxley, Garcia-Barriocanal, Bruno, Leon, Santamaria, Pantelides, Varela and Pennycook59.

Sensitivity to magnetism
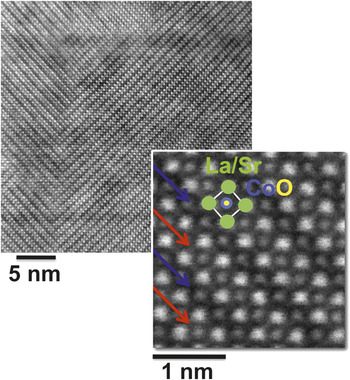
So far we have reviewed a number of examples of state-of-the-art applications of aberration-corrected EELS in the STEM to elemental mapping and measurement of electronic properties of complex oxides. But the DOS of a material is also closely related to other physical properties such as magnetism, to which EELS is sensitive.Reference Schattschneider, Rubino, Hébert, Rusz, Kuneš, Novák, Carlino, Fabrizioli, Panaccione and Rossi60–Reference Verbeeck, Tian and Schattschneider63 A good example of how information on magnetic quantities can be extracted from atomic resolution EELS in oxides can be found in the case of cobaltite La0.5Sr0.5CoO3 (LSCO0.5) thin films. For this Sr doping level, and according to the LSCO phase diagram,Reference Wu and Leighton36 the films are ferromagnetic and metallic.Reference Torija, Sharma, Fitzsimmons, Varela and Leighton64, Reference Torija, Sharma, Gazquez, Varela, He, Borchers, Laver, El-Khatib and Leighton65 However, significant amounts of O vacancies can be found in the films. These vacancies are assembled in an orderly fashion, resulting in a crystal structure that resembles that of the Brownmillerite mineral. Characteristic stripes appear in the Z-contrast images, where one out of every two CoO2 planes viewed down the [100] axis exhibits a reduced contrast,Reference Torija, Sharma, Fitzsimmons, Varela and Leighton64–Reference Klenov, Donner, Foran and Stemmer69 as shown in Figure 7.
Z-contrast image of an LSCO0.5 thin film where the domain structure in the ordered O vacancy phase is visible. The high magnification image shows an enhanced look at the Brownmillerite-like phase. A perovskite unit cell has been highlighted. Also, the fully oxygenated (O deficient) CoO2 planes are marked with red (blue) arrows. Adapted from References Reference Torija, Sharma, Fitzsimmons, Varela and Leighton64 and Reference Gazquez, Luo, Oxley, Prange, Torija, Sharma, Leighton, Pantelides, Pennycook and Varela70.

The overall arrangement of this vacancy ordering is closely linked to the presence of epitaxial strain in the films due to the mismatch with the substrate,Reference Torija, Sharma, Fitzsimmons, Varela and Leighton64, Reference Torija, Sharma, Gazquez, Varela, He, Borchers, Laver, El-Khatib and Leighton65 which in the case of our films is STO.Reference Gazquez, Luo, Oxley, Prange, Torija, Sharma, Leighton, Pantelides, Pennycook and Varela70 When the film thickness increases over the critical value for relaxation,Reference Torija, Sharma, Fitzsimmons, Varela and Leighton64 a domain-like structure is observed in the Brownmillerite-like phase, as seen in Figure 8. These domains are characterized by a non-homogeneous local O stoichiometry, and nanodomains with extremely reduced O content can be found that are very different from the bulk structure. In these nanodomains, the combination of O deficiency and the structural distortions associated with epitaxial strain may give rise to behaviors unexpected in the bulk, which is indeed found to be the case.
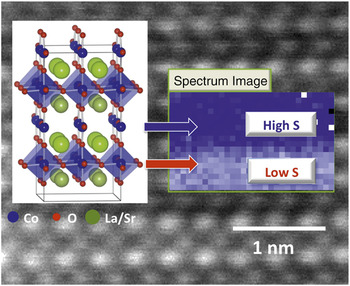
First atomic resolution mapping in real space of a spin state superlattice in a Co oxide. The inset shows the area where a spectrum image was acquired along with the pre-peak intensity extracted from the O K edge. Red (blue) arrows point to the bright (dark) stripes, with low spin (low S) and high spin (high S) states, respectively. Adapted from Reference Reference Gazquez, Luo, Oxley, Prange, Torija, Sharma, Leighton, Pantelides, Pennycook and Varela70.

Theoretical calculations show interesting changes in the DOS around the different Co atoms. While the total 3d band occupation is the same for Co atoms on the bright and dark stripes, the occupations of the spin up and spin down channels are very different. The Co atoms on the dark stripes show a higher spin state than those on the fully oxygenated bright stripes, giving rise to a spin state superlattice.Reference Gazquez, Luo, Oxley, Prange, Torija, Sharma, Leighton, Pantelides, Pennycook and Varela70 Such a superlattice has been observed in bulk Co oxides before, but never in nanodomains or nanopockets within thin films.
The O K edge fine structure reflects the spin state of Co atoms: the pre-peak intensity decreases on the dark stripes, while it increases on the bright stripes, as shown by experiment and simulationReference Gazquez, Luo, Oxley, Prange, Torija, Sharma, Leighton, Pantelides, Pennycook and Varela70 (see Figure 8). These findings point toward the fact that in this system, the pre-peak feature of the O K edge can be used as a marker of the spin state of Co atoms. In these conditions, EELS two-dimensional spectrum images can be used to produce maps of the O K pre-peak intensity, and hence of the spin state of Co with atomic resolution, as summarized in Figure 8. This is an exciting finding and represents, again, a crucial example of how EELS in the electron microscope is a most useful tool to explore different aspects of the nanoworld (structure, chemistry, electronic properties, and even magnetic quantities) with atomic resolution.
Moving toward the future
We have shown how atomic resolution spectroscopy in the aberration-corrected scanning transmission electron microscope, when combined with theoretical simulations, provides a very powerful tool to explore oxide materials in real space. Current correctors can fix up to fifth-order aberrations, and electron microscopy is perfectly poised to achieve electron beams below a half Ångström in size in the near future. Armed with such a lens, materials physicists exploring complex oxides find themselves in a promising position to peek into these fascinating materials atom by atom. With deep sub-Ångström electron beams, we can dream of mapping orbitals and electronic properties around impurities, single atom excitations, spin states, two-dimensional mapping of minor structural distortions around defects, and interfaces. We can even try to explore magnetism in low dimensional systems in real space with atomic resolution, resulting in an unprecedented level of detail. The possibilities to be found in oxide materials seem as endless as their disparate physical behaviors are exciting.
Acknowledgments
The authors acknowledge support from the Materials Sciences and Engineering Division of the U.S. Department of Energy (MV, SJP) and the European Research Council Starting Investigator Award (JG). The authors are also grateful to all the collaborators that made this work possible, among others: Les Allen and his research group, Mike Biegalski, Hans Christen, Chris Leighton and his research group, Ondrej Krivanek and the crew at Nion Co., Julia Luck, Weidong Luo, Andy Lupini, David Mandrus, Mark Oxley, Sokrates Pantelides, Tim Pennycook, Jacobo Santamaria and his research group, Bill Sides, Jing Tao, and Masashi Watanabe.