I. INTRODUCTION
The base metal electrode (BME) multilayer ceramic capacitors (MLCC) are sintered in reducing atmospheres to prevent oxidation of nickel (Ni) inner electrodes. Thus, the dielectrics of MLCC are based on a defect-chemically acceptor-doped BaTiO3 system, the composition of which includes amphoteric dopants of rare earth elements that can occupy the Ba or Ti site such as Y, Dy, Ho, and Ti-site variable valence acceptors, such as Mn, Cr, V etc. to have both nonreducibility and reliability. These variable-valence acceptors, such as Mn, Cr, V, Fe, etc., are important dopant acceptors in BaTiO3, as these elements dramatically improve nonreducibility, reliability, and insulation resistance under high electric field. Reference Rödel and Tomandl1–Reference Yoon, Randall and Hur3
On the other hand, Mn-doped BaTiO3 was reported to show significant dielectric aging and domain stabilization-related phenomena. Reference Hagemann4–Reference Ren7 The dielectric aging is the phenomenon of a decrease of the dielectric constant and thereby the capacitance of a capacitor by lapse of time. The aging behavior is a big problem especially in high capacitance MLCC where the dielectric thickness is very thin. When the aging rate is high, the initial capacitance after heat-treatment above Curie temperature should be much higher to guarantee capacitance specification for the certain period of time. Thus, the dielectric thickness should be thinner, which may cause deterioration of reliability and breakdown voltage.
There are two models that explain the dielectric aging. In the first model of the drift of free charge carriers,
Reference Lupascu, Genenko and Balke8,Reference Genenko and Lupascu9
mobile charges are forced to migrate with the passage of time toward the outer perimeter of the crystallite by the depolarization field, which screen the spontaneous polarization and decrease the effective polarization response and dielectric constant with time. In the second model of the alignment of the defect dipoles (
 ${\rm{V}}_{\rm{O}}^{\cdot\cdot} {\rm{ - A''}}$
or
 ${\rm{V}}_{\rm{O}}^{\cdot\cdot} {\rm{ - A'}}$
),
Reference Lambeck and Jonker5–Reference Ren7,Reference Robels and Arlt10
which are formed by the association between oxygen vacancies (
 ${\rm{V}}_{\rm{O}}^{\cdot\cdot}$
) and ionized acceptors (A′, A″), the interaction between these dipoles and the spontaneous polarization causes their alignment in the direction of spontaneous polarization within a ferroelectric domain. Thus, it results in energy minimization and domain stabilization, and thereby a reduction of dielectric constant with time.
Although there are a number reports on the dielectric aging-related phenomena that explained mostly using the above two models, those reports that directly showed the experimental evidence of the correlation between the dielectric aging and the defect dipole are very limited. Recently, the presence of the defect dipole and its correlation with dielectric aging was experimentally demonstrated by the thermally stimulated depolarization current (TSDC) in the variable-valence acceptor Mn and V-doped BaTiO3 MLCC. Reference Yoon, Park, Kim and Kim11
As the dielectrics of MLCC are exposed to progressively higher electric field conditions as the thickness of dielectric layer becomes thinner, the reliability problem is of increasing concern. The rare earth elements, such as Y, Dy, Ho, Er, etc., are well known to greatly improve reliability of acceptor-doped BaTiO3 dielectrics Reference Hennings12–Reference Randall14 and thus widely used in BME MLCC. As these elements act as either donor or acceptor depending on their site occupancy, it is expected that they may influence ionic defect structure, defect dipole concentration, and thereby dielectric aging behavior. It has been reported that the increase of donor concentration reduced aging rate in donor–acceptor codoped system of K–F-codoped BaTiO3 single crystal and La–Mn-codoped BaTiO3 polycrystal. Reference Bao, Gao, Xue, Zhou, Zhang, Liu and Ren15 Although there are a number of reports that mentioned the effect of rare earth elements on the reliability issue, those reports that studied their influence on the dielectric aging behavior are very limited.
In this study, Dy- and Mn-codoped BaTiO3 MLCC samples that show aging rates different to each other were prepared by varying the rare earth element Dy concentration, and TSDC analysis was conducted for these samples. Thus, the effect of Dy concentration on the behavior of the defect dipole and its association with the dielectric aging is to be experimentally verified.
II. EXPERIMENTAL PROCEDURES
The starting materials used were lab scale-hydrothermally synthesized 180-nm grade BaTiO3 powder, and the dopant additives used were reagent grade BaCO3, SiO2, MnO2, and Dy2O3 powders. The compositions of specimens were 0.4 mol% Mn–0.3 mol% Dy-doped BaTiO3 and 0.4 mol% Mn–0.9 mol% Dy-doped BaTiO3, respectively. Herein, they are referred to as 0.3 and 0.9RE, respectively.
These powders were mixed by ZrO2 ball-milling in an ethanol/toluene (50/50) solution with a dispersant (BYK-103, BYK Chemie, GmbH, Wesel, Germany). After this, an organic binder solution (Polyvinyl Acetal Resin) was added and mixed by ball-milling again. These slurries were separated from the zirconia media for tape-casting into green sheets.
Proto-type Ni inner electrode-MLCC samples of 3.2 × 1.6 mm in size, where the number of dielectric layers is 19 and its thickness after sintering is about 4.0 μm, were prepared. Sintering was conducted at 1180 °C for 2 h in a pO2 of ∼10−9.7 atm (H2/N2/H2O atmosphere, 1% H2/99% N2) followed by reoxidation anneal at 1000 °C for 3 h in N2 atmosphere (pO2 = ∼10−6 atm). Terminal electrodes on both ends of the chips were prepared by the deposition of platinum (Pt) film through sputtering instead of conventional dipping into Cu-paste and heat-treatment to prevent their oxidation during TSDC measurement.
The capacitance and dissipation factor (DF) were measured using an LCR meter (HP 4284A, Agilent Technologies Ltd., Hyogo, Japan). The application of dc field and current measurement were conducted using a source-measure unit (Model 237, Keithley Instruments, Cleveland, OH). The details and schematic diagram of polarization and heating profile of TSDC measurement are described elsewhere. Reference Yoon, Randall and Hur16 The procedure is outlined below. The samples were heated to a polarization temperature (T P) 150 °C, which is above the Curie temperature. A dc polarization field (E P) from 0.25 to 70 V/μm, was applied for a polarization time (t P) 10 min. The samples were then rapidly cooled to a starting temperature (T 0) of 30 °C while maintaining the electric field. Thus, the polarization field at the T P of 150 °C will exclusively affect defect dipole and not ferroelectric domains, but the maintained polarization field during the cooling process will also influence the alignment of ferroelectric domains. The samples were then short-circuited by removing the E P. The depolarization currents were then measured when heating the samples up to 450 °C at a constant heating rate of 1.8 °C/min. The microstructures of bulk ceramics and MLCCs were observed using scanning electron microscopy (FE-SEM, Model ULTRAPLUS, Carl Zeiss SMT GmbH, Oberkochen, Germany).
III. RESULTS AND DISCUSSIONS
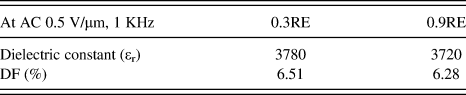
Table I is a summary of dielectric constants and DFs of 0.4 mol% Mn–0.3 mol% Dy-doped BaTiO3 (0.3RE) and 0.4 mol% Mn–0.9 mol% Dy-doped BaTiO3 (0.9RE) MLCC specimens, respectively, that were measured under the condition of AC field 0.5 V/μm at 1 kHz. Both specimens show similar dielectric constants and DFs around 3720–3780 and 6.28–6.51%, respectively.

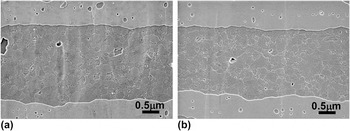
Figures 1(a) and 1(b) show microstructures of 0.3 and 0.9RE MLCC specimens, respectively. Two Ni-inner electrodes and a dielectric layer can be clearly discerned, where the thickness of the dielectric layer is about 4.0 μm. The grain sizes of the samples of 0.3 and 0.9RE are 210 ± 72.9 and 208 ± 68.5 nm, respectively, which is almost the same as each other. It is very important to compare dielectric properties under the same microstructure condition, as the grain size itself has a significant effect on these properties in spite of the same nominal composition.
Microstructures of (a) 0.3RE and (b) 0.9RE MLCC specimens, respectively, that were sintered at 1180 °C for 2 h in a pO2 of ∼10−9.7 atm (H2/N2/H2O atmosphere, 1% H2/99% N2) followed by reoxidation anneal at 1000 °C for 3 h in N2 atmosphere (pO2 = ∼10−5 atm).

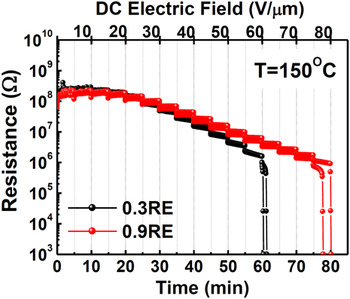
Figure 2 shows electrical resistivity at a high temperature under dc field versus time for the 0.3 and 0.9RE MLCC specimens, respectively. The resistivities were measured at the temperature of 150 °C by applying voltage steps of dc field 5.0 up to 80 V/μm. Each samples of 0.3 and 0.9RE MLCC specimens show resistance drop under the electric field of around 60 and 80 V/μm, respectively. The behavior of resistance degradation is observed to be improved by the increase Dy concentration, that is, the resistance value becomes more stable, and the time and electric field of the loss of resistance increased.
Electrical resistivities versus time at 150 °C under dc field step for the 0.3 and 0.9RE MLCC samples, respectively. These were measured by applying a dc field step of field 5.0 up to 80 V/μm with the time period for each step being 5 min.

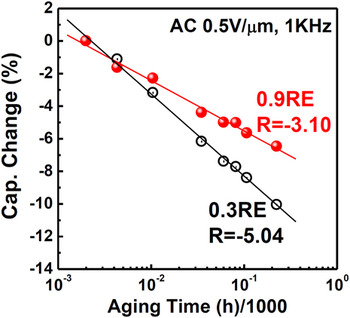
Figure 3 shows a dielectric aging behavior, that is, capacitance change by lapse of time of 0.3 and 0.9RE MLCC specimens, respectively, that were measured under the condition of AC field 0.5 V/μm at 1 kHz. The 0.9RE MLCC specimen shows significantly reduced aging rate of −3.1% per decade compared with that of the 0.3RE specimen of about −5.04% per decade. Therefore, this result demonstrates that the increase of Dy concentration has the effect of decreasing the aging rate.
Dielectric aging behavior, that is, capacitance change by lapse of time of 0.3 and 0.9RE MLCC specimens, respectively, that were measured under the condition of AC field 0.5 V/μm at 1 kHz.

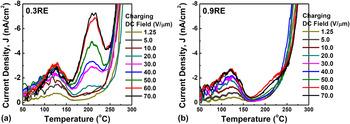
Figures 4(a) and 4(b) show TSDC plots for 0.3 and 0.9RE MLCC specimens, respectively. In these measurements, polarization temperature (T P) and polarization time (t P) were fixed to 150 °C and 5 min, respectively, and polarization dc field (E P) was varied. The 0.3RE MLCC specimen shows two TSDC peaks, whereas the 0.9RE specimen shows one peak. In the first TSDC peak of both samples, there is a systematic increase of the peak with almost fixed T m of around 125 °C with the increase of E P and then shows a saturation behavior beyond an E P of 50 V/μm. These characteristics are a typical behavior of the dipolar polarization process. Reference Liu and Randall17–Reference Fukami, Kusunoki and Tsuchiya19 Beyond the temperature of 300 °C, another high intensity of the TSDC peak appeared in this study, which is supposed to be caused by the release of trapped space charges, and is not discussed here in detail.
TSDC plots for (a) 0.3RE and (b) 0.9RE MLCC specimens, respectively, where the polarization temperature (T P) and polarization time (t P) were fixed to 150 °C and 5 min, respectively, and polarization dc field (E P) was varied.

It should be noted that the second peak observed in the 0.3RE MLCC specimen does not appear in the 0.9RE specimen. The second TSDC peak also increases with almost fixed T m around 210 °C with the increase of E P, and then shows a saturation behavior beyond an E P of 60 V/μm, which suggests that this peak is also associated with dipole relaxation.
TSDC with single relaxation can be mathematically described as the following general equation Reference Liu and Randall17,Reference Vanderschueren and Gasiot20,Reference Grossweiner21 :
 $$J(T) = C{n_0}s\exp \left( { - {E \over {kT}}} \right)\exp \left[ { - {s \over a}\int_{{T_0}}^T \!\!\!{\exp \left( { - {E \over {kT}}} \right)dT} } \right]\quad ,$$
where C is the geometry constant, s is the trap escape frequency factor, a is the heating rate, and n 0 is the carrier density of the filled traps. It is also known that based on Eq. (1), the peak region of TSDC can be described as a universal curve by the following equation Reference Haering and Adams22 :
 $$- \ln \left[ {{{J(T)} \over {{\rm{Const}}{\rm{.}}}}} \right] = {E \over {kT}} + \exp \left[ {{E \over {k{T_{\rm{m}}}}} - {E \over {kT}}} \right]\quad .$$
The activation energy, E, associated with the relaxation process can be evaluated by fitting measured TSDC data to this universal curve equation, Eq. (2).
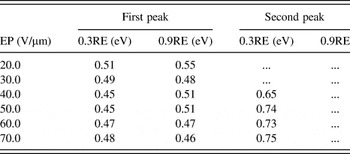
Table II shows activation energies E for the relaxation of the first and second TSDC peaks shown in Fig. 4 for 0.3 and 0.9RE MLCC specimens, respectively. The activation energies for the relaxation of the first peak of both 0.3 and 0.9RE specimens range from 0.45 to 0.55 eV. And those for the relaxation of the second peak of 0.3RE show higher values ranging from 0.71 to 0.75 eV.

The first peak is observed in both samples with similar magnitude to each other. If we assume that it is caused by dipolar relaxation as mentioned above, the most presumable origin would be the relaxation of the spontaneous polarization in the undoped-core region of grains by phase transition.
The second peak, which is observed only in the 0.3RE specimen and not in the 0.9RE specimen, is supposed to be caused by the defect dipole of Mn such as
 ${\rm{Mn}}_{{\rm{Ti}}}^{\prime \prime } {\rm{ - V}}_{\rm{O}}^{\cdot\cdot}$
or
 ${\rm{Mn}}_{{\rm{Ti}}}^\prime {\rm{ - V}}_{\rm{O}}^{\cdot\cdot}$
, as was also reported recently in Mn and V-doped BaTiO3 MLCC.
Reference Yoon, Park, Kim and Kim11
The evaluated activation energies in the range of 0.71–0.75 eV are in good agreement with the reported values.
Reference Liu and Randall17–Reference Fukami, Kusunoki and Tsuchiya19
The high TSDC intensity of the peak of the defect dipole of Mn and significantly high aging rate of the 0.3RE specimen and the disappearance and low aging rate of the 0.9RE specimen experimentally demonstrates that the element Dy has predominantly a role of donor dopant that decreases oxygen vacancy concentration (
 ${\rm{V}}_{\rm{O}}^{\cdot\cdot}$
) and thus the defect dipole of Mn, and that the dielectric aging is controlled by these defect dipoles.
IV. SUMMARY AND CONCLUSIONS
The increase of Dy concentration significantly reduced dielectric aging rate in Dy and Mn-codoped BaTiO3 MLCC. TSDC of a low Dy concentration (0.3RE) specimen showed two peaks, whereas, that of high Dy concentration (0.9RE) showed only one peak. The first peak is observed in both specimens, which is supposed to be related to the relaxation of the spontaneous polarization by the phase transition. The second peak, which is observed only in low Dy concentration (0.3RE) specimen, is supposed to be caused by the defect dipole of Mn such as
 ${\rm{Mn}}_{{\rm{Ti}}}^{\prime \prime } {\rm{ - V}}_{\rm{O}}^{\cdot\cdot}$
or
 ${\rm{Mn}}_{{\rm{Ti}}}^\prime {\rm{ - V}}_{\rm{O}}^{\cdot\cdot}$
. The evaluated activation energies in the range of 0.71–0.75 eV of the second peaks are in good agreement with the reported values. The high intensity of the TSDC peak of the defect dipole of Mn and significantly high aging rate of the 0.3RE specimen and the disappearance and low aging rate of the 0.9RE specimen, experimentally verifies that the element Dy decreases the concentration of the defect dipole of Mn, and thereby, the dielectric aging is reduced. The results of this study show that the behavior of the formation and disappearance of the defect dipoles and its resultant aging behavior can be reflected by TSDC.