Introduction
The Carolinian Zone in Canada is found only in the extreme south west corner of Ontario, where it represents the northernmost edge of the Eastern Deciduous Forest of eastern North America. The Carolinian Zone has long been regarded as a unique ecological region in Canada in which species normally associated with more southerly areas mix with more northerly species to create a region of relatively high biotic diversity (Riverie and Lawrence Reference Riverie and Lawrence1999). The Ontario Carolinian Zone includes both woodland and tallgrass prairie communities. The latter once covered approximately 1000 km2, but less than 3% remains. Most of this habitat was lost 150–200 years ago during European settlement (Reid and Symmes Reference Reid and Symmes1997); although a few significant remnant tallgrass communities remain.
In the Niagara Peninsula, at the eastern end of Ontario's Carolinian Zone, no large relatively intact grasslands or meadow ecosystems remain due to intense human impacts, especially urbanization and intensive agriculture. However, many insect species can persist in relatively small patches of natural or naturalized habitat, and pollinators such as bees (Hymenoptera: Apoidea) can be quite successful in some urban environments (Tommasi et al. Reference Tommasi, Miro, Higo and Winston2004; Cane et al. Reference Cane, Minckley, Kervin, Roulston and Williams2006; Matteson et al. Reference Matteson, Ascher and Langellotto2008). Small pockets of relatively undisturbed habitat, especially woodland edges, grasslands, and meadows, likely have provided refugia for many insect species and supply colonists for new areas of habitat that become available as land use patterns change, especially when people attempt to restore patches of habitat to a more natural Carolinian state.
A major survey and description of the Niagara Peninsula bee fauna is a prerequisite to further studies of bee diversity and population biology. Bee diversity is a good correlate of community biodiversity (Duelli and Obrist Reference Duelli and Obrist1998; Tscharntke et al. Reference Tscharntke, Gathman and Steffan-Dewenter1998), and patterns of bee diversity could be used as a baseline to measure bee community responses to landscape changes resulting from efforts to restore Carolinian flora. Despite the importance of bees as pollinators in natural and agricultural landscapes, their diversity in the Niagara Peninsula is poorly known. Located in southern St. Catharines on the southern crest of the Niagara Escarpment (a UNESCO-designated World Biosphere Reserve), Brock University and the Glenridge Quarry Naturalization Site contain areas of naturalized habitat of various ages. Surrounding habitat includes woodland, suburban gardens, highway corridors with grassy verges, and agricultural areas devoted mainly to cattle feedlots and crops such as corn. Natural areas, including old fields that have been fallow and rarely mowed for as long as 40 years, have been set aside on the Brock University campus. The Glenridge Quarry Naturalization Site was farmed intensively until about 1960 when it became a limestone quarry and then it was a major landfill site from 1976 to 2001. The landfill operation was closed at the end of 2001 and restoration of the site as a park with Carolinian vegetation was completed by 2003, creating a pollinator habitat where none had existed for at least 50 years.
Our first objective was to provide a detailed survey of bee diversity in the Niagara region, focusing on naturalized areas of the Brock University campus and the Glenridge Quarry Naturalization Site. We carried out weekly surveys using three sampling methods: pan trapping, sweep netting from vegetation, and aerial netting from flowers. Although the total geographic area surveyed was relatively small and undoubtedly contains only a portion of the total species pool of the Niagara Region, our study serves as a starting point for an ongoing assessment of the impact of ecological restoration activities on bee diversity, a study of bee population dynamics, and the monitoring of the introduction and possible spread of non-native species (Sheffield et al. Reference Sheffield, Griswold and Richards2010). Our second objective was to compare the sampling results to look for different taxonomic patterns in abundance between the sampling methods (Cane et al. Reference Cane, Minckley and Kervin2000).
Methods
Field sites
Eight 1 ha collecting sites, encompassing a range of disturbance levels from undisturbed meadow to newly seeded ground, were established at Brock University campus (43.119°N, 79.249°W) and the Glenridge Quarry Naturalization Site (43.122°N, 79.237°W). Sampling began in seven of these sites (BrockS, BrockE, BrockN, and PhysEd on the Brock University campus and at Escarpment, Residences, and Pond at the Quarry Site) during the week of 20 April 2003 (week 1). At the eighth site (St. David's) sampling began in week 3 because of considerable construction traffic. A ninth field site (406) was added in week nine. The BrockN site was unexpectedly paved in mid-summer; we immediately replaced it with a very similar contiguous site (BrockW) and the two sites were analysed as a single site. The PhysEd site was difficult to work in and was abandoned in May 2003; the small number of specimens collected there were included in the study.
Except as noted, sites were sampled approximately once a week from 21 April 2003 (week 1) to 1 October 2003 (week 23), using pan trapping, sweep netting of vegetation, and aerial netting from flowers (“flower collections”). Pan trapping began in week 1, sweep netting in week 5 (when vegetation was tall enough for sweeping), and flower collections in week 7. When sampling was interrupted by rain, collections were usually repeated later in the week. Even so, the weekly series of collections at each site were incomplete due to various interruptions. Therefore, for analyses that required equivalent catch effort among one time period, we used a biweekly series of specimens collected in odd-numbered weeks, filling in gaps in the series when necessary with samples collected the week before (if available) or the week after.
Pan trapping
Pan traps (170 gm plastic bowls, SOLO PS6-0099) were laid out in X-shaped patterns when field sites were approximately square (Brock sites), and in H-shapes where field sites were irregularly shaped (Glenridge Quarry sites). In each field site, 10 traps of each of three colours (fluorescent blue Krylon paint #3109, fluorescent yellow #3104, and white; n = 30) were filled with soapy water and placed along transects at 10 m intervals, alternating colours. Traps were put out before 0900 and collected after 1500. Trap contents were poured through a small sieve and the specimens were placed in plastic yoghurt containers labelled with the date and location. Samples were brought back to the laboratory where bees were removed and placed in vials containing 70% ethanol. The vials were labelled with site, date, and collection method.
Sweep netting
Beginning in week 5, bees were collected by two people using sweep nets (BioQuip 7625HS: sail cloth, 38.1 cm diameter, 61 cm wooden handles) in each field site for 30 min between 0900 and 1200 and again between 1300 and 1500. Weekly pan-trap and sweep-net sampling at a field site were often done on different days. The collectors walked beside each other, approximately 3 m apart, following a predetermined route so that the sweeping effort was spread over the entire plot. Each net was continuously swung in a figure-eight pattern from side to side to prevent escape of captured insects. No effort was made to visually locate bees before capture; insects were collected from all vegetation, ground, and air space covered by the sweep path. At the end of the sampling period, the contents of both nets were emptied into a small, clear plastic bag that was labelled with the date and location; it was transported to the laboratory and frozen at −20°C to kill the insects. Bees were then removed and stored in 70% ethanol. Morning and afternoon collections were kept separate.
Flower collections
Beginning in week 7, bees were collected from blooms of flowering plants by two people using collapsible aerial nets (Bioquip 7112CP: 30.5 cm diameter, 12.7 cm aluminum handles). At each field site, sampling proceeded for 5 min in patches of the most abundant flowers (sufficiently abundant that no flowers were repeatedly sampled). This was conducted on the same day as sweep netting. Unlike sweep netting, bees were visually located on flowers and then netted. Flower collections usually took place in the morning and occasionally in the afternoon. Representatives of sampled flowering plant species were collected, pressed, and identified using field guides (Peterson and McKenny Reference Peterson and McKenny1968; Booth and Zimmerman Reference Booth and Zimmerman1972; Dickinson et al. Reference Dickinson, Metsger, Bull and Dickinson2004). The number of collections on each flowering plant species was used as an approximate index of flower abundance, and the average number of bee specimens collected per 5 min sample was used as an index of flower attractiveness. Bee species turnover on flowers was estimated as the average number of bee species collected per 5 min sample.
Identification of bee specimens
Specimens were pinned and labelled according to location, date, collection method, and floral host, when relevant. Most specimens were identified to genus using Michener et al. (1994) and to species using appropriate taxonomic literature (e.g., Mitchell Reference Mitchell1960, Reference Mitchell1962; Laverty and Harder Reference Laverty and Harder1988; Romankova Reference Romankova2004a, Reference Romankova2004b). Voucher specimens were deposited in the Laurence Packer Collection at York University, Toronto, Ontario, and in M. Richards' collection at Brock University.
Biodiversity estimation and statistical analyses
All identified specimens, pooled across collection methods and collection sites, were used to assess total species diversity to provide the widest possible representative sample. We assumed that we did not catch specimens of all bee species present at our sites. To estimate the underlying “true” species richness of the bee community at our sites, we calculated the Abundance-based Coverage Estimator (ACE) and classical Chao1 estimators and chose the higher of the two estimators for the complete data set (Chao Reference Chao1984; Chao and Lee Reference Chao and Lee1992). We also calculated rarefaction curves using the Mao Tau estimator. All three estimators were calculated using EstimateS, version 8.2.0 (Colwell Reference Colwell2009) based on the total data set and the three subsets partitioned by collection method.
Analyses of phenology were based on pan-trap and sweep-net samples caught in odd-numbered weeks, in order to equalize catch effort across weeks and sites.
Results
Bee diversity
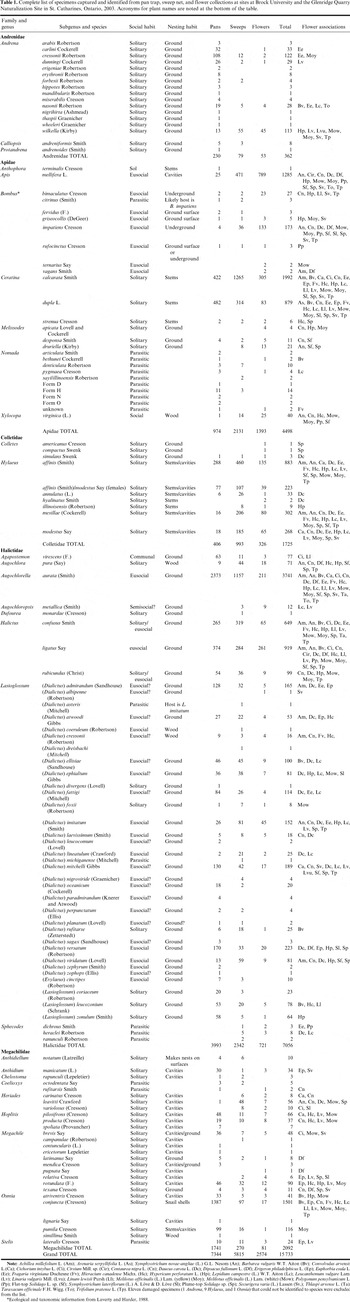
We collected 15733 specimens of 124 species and morphospecies representing five (Halictidae, Colletidae, Andrenidae, Apidae, and Megachilidae) of the six bee families found in North America (Table 1). Halictidae had the highest species richness (44 species) and was the most abundant family, comprising 45% of specimens collected. Colletidae had the lowest species richness (9 species), comprising 11% of specimens. The least common bees were Andrenidae (2%), comprising 17 species that were mostly early season fliers. New species records were added to the list as late as September. The overall distribution of species abundances differed significantly from log-normal (Kolmogorov–Smirnov D = 0.143, P < 0.001; Anderson Darling A2 = 3.090, P < 0.001).

Note:Achillea millefolium L. (Am); Arenaria serpyllifolia L. (As); Symphyotrichum novae-angliae (L.) G.L. Nesom (An); Barbarea vulgaris W.T. Aiton (Bv); Convolvulus arvensis L.(Ca); Cichorium intybus L. (Ci); Cirsium Mill. sp. (Cir); Centaurea nigra L. (Cn); Daucus carota L. (Dc); Dipsacus fullonum L. (Df); Erigeron philadelphicus L. (Ep); Euphorbia esula L. (Ee); Fragaria virginiana Duchesne (Fv); Hieracium canadense Michx. (Hc); Hypericum perforatum L. (Hp); Lepidium campestre (L.) W.T. Aiton (Lc); Leucanthemum vulgare Lam. (Lv); Linaria vulgaris Mill. (Lvu); Linum lewisii Pursh (Ll); Melilotus officinalis (L.) Lam. (yellow) (Moy); Melilotus officinalis (L.) Lam. (white) (Mow); Polygonum pensylvanicum L. (Pp); Flat-top Solidago L. sp. (Sf); Symphyotrichum lateriflorum (L.) A. Löve & D. Löve (Sl); Plume-top Solidago sp. (Sp); Securigera varia (L.) Lassen (Sv,); Thlaspi arvense L. (Ta); Taraxacum officinale F.H. Wigg. (To); Trifolium pratense L. (Tp). Eleven damaged specimens (1 Andrena, 9 Hylaeus, and 1 Osmia) that could not be identified to species were excluded from the list.
* Ecological and taxonomic information from Laverty and Harder, Reference Laverty and Harder1988.
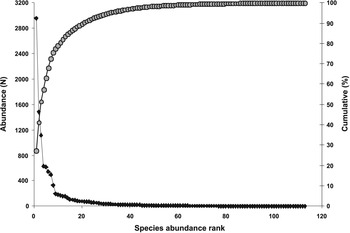
The rank abundance of bees was assessed using specimens collected in biweekly pan-trap and sweep samples at sites sampled from spring through autumn (n = 10789; Fig. 1). The 10 most common species and morphospecies (in order of abundance) were the halictid Augochlorella aurata (Smith), the apid Ceratina calcarata Smith, the megachilid Osmia conjuncta (Cresson), the halictid Halictus ligatus Say, the apid Ceratina dupla L., the halictid Halictus confusus Smith, the colletid Hylaeus affinis (Smith), the apid Apis mellifera L., the halictid Lasioglossum (D.) versatum, and the colletid Hylaeus modestus Say. These 10 species comprised about 80% of all individuals, and the most abundant species, A. aurata, accounted for about 27% of all individuals.

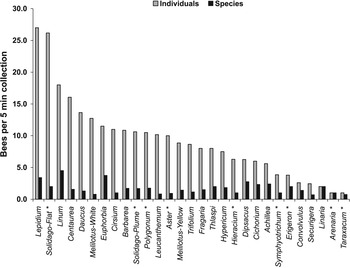
Bees were collected from flowers of 29 plant species (Table 1). The relative abundance of each flowering species (estimated by the number of collections for each species) was correlated with bee abundance (Spearman rank r = 0.77, P < 0.0001) and species richness (r = 0.77, P < 0.0001) (Fig. 2). Flower attractiveness was not correlated with flower abundance (r = 0.19, n.s.), but bee species turnover on flowers was negatively correlated with flower abundance (r = −0.52, P = 0.0049). Flower attractiveness was correlated with the total number of bees (r = 0.72, P < 0.0001) and the total number of species (r = 0.37, P = 0.056) collected on each plant species.

Bee phenology
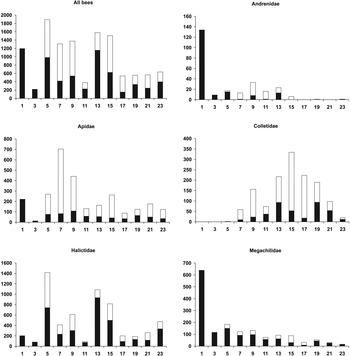
During 2003, three peaks in the abundance of bees collected by sweep netting and pan trapping occurred: in week 1 (late April), in weeks 5–9 (mid-May to early June), and in weeks 13–15 (mid- to late July) (Fig. 3). Relatively large numbers of bees continued to be captured until the end of September when the study ended.

Members of the five bee families exhibited distinct phenologies. Most andrenids represented spring species that overwinter as adults, and the majority of individuals were caught in week 1. However, two relatively common andrenid species appeared in midsummer, Andrena wilkella (Kirby) in week 7 and Calliopsis andreniformis Smith in week 11 (the latter species overwinters as mature larvae). Megachilid phenology also showed a single peak in abundance with the majority of individuals (species of Osmia Panzer) being caught in week 1; >85% of these were males of O. conjuncta. Apid phenology showed three peaks in abundance at weeks 1, 7, and 15. Captured apids were predominantly males of Ceratina dupla in week 1 (about 70%), males of Ceratina calcarata in week 7 (about 60%), and females of Apis mellifera (52%) and C. calcarata (30%) in week 15. Halictids exhibited three peaks of abundance in spring (week 5) and summer (weeks 13–15) with a smaller peak in autumn (week 23). Females of Augochlorella aurata comprised 82% of halictids collected in week 5, but only 26% of those collected in week 15. Colletidae exhibited the shortest flight season, the earliest individuals were caught in week 5. Their peak abundance was in week 15, with 55%–60% of individuals being Hylaeus affinis.
Methodological comparisons
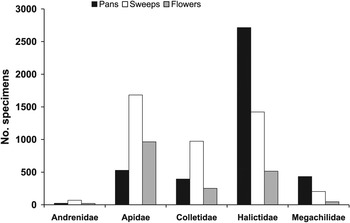
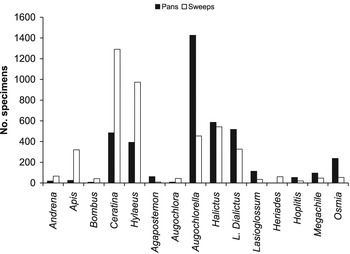
Proportional representation of each bee family varied significantly according to collection method during weeks 7–23, when all three collection methods were being used at all sites (Fig. 4; χ2 = 2206, df = 8, P < 0.0001). The differences in distribution remained even when the comparison was limited to the set of paired pan-trap and sweep-net samples (flower collections were not evenly distributed among weeks or sites; χ2 = 1352, df = 4, P < 0.0001). Halictids and megachilids were caught more often in pan traps, whereas andrenids, apids, and colletids were caught more often in sweep nets. In general, these family-level differences were reflected at the genus level as well (Fig. 5).


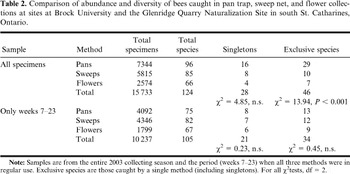
Similar numbers of bees were caught in morning and afternoon sweep samples from the same day (paired t test, t = 1.288, df = 66, n.s.). When sites were sampled with pan traps and sweep nets on the same day, similar numbers of bees were caught with each method (t = 0.611, df = 36, n.s.), but daily species richness was higher in the sweep samples than in the pan traps (t = 1.94, df = 37, P < 0.05). Over the course of the summer, however, more species were caught by pan traps than by the other methods (Table 2). Although the proportions of singleton species did not vary significantly among the three methods, the proportion of exclusive species (those caught only by a single method) was considerably higher in pan traps than in the other methods. However, this higher diversity in pan traps was partly because this was the only method used in weeks 1–4. When the comparison of methods was limited to weeks 7–23, the number of species was greatest in sweep samples, followed by pan traps, and then by flower collections. There were no differences between sampling methods in the proportions of either singletons or exclusive species.

Note: Samples are from the entire 2003 collecting season and the period (weeks 7–23) when all three methods were in regular use. Exclusive species are those caught by a single method (including singletons). For all χ2tests, df = 2.
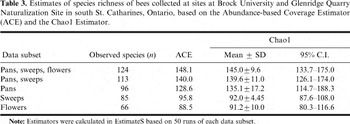
The higher of the two species richness estimators (ACE) calculated using the complete data set (Colwell Reference Colwell2009) suggests that the total number of bee species at our sites was about 148 (Table 3), indicating that as many as 24 additional species were not captured. The ACE and Chao1 estimators for the various data subsets allow further comparison of the efficacy of the various collection methods (Table 3). Total species richness was estimated at 140 species by ACE and Chao1 for the combination of pan and sweep samples. Pan samples alone generated a Chao1 estimate of 135 species, with a confidence interval from about 114 to 188 species (including the observed species richness (124) based on all three methods). In contrast, the species richness estimates based on the sweeps only and flowers only subsets were markedly lower and the upper limits of the 95% confidence intervals for both subsets were well below 124.

Note: Estimators were calculated in EstimateS based on 50 runs of each data subset.
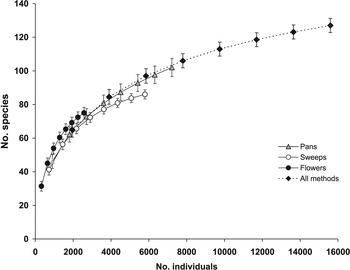
These patterns are reflected in rarefaction curves calculated for each method and for the total collection (Fig. 6). Flower collections yielded the highest species diversity per specimen caught, but total diversity was low because relatively few specimens were caught using this method. Conversely, sweep-net samples yielded the lowest diversity per specimen samples, but total diversity was higher because more specimens were caught. Although partly because the total sample included the pan-trap sample, ollinearity between curves for pan traps and all methods combined suggests that, over time, pan traps would eventually catch as many different species as all methods combined.

Discussion
Niagara Escarpment bee assemblage in 2003
In this survey, we collected 124 bee species and morphospecies that likely represent the majority of bee species in our study sites and perhaps in that part of southern Ontario. As predicted by the ACE and Chao1 estimators, the number of species would certainly have risen if more bees were collected. There are several reasons for this. First, some of the abundant species may represent species complexes of cryptic or currently unrecognizable species. For example, the abundant species, Ceratina dupla, has been shown to comprise two genetically and behaviourally distinct species in the Niagara Region (Vickruck et al. Reference Vickruck, Rehan, Sheffield and Richards2011). Second, new species are probably being introduced into the Niagara Region at an undetermined rate. For example, our capture of a single specimen of the megachilid Megachile ericetorum Lepeletier (Table 1) is the first New World record of this European species (Sheffield et al. Reference Sheffield, Griswold and Richards2010). Another example is Megachile sculpturalis Smith, an Asian species first reported in Canada in 2002 (Paiero and Buck Reference Paiero and Buck2003), that we have observed nesting in abandoned nests of Xylocopa virginica (L.) at Brock University (M. Peso and M. Richards, unpublished data). Third, the large number of singletons we collected indicates that the local bee community includes many rare species that have a low likelihood of being captured and suggests that a resampling of this community in subsequent years may add further names to the species list. Fourth, long-term studies of bee communities indicate that there may be considerable turnover in species composition from year to year (Minckley et al. Reference Minckley, Cane, Kervin and Roulston1999; Grixti and Packer Reference Grixti and Packer2006), suggesting that a single year of sampling cannot provide a complete picture of bee-community composition even in very large surveys. The third and fourth points are especially relevant because the number of species captured in our study represents only about one-third of the bee species recorded in Ontario (C.S. Sheffield and L. Packer, unpublished data).
The majority of species collected in our study were ground-nesters, including the most abundant species (Augochlorella aurata) and the most speciose group (29 species of Dialictus Robertson, a subgenus of Lasioglossum Curtis) (Table 1). Perhaps cavity nesters were less common because our sites were mostly newly restored grasslands that contained little woody habitat with pre-existing cavities suitable for those species. An interesting exception was Osmia conjuncta, one of the more abundant species in our study, and not previously recorded in Canada. It nests in empty snail shells (Cane et al. Reference Cane, Griswold and Parker2007) and its abundance is probably related to the high density of introduced land snails (Cepaea Held) in several of our study sites.
Although little information is available regarding foraging and flower preferences for bees found in the Niagara Region, it appears that most of the pollen collectors are generalists (the only bee species associated with a single flowering plant species were collected as singletons or doubletons). Most of the common, abundant species in our study were collected on flowers of a variety of different plant species. Many of these plants are non-native but are well-established in southern Ontario and are probably important components of Niagara bee habitat. For instance in the Niagara Region, teasel (Dipsacus fullonum L. (Dipsacaceae)) is used as a food plant by several species of Bombus Latreille and as nesting substrate by Ceratina dupla, C. calcarata, and, occasionally, species of Hylaeus F. (Vickruck Reference Vickruck2010), while Queen Anne's lace (Daucus carota L. (Apiaceae)) is an important pollen source for Hylaeus and Lasioglossum (Dialictus).
Bees were collected from flowers of 29 common plant species. Because the number of collections per flowering species was more or less proportional to the relative abundance at each site, we used the number of collections as a measure of flower abundance. We found that flower abundance and attractiveness were associated with a greater abundance and diversity of bees. In both cases, the higher bee diversity is likely to be largely a sampling effect of greater abundance, i.e., an ecological sampling effect related to flower visitations by the bees and a statistical sampling effect related to collecting the bees (Richardson and Richards Reference Richardson and Richards2008). A positive correlation between floral resources and bee abundance and diversity can be interpreted as evidence that the bee community is structured by inter-specific competition (Tepedino and Stanton Reference Tepedino and Stanton1981). However, our approximate, relative measure of floral abundance cannot be used as strong support for such a conclusion (Tepedino and Stanton Reference Tepedino and Stanton1982).
At least 17 of the 29 common plant species that we sampled represent non-native introductions to North America. (In addition to Daucus carota and Dipsacus fullonum these were Achillea millefolium L., Centaurea nigra L., Cichorium intybus L., and Leucanthemum vulgare Lam. (Asteraceae); Barbarea vulgaris W.T. Aiton, Lepidium campestre (L.) W.T. Aiton, and Thlaspi arvense L. (Brassicaceae); Convolvulus arvensis L. (Convolvulaceae); Melilotus officinalis (L.) Lam., Securigera varia L., and Trifolium pratense L. (Fabaceae); Euphorbia esula L. (Euphorbiaceae); Hypericum perforatum L. (Clusiaceae); and Linaria vulgaris Mill. (Scrophulariaceae) as well as an unidentified species of Cirsium Mill. (Asteraceae) which may be non-native). One other species, Linum lewisii Pursh (Linaceae), was introduced from western North America. The impact of this diverse array of invasive herbaceous plants on the local bee community is difficult to assess. Before European settlement, the natural vegetation of the Niagara Escarpment was dominated by deciduous forest (Muller and Middleton Reference Muller and Middleton1994) that probably would have supported a lower diversity and abundance of native bees (Taki et al. Reference Taki, Kevan and Ascher2007) than open meadow habitats would have. Conversely, the subsequent disappearance of native plants from woodlands and meadows of the area is likely associated with the disappearance of their specialist pollinators. Moreover, bee species that nest in substrates associated with woodlands (e.g., Augochlora pura (Say) (Halictidae), which nests in rotting logs and tree trunks) have likely also declined as woodland areas have decreased. However, most of the bee species at our research sites appear to be floral generalists and favour nesting areas that are abundant in open meadows. Generalists likely take advantage of available, plentiful, and reliable sources of pollen and nectar regardless of biogeographic origin. Thus, the change from forest to open habitats with abundant floral resources may have resulted in overall increases in bee abundance and diversity, despite the possible loss of species better adapted to Carolinian forests.
Phenology
Three distinct bee flight seasons, comprising distinct sets of species, were observed in 2003 and this was a pattern reminiscent of other bee assemblages (Griswold et al. Reference Griswold, Parker, Tepedino and Hill1997; Oertli et al. Reference Oertli, Muller and Dorn2005). The early spring bees, which winter as adults (Stephen et al 1969), included species of Osmia and Ceratina Latreille and most of the species of Andrena F. It is likely that these bees forage on willows (Salix L. (Salicaceae)) and early-flowering fruit trees (Rosaceae) including hawthorn (Crataegus L.), apple (Malus L.), pear (Pyrus L.), and wild cherry (Prunus L.). The late spring peak was also composed of species that overwinter as adults. This peak was dominated by overwintered foundresses of Augochlorella aurata, a primitively eusocial ground-nester (the most common bee in our survey) and early emerging species of typical summer-flying genera, notably Megachile Latreille and Hoplitis Klug (Megachilidae). A notable late spring andrenid was Andrena wilkella, a European species with no other representatives of its subgenus (Taeniandrena Hedicke) in North America. The third abundance peak (July) was composed mainly of two distinct sets of bees: the spring (worker) generation of abundant, eusocial halictids such as A. aurata, Halictus ligatus, and H. confusus; and the newly emerged adults of species that overwinter as larvae and pupate in spring, including species in other families from common genera such as Hylaeus and Megachile. A distinctive feature of the whole bee community was the lack of flight activity around week 11, shortly after the summer solstice. This quiescent period partly reflected the gap between provisioning and emergence of the first and second broods of the primitively eusocial and bivoltine species, but also occurred in univoltine, solitary species such as Hylaeus mesillae (Cockerell). The bee species caught in relatively high numbers during week 11 included the univoltine, communal halictid Agapostemon virescens (F.).
Comparison to another southern Ontario bee assemblage
Species richness and the proportion of singletons are two characteristics conducive to comparisons among bee biodiversity surveys (Cane and Tepedino Reference Cane and Tepedino2001). A preliminary survey of symphytan and aculeate Hymenoptera in an Ontario oak savannah found only 40 bee species, although this was from only one day of malaise trap sampling (Sugar et al. Reference Sugar, Finnamore, Goulet, Cumming, Kerr, De Guisti and Packer1998). A more interesting comparison is with two bee diversity surveys carried out in the Caledon Hills, near the eastern boundary of the Carolinian Zone in Ontario. Sampling there found 105 bees, including 14 singletons, in 1968–1969 (MacKay Reference MacKay1970; MacKay and Knerer Reference MacKay and Knerer1979); subsequently 150 species, including 25 singletons, were found in 2002–2003 (Grixti and Packer Reference Grixti and Packer2006). Species richness was underestimated in both studies because large Apidae (such as species of Bombus Latreille and probably Xylocopa Latreille) were excluded. This suggests that the Caledon bee fauna is richer than that in the Niagara Region. Some differences between the two bee communities may reflect natural regional variation. For example, some common Niagara megachilids such as Osmia conjuncta, O. atriventris Cresson, and Megachile brevis Say were rare or absent at Caledon, suggesting differences in the availability of suitable nesting substrate between the two areas. However, the considerably lower species richness in our study suggests that the bee fauna at the Glenridge Quarry (especially) and the various Brock University sites is highly depauperate, likely because of the severe anthropogenic disturbance with little time for recovery at those sites.
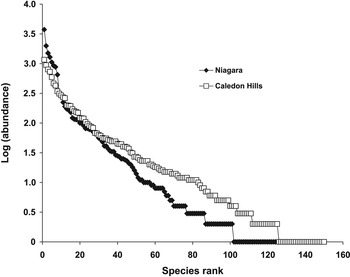
One way of comparing the diversity patterns of two different communities or assemblages is to use the proportions of singletons (Magurran Reference Magurran2004); these did not vary significantly among the two Caledon Hills studies and our Niagara study (χ2 = 0.513, df = 2, n.s.). Another method is to compare the slopes of regression lines drawn through rank-abundance plots (Magurran Reference Magurran2004). Comparison of slopes from the Niagara and 2002–2003 Caledon Hills studies suggests greater evenness in the Caledon bee community and greater dominance in the Niagara community (Fig. 7). Kevan et al. (Reference Kevan, Greco and Belaoussoff1997) suggested that disturbed bee communities deviate significantly from a log-normal abundance distribution, as we observed in our samples. Re-examination of the Caledon Hills data shows that its bee community also exhibited significant departure from log-normality (Kolmogorov–Smirnov: D = 0.109, P < 0.001 (2002–2003 data) and D = 0.093, P < 0.01 (1968–1969 data)) despite being in a habitat that likely is less disturbed than the Niagara habitat. Lack of log-normality in the Caledon and Niagara communities may be a result of high species turnover resulting from high frequencies of transient species. At Caledon there was evidence of considerable change in the bee fauna at annual and decadal scales (Grixti and Packer Reference Grixti and Packer2006; Richardson and Richards Reference Richardson and Richards2008), and there were introduced species in both bee communities that may or may not become permanently established (Paiero and Buck Reference Paiero and Buck2003; Sheffield et al. Reference Sheffield, Griswold and Richards2010). In future monitoring of species abundance at our Niagara sites, it may be useful to separate transient species from permanent residents in order to assess the “true” shape of the local species abundance distributions (Magurran Reference Magurran2004).

Methodological considerations
The use of all three sampling methods (pan trapping, sweep netting, and flower collections) in this study clearly improved our ability to determine the species representation of the local bee community. However, we could only equalize catch effort over time, among sites, and among collectors for two of these methods (pan trapping and sweep netting) because they do not require specialized skill in spotting, identifying, or catching specimens. Although we could not assume that catch effort was equalized among collectors doing flower collections, this method had the advantage of yielding floral association data that could be useful for evaluating and guiding further efforts to restore vegetation at our study sites and similar areas. Pan trapping has the advantages of effective early-season sampling (when effective sweep netting and flower sampling are relatively difficult), 24-h sampling, and requires less time input by collectors. As a result, despite lower daily species richness, we collected more kinds of bees in pan traps than other methods over our 23-week season. Bee abundance in pan traps was significantly correlated with abundance in sweep collections, suggesting that both methods sampled bee populations consistently and could be used to assess population variability. However, efficacy of sampling of different bee species clearly varies between sampling methods. The ease of pan trap use and the possibility for consistent sampling among years and among investigators makes pan traps an attractive option for long-term monitoring of bee communities. However, the differential susceptibility of male and female bees, of foraging and non-foraging bees, and of different species to being caught in pan traps (Cane et al. Reference Cane, Minckley and Kervin2000) should be taken into account. Differential susceptibility to trapping by any method can potentially influence comparisons and interpretations of relative abundance among bee species within years, but should be less critical in comparisons of population and community dynamics across years. Pan-trap sampling in conjunction with nest collections has been successfully used to investigate seasonal phenology (Packer et al. Reference Packer, Gravel and LeBuhn2007; Rehan and Richards Reference Rehan and Richards2010; Richards et al. Reference Richards, Vickruck and Rehan2010).
The primary objective of this study was to provide a preliminary assessment of bee diversity in the Niagara Peninsula in Ontario, Canada. The information presented here provides baseline information for long-term monitoring of Niagara bee community dynamics and can also be used for comparisons with other bee communities in the region and in similar habitats. Future studies should focus on how the Glenridge Quarry bee community adjusts to ongoing successional changes in vegetationas well as year-to-year variation in the population dynamics of abundant species.
Acknowledgments
Nomada and Bombus specimens were kindly identified by Sam Droege (USGS Patuxent Wildlife Research Center) and Sheila Colla (York University), respectively. We also thank Terry Griswold (USDA Bee Lab, Utah State University) and John Ascher (American Museum of Natural History) for help with identifications, Brad Baker for field assistance, Josh Shaw for many hours sorting specimens, and Robb Bennett and Chris Buddle for enlightening critique. This study was funded by an NSERC PGS award to A. Rutgers-Kelly and a Discovery Grant to M.H. Richards. This is contribution number 10 from the Canadian Pollination Initiative (NSERC-CanPolin).