INTRODUCTION
Forest fragmentation, a process that can be natural or anthropogenic, involves the reduction of continuous forest into small, remnant patches, scattered within a matrix of different species composition (Fahrig Reference FAHRIG2003, Saunders et al. Reference SAUNDERS, HOBBS and MARGULES1991). Due to the reduced size of these patches, their plant populations are also smaller and spatial isolation from other populations is often increased (Ellstrand & Elam Reference ELLSTRAND and ELAM1993, Haddad et al. Reference HADDAD, BRUDVIG, CLOBERT, DAVIES, GONZALEZ, HOLT, LOVEJOY, SEXTON, AUSTIN, COLLINS, COOK, DAMSCHEN, EWERS, FOSTER, JENKINS, KING, LAURANCE, LEVEY, MARGULES, MELBOURNE, NICHOLLS, ORROCK, SON and TOWNSHEND2015, Laurance et al. Reference LAURANCE, NASCIMENTO, LAURANCE, ADRADE, FEARNSIDE, RIBEIRO and CAPRETZ2006). Fragmentation per se (sensu Fahrig Reference FAHRIG2003), patch size and patch isolation are important factors influencing the genetic diversity and genetic structure of plant populations; however, the current literature reports contrasting results in this regard (Barrett & Kohn Reference BARRETT, KOHN, Falk and Holsinger1991, Ellstrand & Elam Reference ELLSTRAND and ELAM1993, Vranckx et al. Reference VRANCKX, JACQUEMYN, MUYS and HONNAY2012, Wang et al. Reference WANG, SORK, WU and GE2010, Zhang et al. Reference ZHANG, SHI, SHEN and CHEN2012).
The most common prediction in the literature is that fragmentation per se, patch size and isolation act to increase genetic drift, inbreeding and loss of genetic variability (Couvet Reference COUVET2002, Ellstrand & Elam Reference ELLSTRAND and ELAM1993, Young et al. Reference YOUNG, BOYLE and BROWN1996). This is particularly true for plants with low density, self-incompatible breeding systems and short-distance pollen and seed dispersal (Aguilar et al. Reference AGUILAR, QUESADA, ASHWORTH, HERRERIAS-DIEGO and LOBO2008, Lowe et al. Reference LOWE, CAVERS, BOSHIER, BREED and HOLLINGSWORTH2015, Nason & Hamrick Reference NASON and HAMRICK1997). Contrary to this prediction, some empirical evidence suggests that the genetic diversity and structure of tropical plant species are sometimes unaffected or affected only partially, by these variables (Bacles & Jump Reference BACLES and JUMP2011, Breed et al. Reference BREED, OTTEWELL, GARDNER, MARKLUND, DORMONTT and LOWE2015, Kramer et al. Reference KRAMER, ISON, ASHLEY and HOWE2008, Lowe et al. Reference LOWE, BOSHIER, WARD, BACLES and NAVARRO2005, Reference LOWE, CAVERS, BOSHIER, BREED and HOLLINGSWORTH2015; Vranckx et al. Reference VRANCKX, JACQUEMYN, MUYS and HONNAY2012). This apparent resilience of plant species may be due to an extensive gene flow among fragments in species with highly mobile pollinators and/or seed dispersers (Breed et al. Reference BREED, OTTEWELL, GARDNER, MARKLUND, DORMONTT and LOWE2015, Kremer et al. Reference KREMER, RONCE, ROBLEDO-ARNUNCIO, GUILLAUME, BOHRER, NATHAN, BRIDLE, GOMULKIEWICZ, KLEIN, RITLAND, KUPARINEN, GERBER and SCHUELER2012, Lowe et al. Reference LOWE, BOSHIER, WARD, BACLES and NAVARRO2005, White et al. Reference WHITE, BOSHIER and POWELL2002). Heterogeneity in the response of tropical tree populations to fragmentation per se and the spatial configuration of forest patches may be also due to variation in pre-fragmentation genetic and population structure, life-history traits and mating systems (Breed et al. Reference BREED, OTTEWELL, GARDNER, MARKLUND, DORMONTT and LOWE2015, Cordeiro et al. Reference CORDEIRO, NDANGALASI, McENTEE and HOWE2009, Hadley & Betts Reference HADLEY and BETTS2012, Kremer et al. Reference KREMER, RONCE, ROBLEDO-ARNUNCIO, GUILLAUME, BOHRER, NATHAN, BRIDLE, GOMULKIEWICZ, KLEIN, RITLAND, KUPARINEN, GERBER and SCHUELER2012).
Another important source of variation in the effect of fragmentation per se and the spatial configuration of forest patches on the genetic diversity and structure of the vegetation is the period of time elapsed since fragmentation initiated (Aguilar et al. Reference AGUILAR, QUESADA, ASHWORTH, HERRERIAS-DIEGO and LOBO2008, Wiberg et al. Reference WIBERG, SCOBIE, A'HARA, ENNOS and COTTRELL2016). For instance, in an extensive review and meta-analysis, Aguilar et al. (Reference AGUILAR, QUESADA, ASHWORTH, HERRERIAS-DIEGO and LOBO2008) found that the magnitude of the effect of forest fragmentation on genetic diversity and gene flow increases with fragment age. This review also revealed that very few studies have been conducted in fragments of more than a century in age, even though this represents a short period of time considering the long lifespan of tropical trees (~190 years, Lieberman et al. Reference LIEBERMAN, LIEBERMAN, HARTSHORN and PERALTA1985). There is therefore some risk of underestimating the effect of forest fragmentation on tropical tree genetics in recently shaped fragments. Naturally fragmented forests, which have presented this form for thousands or even millions of years, may therefore be good models with which to assess the long-term effects of forest fragmentation on the genetic diversity and structure of several generations of long-lived tropical tree species (Pither & Kellman Reference PITHER and KELLMAN2002, Shapcott Reference SHAPCOTT2000).
In this study, we assessed the effects of fragmentation per se, patch size and isolation on genetic diversity and genetic structure of the animal-pollinated and dispersed tree Manilkara zapota in a naturally fragmented forest in the Yucatan Peninsula with relatively constant species composition and little anthropogenic influence for at least the last 5000 y (Gutiérrez-Ayala et al. Reference GUTIÉRREZ-AYALA, TORRESCANO-VALLE and ISLEBE2012). We also compared the genetic diversity of the fragments to that of a contiguous continuous forest in the interior of the Peninsula. The study area also represents an island-mainland system that gave us the opportunity to test whether spatial variables of fragments, such as size and isolation, can affect genetic diversity or structure. Owing to the wide variation among the fragments, in terms of size and isolation (Mas & Correa Reference MAS and CORREA2000), this area also represents a useful model for a transversal study of the long-term effect of habitat loss and patch isolation on plant genetic diversity and structure.
METHODS
Study system
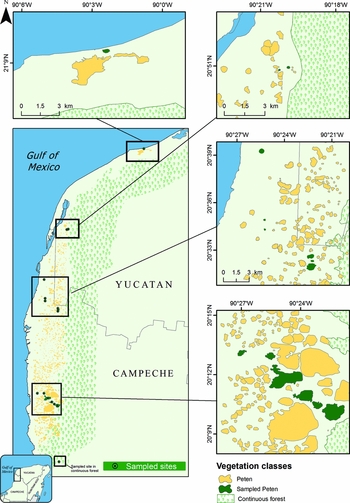
The study area was the Petenes-Celestún-Palmar biological corridor (20°10′–21°9′N, 90°22′–90°2′W), which is located along the north-west coast of the Yucatan Peninsula (Figure 1). In general, the weather is warm subhumid with rains from June to September (Acosta-Lugo et al. Reference ACOSTA-LUGO, ALONZO-PARRA, ANDRADE-HERNÁNDEZ, CASTILLO-TZAB, CHABLÉ-SANTOS, DURÁN, ESPADAS-MANRIQUE, FERNÁNDEZ-STOHANZLOVA, FRAGA, GALICIA, GÓNZALEZ-ITURBE, HERRERA-SILVEIRA, SOSA-ESCALANTE, VILLALOBOS-ZAPATA and TUN-DZUL2010). The representative biomes of the study area are mangrove forest, flooded lowlands, flooded grasslands and naturally shaped semi-evergreen tropical forest fragments scattered within a matrix of wetlands (Durán Reference DURÁN1987, Rico-Gray Reference RICO-GRAY1982). Vegetation in these forest fragments is characterized by taller and more diverse plant species dominated by Manilkara zapota, Metopium brownei, Bursera simaruba, Laguncularia racemosa and Avicennia germinans, compared with that of the matrix, which is dominated by salt- and flood-tolerant plant species, such as the shorter mangrove species (Rhizophora mangle, Conocarpus erectus), sedges (Eleocharis cellulosa, Cladium jamaicense) and cattails (Typha dominguensis) (Durán Reference DURÁN1987, Rico-Gray Reference RICO-GRAY1982). Forest fragments are highly variable in size and degree of isolation (Mas & Correa Reference MAS and CORREA2000); however, toward the interior of the Peninsula the forest becomes continuous (Munguía-Rosas et al. Reference MUNGUÍA-ROSAS, JURADO-DZIB, MEZETA-COB, MONTIEL, ROJAS and PECH-CANCHÉ2014). The adjacent continuous forest presents similar abiotic conditions, species composition and canopy openness to those of the forest fragments; canopy openness is also similar in the matrix, where trees are the dominant life form. This was the case for most of the fragments (14) (Munguía-Rosas & Montiel Reference MUNGUÍA-ROSAS and MONTIEL2014). Palaeoecological research conducted in the study area suggest that only minor variation has taken place in the distribution of halophytic vegetation over the last 5000 y, due to the limited variation in sea level; however, forest species composition has been relatively constant with little anthropogenic influence, at least during this period of time (Gutiérrez-Ayala et al. Reference GUTIÉRREZ-AYALA, TORRESCANO-VALLE and ISLEBE2012).
Distribution map of the 15 fragments sampled (dark-green) located in the Petenes-Celestún-Palmar biological corridor of the Yucatan Peninsula, Mexico. All bars represent 3 km. A contiguous continuous forest is also shown.

The study species was Manilkara zapota (Sapotaceae), which is a long-lived emergent tree, distributed from central Mexico to Central America. It is a dominant canopy species, occurring in a broad range of habitats such as the margins of seasonal swamps, dry upland forest and secondary forest (Pennington Reference PENNINGTON1991). The flowers are self-incompatible, bee-pollinated hermaphrodites and are produced throughout the year (Salinas-Peba & Parra-Tabla Reference SALINAS-PEBA and PARRA-TABLA2007). The fruit is a round to elliptical berry of 4–10 cm in diameter that can hold up to 12 seeds (Pennington Reference PENNINGTON1991). The seed dispersers are flying vertebrates (birds and fruit bats) and terrestrial mammals (tapirs, peccaries and spider monkeys) (O'Farrill et al. Reference O'FARRILL, CALMÉ and GONZALEZ2006, Reyna-Hurtado et al. Reference REYNA-HURTADO, ROJAS-FLORES and TANNER2009, Rivera & Calmé Reference RIVERA, CALMÉ, Estrada, Garber, Pavelka and Luecke2006, Weterings et al. Reference WETERINGS, WETERINGS-SCHONCK, VESTER and CALMÉ2008). Natural populations of M. zapota are found in nearly all forest fragments in the region, as well as in the adjacent continuous forest (Munguía-Rosas & Montiel Reference MUNGUÍA-ROSAS and MONTIEL2014, Munguía-Rosas et al. Reference MUNGUÍA-ROSAS, JURADO-DZIB, MEZETA-COB, MONTIEL, ROJAS and PECH-CANCHÉ2014). However, the high salinity present impedes the survival of this tree species in the habitat matrix (Rico-Gray & Palacios-Rios Reference RICO-GRAY and PALACIOS-RIOS1996).
Sampling
From August to October 2013, we sampled 237 adult M. zapota trees located in 15 different fragments selected based on accessibility (distance between sampled fragments range 0.5–116 km). From five to seven leaves were collected from each individual in the forest fragments (16 adult trees per patch on average were sampled; range: 5–20 individuals per patch) and in the continuous forest (21 randomly selected trees were sampled). The collected leaves were taken to the laboratory and conserved in silica gel (Chase & Hills Reference CHASE and HILLS1991). Sampled trees had a height of between 10 and 30 m, mean dbh of 59 cm (range: 20–206 cm) and were located a minimum of 10 m apart. Variation in the number of sampled individuals was due to variation in the number of available plants (density ranges 10–540 trees ha−1) or limitation in accessibility to the trees and/or leaves. While more trees were available in the continuous forest, we selected only a random sample, which was similar in size to the sample in the fragments in order to avoid sample size effects. No other continuous forest suitable for comparison was found in the study area.
Because plant density affects gene flow of tropical trees (Murawski & Hamrick Reference MURAWSKI and HAMRICK1991), we obtained the density of the study species in each sampled fragment and the continuous forest from a database belonging to one of us (MAM-R). The density of the study species and others was estimated within four belt transects (50 × 4 m; total sampled area: 0.1 ha) randomly placed (see Munguía-Rosas & Montiel Reference MUNGUÍA-ROSAS and MONTIEL2014 for sampling details). In addition, the geographic position of each sampled fragment was recorded with a GPS. Fragment area (mean: 61.5 ha, range: 5–320 ha), edge-to-edge distance to the nearest fragment (mean: 331 m, range: 30–1620 m) and edge-to-edge distance to continuous forest (mean: 15.4 km, range: 3.8–90 km) were calculated from digital cartography, using the most recent images available (2009–2011) and Google Earth Pro 7.2. The spatial data were validated through field observation as a part of another study (Munguía-Rosas & Montiel Reference MUNGUÍA-ROSAS and MONTIEL2014).
Genetic analysis
Genomic DNA was isolated from the collected tissue following a modified cetyltrimethylammonium bromide (CTAB) protocol (Doyle & Doyle Reference DOYLE and DOYLE1987). The set of seven microsatellite primer pairs used in this study (Mh04, Mh06, Mh07 Mh08, Mh12, Mh17 and Mh22) were directly selected and tested from those originally developed for the congener M. huberi (loci characteristics and accession numbers are given in Azevedo et al. Reference AZEVEDO, VINSON and CIAMPI2005). Some of these primer pairs have been successfully used for the species M. zapota and M. maxima (Ganzhorn et al. Reference GANZHORN, THOMAS, GAIOTTO and LEWIS2015, González-Hernández et al. Reference GONZÁLEZ-HERNÁNDEZ, GARCÍA-PÉREZ and GUNTIN-MAREY2012, Thompson et al. Reference THOMPSON, CULLEY, ZUMBERGER and LENTZ2015). Due to the fact that some PCR products presented inconsistent amplification (i.e. potential PCR artefacts that might be incorrectly scored), four of the seven primers tested were discarded, leaving only three microsatellite primers: Mh08, Mh12 and Mh22 to measure genetic variation in all samples. Even though only three microsatellite loci were used, we consider our results to be reliable because the genetic diversity reported is very close to that reported in recent studies, even with the same species in Mesoamerica, as well as with other congeners (Ganzhorn et al. Reference GANZHORN, THOMAS, GAIOTTO and LEWIS2015, Thompson et al. Reference THOMPSON, CULLEY, ZUMBERGER and LENTZ2015). Moreover, previous studies with tropical trees addressing similar questions have successfully utilized a similar number of loci (Dayanandan et al. Reference DAYANANDAN, DOLE, BAWA and KESSELI1999, Ganzhorn et al. Reference GANZHORN, THOMAS, GAIOTTO and LEWIS2015, Lowe et al. Reference LOWE, BOSHIER, WARD, BACLES and NAVARRO2005, White et al. Reference WHITE, BOSHIER and POWELL2002). All this suggests that the number of genetic markers we used was sufficient to detect the levels of genetic variability exhibited by the study species in the study area.
Polymerase chain reaction (PCR) was carried out in a final volume of 20 μL using a PCR Core Kit (Coret Sigma), comprising of 2.0 μL of 1× PCR buffer, 1.5 mM of MgCl2, 250 μM of each dNTP, 1 U of Taq polymerase, 0.28 μM of each of the primer pairs (Invitrogen), 50ng of template DNA and H2O. The PCR amplifications were conducted in a Thermal Cycler (Bio-Rad T100™) under the following conditions: initial denaturation at 94°C for 3 min, followed by 30 cycles of denaturation at 94°C for 15 s, annealing at 56°C for 1 min and extension at 72°C for 30 s, and a final extension step at 72°C for 7 min. To confirm band presence and size, the PCR products were separated on a 2.0% (wv−1) agarose gel electrophoresis. The amplification products were separated by electrophoresis on a 6.0% (wv−1) polyacrylamide gel, using a Sequi-Gen® GT nucleic acid sequencing cell system, following the procedure described by the manufacturer. Following electrophoresis, the gels were stained with silver nitrate (Creste et al. Reference CRESTE, NETO and FIGUEIRA2001) and images captured with a digital camera. Alleles were identified for each locus, and their sizes (bp) were estimated by direct comparisons with the DNA ladders (20, 50 and 100 bp, Sigma) using GelAnalyzer 2010a. To minimize genotyping errors, all allele scorings were double-checked and any uncertainties were confirmed by re-amplification and comparison.
Data analysis
Null alleles, stuttering and large allele dropout were tested using Micro-Checker v2.2.3 (Van Oosterhout et al. Reference VAN OOSTERHOUT, HUTCHINSON, WILLS and SHIPLEY2004). Null alleles were not widespread throughout the populations; only one locus showed evidence of null alleles in only two populations, and these were later corrected using the Brookfield method (Brookfield Reference BROOKFIELD1996). Errors due to stuttering or allelic dropout were not detected. The results for data with corrected and uncorrected null alleles were the same. Tests for Hardy–Weinberg equilibrium (HWE) and linkage disequilibrium (LD) were conducted with Genepop v4.2 (Raymond & Rousset Reference RAYMOND and ROUSSET1995, Rousset Reference ROUSSET2008) and evaluated using a Fisher's exact test.
The genetic diversity indices of each studied population were estimated by calculating the number of alleles per polymorphic locus (A), observed heterozygosity (HO) and expected heterozygosity (HE) and associated 95% confidence intervals (CI), using GenAlEx v6.501 (Peakall & Smouse Reference PEAKALL and SMOUSE2012). Allelic richness (Ar) based on minimum sample size was calculated using FSTAT v2.9.3 (Goudet Reference GOUDET1995). Estimates of the inbreeding coefficient (FIS) were also calculated using Arlequin v3.1 (Excoffier et al. Reference EXCOFFIER, LAVAL and SCHNEIDER2005). Pairwise comparisons, using Student's t-test, were also conducted to test for differences between fragmented populations and continuous forest (null hypothesis: the mean value of genetic diversity recorded in the fragments will be equal to the value of genetic diversity in the continuous forest; with 14 degrees of freedom), for each diversity index (Crawley Reference CRAWLEY2013, Zar Reference ZAR1984).
Mean pairwise FST values were calculated and an analysis of molecular variance (AMOVA) was conducted to estimate structure across populations, using Arlequin v3.1 (Excoffier et al. Reference EXCOFFIER, LAVAL and SCHNEIDER2005). To explore the genetic structure, a multidimensional approach was adopted, using a Principal Coordinates Analysis (PCoA). Plots were constructed using the standardized covariance of genetic distances among individuals with 999 permutations (Martínez-Natarén et al. Reference MARTÍNEZ-NATARÉN, PARRA-TABLA, FERRER-ORTEGA and CALVO-IRABIÉN2014) in GenAlEx (Peakall & Smouse Reference PEAKALL and SMOUSE2012). Isolation by distance was tested by assessing the significance of the correlation between Nei's genetic distance and geographic distance among populations, performing 999 permutations using GenAlEx (Peakall & Smouse Reference PEAKALL and SMOUSE2012) to conduct a Mantel test.
Multiple regression models were performed in order to explore the effect of patch size and isolation (measured as distance to the nearest fragment and distance to the continuous forest), as well as that of M. zapota density on A, Ar, HO, HE and FIS. In the regression models, genetic diversity indices and inbreeding coefficient were included as response variables (five models in total), and fragment area (log-transformed to achieve linearity), distance to the nearest fragment, distance from the focal fragment to the continuous forest and M. zapota density (on a logarithmic scale) were used as explanatory variables. Regression models were run in R 3.3.1.
RESULTS
The Fisher's test revealed significant deviations from HWE at the loci of Mh08 and Mh12 (P < 0.05; P < 0.001, respectively), but this was not constant across all fragments. LD tests detected no significant difference between any two loci for any population. Allelic diversity was significantly lower in the fragments, but the magnitude of this difference was low, particularly in Ar (the difference between continuous and fragmented forest was −21% in A and −5.6% in Ar). In contrast, the fragments showed higher levels of HO in relation to the continuous forest while non-significant differences between forests were observed in HE (Table 1).
Genetic diversity metrics for Manilkara zapota populations in fragmented forest (Fragments) and a contiguous continuous forest on the Yucatan Peninsula, obtained from three microsatellite loci. Genetic diversity metrics were estimated from 21 adult trees in the continuous forest. Data presented for the fragmented forest (n = 15 fragments, 5–20 trees sampled per population) are mean values per fragment. A 95% confidence interval per metric is also shown. Different lowercase letters indicate statistical differences between forest conditions (fragmented vs. continuous). A = average alleles per locus, Ar = allelic richness, HO = observed heterozygosity, HE = expected heterozygosity.

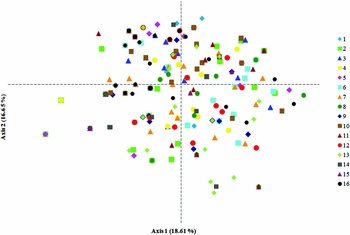
The inbreeding coefficient (FIS) did not differ from zero in any fragment (mean: −0.042, 95% CI: −0.094 to 0.009) or in the continuous forest (0.159). The analysis of molecular variance (AMOVA) revealed that only a small proportion of the variation was partitioned among the 15 fragmented populations (FST = 0.03, P < 0.05) and most genetic diversity was distributed within the populations (97.4%). The results were similar when the analysis included the continuous forest (FST = 0.03, P = 0.0001). Differences among populations were very low, representing only 3% of the total variance. Likewise, in the PCoA (Figure 2), the considerable overlap of individuals or no distinct clustering from different populations revealed that there was no differentiation at the population level, and the first two axes explained only 18.6% and 16.7% of the total variation in the data, respectively. The Mantel test revealed that the landscape-scale genetic structure of M. zapota was not shaped by isolation through distance (r = 0.01, P = 0.2).
Principal coordinates analysis plot base on genetic distances. Relationships among individuals from 16 populations of Manilkara zapota on the Yucatan Peninsula are shown. Numbers in parentheses represent the percentage of the variation explained by each axis.

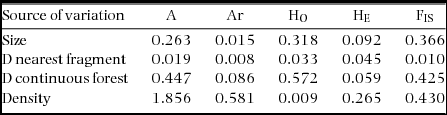
No significant relationships were found between A, Ar, HO, HE and FIS and fragment size, distances to the nearest fragment and to the continuous forest or M. zapota density (Table 2).
Results of multiple regression models to assess the effect of fragment size (Size), distance to the nearest fragment (D nearest fragment), distance to the continuous forest (D continuous forest) and species density (Density) on genetic diversity metrics (A = average number of alleles per locus, Ar = allelic richness, HO = observed heterozygosity, HE = expected heterozygosity) and inbreeding (FIS = inbreeding coefficient) of populations of Manilkara zapota on the Yucatan Peninsula. Data shown are the statistics (F values with 1 and 11 degrees of freedom in all cases). No source of variation was statistically significant for any explanatory variable.

DISCUSSION
In general, our results suggested that fragmentation had only a minor effect on the allelic diversity of M. zapota (a reduction of less than 6% when corrected by sample size), while heterozygosity was either unaffected (H E) or even increased (H O) by fragmentation. In addition to providing evidence of poor genetic structure, the lack of isolation by distance or influence of patch size and isolation on M. zapota genetic diversity supported the notion of high-gene flow among populations. We suggest that the high gene flow mediated by highly mobile seed dispersers conferred some resilience to the M. zapota populations against the long-term effects of fragmentation per se, habitat loss and isolation.
While allelic diversity, measured as the number of alleles per loci, was 21% lower in the fragmented forest compared with the continuous forest, this difference was dramatically reduced to only 5.6% when we took sample size differences into account (Ar; Kalinowski Reference KALINOWSKI2004). On the other hand, the heterozygosity estimates (HO: 0.44–0.72; HE: 0.54–0.68) were similar between the fragmented and the continuous populations. Previous studies have found that allelic diversity (A) is more sensitive than genetic diversity (H) to variation in population size and isolation. This may account for contrasting patterns between metrics of genetic diversity (Comps et al. Reference COMPS, GÖMÖRY, LETOUZEY, THIÉBAUT and PETIT2001). In general, we suggest that the long-term effect of forest fragmentation was only minor in the M. zapota of the study area and can be explained by genetic drift or random variation due to low sample size or a reduced number of loci (Ellstrand & Elam Reference ELLSTRAND and ELAM1993). In fact, the number of alleles and heterozygosity levels found in the fragmented and continuous populations of M. zapota in the study area were similar to those of other natural populations of the same species in Central America (A: 5.8–6.2, HO: 0.43–0.46, HE: 0.49–0.52; Thompson et al. Reference THOMPSON, CULLEY, ZUMBERGER and LENTZ2015). In the congener tree species M. maxima, genetic diversity (HO and HE) in large forests and recently shaped forest fragments (35 y old) also fell within the same range (0.50–0.74; Ganzhorn et al. Reference GANZHORN, THOMAS, GAIOTTO and LEWIS2015). Manilkara zapota (and closely related species) therefore seems to maintain high genetic diversity in a variety of habitats, including continuous forest, young and old forest fragments and managed populations (Thompson et al. Reference THOMPSON, CULLEY, ZUMBERGER and LENTZ2015). This is likely to be due to the actions of highly mobile seed dispersers (bats, birds, monkeys and peccaries), which are able to cross the matrix. Such mobility may be facilitated by the close proximity among fragments (distance to the nearest fragment ranges from 30 to 1620 m), which is shorter than the commuting distance of the seed dispersers (Reyna-Hurtado et al. Reference REYNA-HURTADO, ROJAS-FLORES and TANNER2009, Rivera & Calmé Reference RIVERA, CALMÉ, Estrada, Garber, Pavelka and Luecke2006). Patch size, isolation and plant density did not affect the genetic diversity and inbreeding coefficient. As explained previously, this may be also due to the reduced distance among fragments and high mobility of seed vectors. Moreover, fragment isolation can be measured in many ways (Tischendorf & Fahrig Reference TISCHENDORF and FAHRIG2000) and we therefore cannot rule out the possibility that other isolation metrics may have an effect on genetic diversity.
Due to the limited number of loci, and the fact that only one continuous forest was sampled, our results must be interpreted with some caution; however, the fact that our estimated genetic diversity falls within the same range as that estimated in a previous study (Thompson et al. Reference THOMPSON, CULLEY, ZUMBERGER and LENTZ2015) also suggests that, despite the low number of loci, our estimated values of genetic diversity are reasonably accurate. Regarding replication of the continuous forest, it was not possible to have replicates in this case because only one continuous forest was available. Once again, however, our results are highly concordant with a previous study of a closely related species (M. maxima) that did have more replicates (eight fragments and two large forests) (Ganzhorn et al. Reference GANZHORN, THOMAS, GAIOTTO and LEWIS2015).
The genetic structure of M. zapota was not consistent with geographical distance. In fact, only a small proportion of the genetic variation (3%) was partitioned among the fragments, suggesting that the genetic differentiation of populations was low. In contrast, most of the genetic variation was distributed within populations. Weak genetic structure is actually not uncommon in animal-dispersed, long-lived tropical tree species with an outcrossing breeding system (da Silva et al. Reference DA SILVA, DE OLIVEIRA, LINS-E-SILVA and RODAL2008, Loveless & Hamrick Reference LOVELESS and HAMRICK1984). Similar genetic structure (large genetic variation within populations and little variation among populations) has been found in other populations of M. zapota under contrasting land uses (natural populations, cultivars and home gardens) in different regions of Central America (Heaton et al. Reference HEATON, WHITKUS and GÓMEZ-POMPA1999, Thompson et al. Reference THOMPSON, CULLEY, ZUMBERGER and LENTZ2015) and for M. maxima in a fragmented forest of Brazil (Ganzhorn et al. Reference GANZHORN, THOMAS, GAIOTTO and LEWIS2015). The weak genetic structure reported for M. zapota under contrasting habitats may be indicative of extensive gene flow and also of the fact that the seed dispersers and, to a lesser extent, pollinators are able to move large distances across different habitat matrices. Furthermore, inter-patch movement of pollinators and seed dispersers may be promoted by a patchy distribution of resources i.e. the vectors of pollen and seeds must visit several fragments in order to fulfil their energetic requirements (Loveless & Hamrick Reference LOVELESS and HAMRICK1984).
While M. zapota is pollinated by bees (Salinas-Peba & Parra-Tabla Reference SALINAS-PEBA and PARRA-TABLA2007), and these pollinators cannot move large distances, mean distance to the nearest patches in the study area is less than one kilometre (Mas & Correa Reference MAS and CORREA2000), which thus falls within the dispersion range of bee species such as Apis mellifera (up to 6 km; Dick Reference DICK2001, Hagler et al. Reference HAGLER, MUELLER, TEUBER, MACHTLEY and VAN DEYNZE2011) and Scaptotrigona sp. (up to 1.7 km; León et al. Reference LEÓN, ARIAS-CASTRO, RODRÍGUEZ-MENDIOLA, MEZA-GORDILLO, GUTIÉRREZ-MICELI and NIEH2015) that visit the flowers of M. zapota in the Yucatan Peninsula (Salinas-Peba & Parra-Tabla Reference SALINAS-PEBA and PARRA-TABLA2007). Greater gene flow may be mediated by seed dispersers: fruits of M. zapota are consumed and the seeds are dispersed by birds (Weterings et al. Reference WETERINGS, WETERINGS-SCHONCK, VESTER and CALMÉ2008) and fruit bats (Artibeus sp., Heithaus et al. Reference HEITHAUS, FLEMING and OPLER1975), which can fly over the habitat matrix in the study area for more than 30 km (Montiel et al. Reference MONTIEL, ESTRADA and LEÓN2006). Other highly mobile dispersers are medium-sized terrestrial vertebrates such as spider monkeys (Burgos-Solís & Montiel Reference BURGOS-SOLÍS and MONTIEL2016), tapirs (Reyna-Hurtado et al. Reference REYNA-HURTADO, ROJAS-FLORES and TANNER2009) and peccaries (Perez-Cortez & Reyna-Hurtado Reference PEREZ-CORTEZ and REYNA-HURTADO2008), which have large home ranges (up to ~60 km2, Reyna-Hurtado et al. Reference REYNA-HURTADO, ROJAS-FLORES and TANNER2009) and are able to cross the matrix. Therefore, gene flow mediated by seeds and pollen vectors is a likely explanation for the weak genetic structure of M. zapota seen in the study area.
In conclusion, only minor effects of forest fragmentation could be detected on allelic diversity of M. zapota in the study area, while heterozygosity levels were relatively high regardless of the condition of the forest (continuous vs. fragmented). Furthermore, genetic diversity is not influenced by the spatial configuration of forest patches or by tree density. Weak genetic structure was found and this was likely to have been the result of high gene flow mediated by seed dispersers and, to a lesser extent, pollinators. Manilkara zapota provides a good example of the fact that, when vectors of pollen and seeds are highly mobile, the long-term effects of forest fragmentation, habitat loss and isolation may have relatively little effect on genetic diversity and structure, especially when the distance among patches is exceeded by the home ranges of these vectors of pollen and/or seeds.
ACKNOWLEDGEMENTS
We thank O. Zapata and R. Rodríguez-Canul for allowing the use of their equipment. J. Canul, A. León, C. Mezeta and S. Jurado provided laboratory assistance and P. Villalobos, M. Manzano, M. Améndola and G. León provided help with data analysis. L. Quej, J. Mis, A. Rojas, D. Marrufo, C. Mezeta, S. Montiel, A. Arellano, A. Catzín and B. Magaña helped with fieldwork. This study was funded by CONACyT, projects CB-2012, 177680 and INFRA-2013-204735 (funds to MAM-R). B. Magaña produced the map. K. MacMillan revised the English.