I. INTRODUCTION
Thin film structures are widely used in many technologically important application areas, including microelectronics and optoelectronics devices, magnetic data storage, medical devices, and many more.Reference Malzbender, den Toonder, Balkenende and de With1, Reference Kriese, Boismier, Moody and Gerberich2 An important issue in all of the thin film/substrate systems is the adhesion of the interface between the film and substrate since the interfacial delamination may lead to a system failure even though the film and substrate still satisfy the technical requirements. This issue has therefore attracted a great deal of attention in recent years.Reference Wei and Hutchinson3–Reference Volinsky and Gerberich5
For ultrathin films, the thickness of the films is usually in the order of few hundred nanometers. Therefore, it is difficult to measure their interfacial adhesion properties using conventional mechanical testing techniques, such as tensile and bending tests. On the other hand, nanoindentation techniques,Reference Kriese, Gerberich and Moody6–Reference Marshall and Evans9 such as spherical,Reference Swain and Menčik10 conical,Reference Volinsky, Moody and Gerberich11, Reference Volinsky, Vella and Gerberich12 and wedge indentation experiments,Reference Begley, Mumm, Evans and Hutchinson13–Reference De Boer and Gerberich15 have been proven very effective in the investigation of interfacial delamination of thin film systems. During the nanoindentation tests, the interfacial delamination can be reflected and identified by characteristic changes in the indentation load–displacement curves (P–h curves). For example, Swain and MenčikReference Swain and Menčik10 demonstrated various responses in the indentation load–displacement curves caused by the interfacial delamination during spherical indentations. Later on, Drory and HutchinsonReference Drory and Hutchinson16 developed a conical indentation analysis to assess the interface toughness. Furthermore, a wedge indentation method has been developed.Reference De Boer and Gerberich14, Reference De Boer and Gerberich15, Reference Vlassak, Drory and Nix17 Recently, Yeap et al.Reference Yeap, Zeng, Jiang, Shen and Chi18, Reference Yeap, Zeng and Chi19 adopted the wedge indentation method and focused ion beam (FIB) technique to determine the interfacial toughness of the ultrathin continuous film on substrate [low-dielectric constant (low-k) films on silicon (Si) substrate]. Compared to spherical and conical tips, the wedge indenter is capable of producing high driving force, and thus it does not penetrate into the substrate for inducing the interface crack. In addition, the delamination crack is eventually propagated into the surface and, therefore, can be relatively easily observed from the surfaces around the wedge indentation impression, making the interpretation of the experimental phenomena easier. Thus, it is considered as a potential powerful experimental method to determine interfacial properties. However, deriving interfacial adhesion properties from the wedge indentation is still a challenging issue because analytical methods are generally not feasible for the explanation of the indentation test results.Reference Yeap, Zeng, Jiang, Shen and Chi18, Reference Yeap, Zeng and Chi19 Therefore, finite element (FEM) simulations are often used to interpret the experimental results.Reference Chen, Yeap, Zeng and Liu20–Reference Schulze and Nix23
In view of simulating the interfacial delamination processes induced by a wedge indentation, many studies have used a traction–separation lawReference Tvergaard and Hutchinson24, Reference Tvergaard and Hutchinson25 (cohesive zone model) to describe the adhesive and failure behaviors of the interface between film and substrate. In the traction–separation law, interfacial properties are characterized by two parameters: interfacial strength, σs, which is the peak traction (stress) to separate an interface, and interfacial energy, Γ0, which is the work-of-separation per unit area of the interface. An advantage of using this traction–separation law to simulate the wedge indentation process is that it is not necessary to make assumptions that interfaces are fully bonded, fully debonded, or precracked because the interfacial delamination criterion is inherently included in the traction–separation law. Thus, it can capture and predict both the onset and propagation of interfacial delamination during a wedge indentation process. Most of these works, however, were limited in the two-dimensional (2D) simulation of indentations. In fact, the mechanics of indentation may be in a three-dimensional (3D) stress state unless the indenter is long enough compared to the other characteristic system dimensions, such as the film dimension or indentation depth.
On the other hand, recent experiments by Yeap et al.Reference Yeap, Zeng, Jiang, Shen and Chi18, Reference Yeap, Zeng and Chi19 on continuous film [BlackDiamond (BD) film on Si substrate] have showed that the stress state near the ends of the wedge indenter in the length direction (hereafter refers to the “end of the wedge indenter”) changes from a plane strain condition to a 3D strain status, and the contour of the interfacial crack front also changes gradually from a narrow strip shape to an elliptic shape as the film thickness or indentation depth increases. It is known that the growth contour of the interfacial crack should be a straight line if the indentation is in the plane strain state. The appearance of the elliptical-shaped contour of the interfacial crack indicates that the wedge indentation is in 3D stress state. Therefore, it is necessary to perform 3D FEM modeling of interfacial delamination by wedge indentation to interpret experimental phenomena or determine the interfacial properties. Recently, She et al.Reference She, Zhang and Zeng26 conducted a 3D FEM simulation to study the interface cracking of a ductile thin film subjected to wedge indentation. Their work only focused on the effect of the length of the wedge indenter on interfacial crack shapes and stress states under different indentation depths, whereas the film thickness was fixed. Moreover, the evaluation of the stress states during indentation was based on the value of hardness calculated by using the Oliver and Pharr’sReference Oliver and Pharr27 method; however, the hardness values are not directly related to the interfacial delamination process, in addition, the hardness values from wedge indentation are not well-defined as the indenter shape is difficult to be determined for wedge indentations. Furthermore, a thorough comparison between the simulation and experimental results has not been done in the work by She et al.Reference She, Zhang and Zeng26
Following the previous works,Reference Yeap, Zeng, Jiang, Shen and Chi18–Reference Chen, Yeap, Zeng and Liu20, Reference She, Zhang and Zeng26 this study further investigates the effects of wedge indentation length and film thickness to the stress states of the wedge indentation-induced interfacial delamination in a soft-film-on-hard-substrate (SFHS) system using the 3D FEM simulation, and followed by a detailed comparison with the experimental results. To compare with the experimental results, the simulation in this work specifically uses the properties of the BD-film/Si-substrate systems. Different from the previous work by She et al.,Reference She, Zhang and Zeng26 the effects of both the wedge indenter length and the film thickness on the interface delamination processes are analyzed. It is shown that a 2D to 3D transition of stress states occurs depending on the ratio of indenter length to film thickness. Furthermore, the interfacial delamination process by wedge indentations is also studied experimentally with the wedge indenters of different lengths as well as the samples with different film thicknesses, and the results from simulations are found to be in good agreement with the experimental results. Compared to the evaluation of stress states by hardness values,Reference She, Zhang and Zeng26 a more straightforward criterion based on the curvature of the delamination crack front is introduced to indicate the transition of stress states during the interfacial delamination. Finally, a guideline was therefore proposed to classify the 2D and 3D stress states for extracting the interface adhesion properties.
II. COMPUTATIONAL MODEL
A. Cohesive zone model
A cohesive zone modelReference Xu and Needleman28 is used to simulate the interfacial delamination process during wedge indentation. A single mode traction–separation law is first introduced [Fig. 1(a)], and δ 1, δ 2, and δ 3 are the separations in the normal, first, and second shear directions, respectively. Likewise, t 1, t 2, and t 3 are the tractions in these three directions.  ,
 , and
 represent the peak values of tractions, i.e., strengths, when the separation is either purely normal to the interface or purely in the first or second shear direction.
 ,
 , and
 are the quantities that represent the critical separations at the onset of delamination in these three single mode conditions, where K is “penalty stiffness.” The area under the single mode traction–separation curve, corresponding to the respective (Mode I, II, or III) fracture toughness (G IC, G IIC, and G IIIC, respectively), defines the final separations,
 ,
 , and
 corresponding to complete failure.
Schematic diagram showing the traction–separation law used for finite element (FEM) simulation: (a) single mode; (b) mixed mode.

However, the wedge indentation problem requires a mixed-mode implementation of this cohesive model. Therefore, the traction–separation law proposed by Tvergaard and HutchinsonReference Tvergaard and Hutchinson24, Reference Tvergaard and Hutchinson25 is used to combine the normal and shear displacements into a single parameter for the mixed-mode effects. As shown in Fig. 1(b), the total mixed-mode separation, δ m, is given by:

The constitutive equation for mixed-mode loading is defined as:

where Dsr is the damaged elasticity matrix, which has the form:
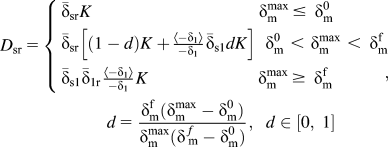
where  is the Kronecker delta function, K is the “penalty stiffness,” d is the damage evolution function,
 and
 are the mixed-mode separation corresponding to damage initiation and total failure, respectively, and
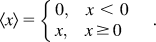
 is the maximum mixed-mode separation during the loading or unloading process. The Macauley operator 〈·〉 is defined as:
It should be noted that if the maximum mixed-mode separation meets the condition of  , the traction–separation law remains reversible. Nevertheless, for
 , an irreversible unloading path is used so that unloading occurs linearly toward the origin of the traction–separation plane [Fig. 1(b)].Reference Tvergaard and Hutchinson24, Reference Tvergaard and Hutchinson25
The maximum nominal stress failure criterion29 is used to predict the onset of delamination. Due to the fact that the compressive normal tractions do not affect the onset of delamination, it can be expressed as:
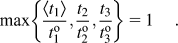
Assuming interfacial strength,  , Eq. (5) can also be written as:

In addition, a linear failure criterion is used to predict delamination propagation under mixed-mode loading as:
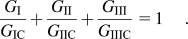
Assuming interfacial energy (toughness), Γ0 = G IC = G IIC = G IIIC, we have:

where the quantities G I, G II, and G III refer to the work done by the traction and its conjugate separation in the normal, first, and second shear directions, respectively.
B. Model description
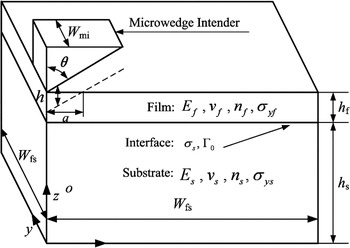
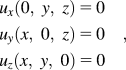
Considering a wedge indentation of a typical film–substrate system, as illustrated in Fig. 2, the indenter is a wedge-shaped tip with an inclusion angle, 2θ; and the wedge length is 2W mi. Due to its symmetry along the y-axis and x-axis, only a quarter of the system is modeled in the 3D simulations. The boundary conditions applied to the system are such that:
Schematic diagram showing the geometries and material parameters of the wedge indentation on a film/substrate system. The coordination system is indicated in the diagram, and h denotes the indentation depth.

where ui (i = x, y, z) is the displacement in the x, y, or z directions. Loading is imposed to the indenter under displacement-controlled conditions as:

where h is the indentation depth, which is to be at maximum of 1.0 time of the film thickness.
In this simulation, all the parameters in the length scales are normalized by a length, Δ0 = 1μm, for convenience. The geometric values (Fig. 2) are chosen as following: the thickness of substrate is h s = 4 Δ0, and the width of the system is taken to be W fs = 10 Δ0. To capture the 2D to 3D stress state transition, the thickness of film h f and the length of wedge intender W mi are varied as: hf / Δ0 = 0.1, 0.3, 0.5, 0.7, 1.0 and W mi / Δ0 = 0.5, 1.0, 2.0, 3.62, respectively. For simplicity, the wedge indenters are assumed to be rigid bodies with an inclusion angle of 2θ = 120°.
Both thin film and substrate are considered to be isotropic and are modeled as elastoplastic materials based on J 2 theory, and the stress–strain relation is:

where σ y is the yield strength, and N is the strain hardening exponent. In this article, we only present the simulations for the thin film of which elastic modulus, hardness, and yield strength are lower than those of the substrate, known as SFHS system. In this way, as the yield strength of substrate is very high, during the simulation, the substrate almost deforms elastically and nearly no plastic deformation occurs in substrate. These conditions are based on the experimental observation reported earlier.Reference Yeap, Zeng, Jiang, Shen and Chi18, Reference Yeap, Zeng and Chi19 The properties of low-k film (BD)Reference Yeap, Zeng, Jiang, Shen and Chi18, Reference Yeap, Zeng and Chi19 are used as film properties, and its elastic modulus and hardness can be determined by a normal indentation with standard Berkovich indenter tip, which will be described in detail in “Experimental procedure.” However, the yield strength and strain hardening exponent cannot be determined directly from the indentation experiment. Therefore, Johnson’s analysis30 was used to estimate the yield strength after acquiring the elastic modulus and hardness of the film, and the values of yield strength and strain hardening exponent can be adjusted by matching the simulation and experiment curves before the onset of interfacial delamination.Reference Chen, Yeap, Zeng and Liu20 The substrate is assumed with the properties same as those of silicon, and the yield strength of the substrate is estimated from its hardness values. The detailed material parameters are tabulated in Table I.
Material properties of film and substrate used for simulation.

BD, BlackDiamond.
The interface adhesion properties are determined from the interface energy–strength contour developed in an earlier studyReference Chen, Yeap, Zeng and Liu20; these values are: the interfacial strength of σ s / σ yf = 0.5 and the interfacial energy value of Γ0 / σ yfΔ0 = 0.006, again, the interfacial properties are normalized by the yield strength of the film and the length scale.
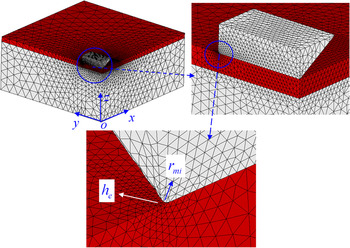
The 3D FEM simulations are performed with displacement control using the commercial software ABAQUS. The interface is modeled with 3D cohesive elements with six nodes and three integration points (COH3D6); and the film and substrate are modeled with four-node linear tetrahedron elements (C3D4). The sizes of the elements within the indentation contact area are refined carefully because of the strong stress gradient and difficult convergence. The detailed FEM model is shown in Fig. 3. To accommodate the stress gradient and requirement of convergence, the size of the minimum elements in the film, h e, near the end of the wedge tip is set to be lower than 0.02 times the length scale Δ0 = 1 μm, and h e increases with the distance from the indenter with a ratio 5.0 in the x-direction and 10.0 in the y-direction and z-direction. The radius r mi of the chamfer curve of the indenter is artificially set as r mi / Δ0 = 0.05. Each FEM model contains at least 83,658 elements and 15,555 nodes. The validation and convergence of the mesh size described above have been confirmed in the simulations.
The three-dimensional (3D) FEM mesh used in the simulations. (color online)

The master-slave contact mechanism is applied between the wedge indenter and the film. Friction is not considered, and small sliding conditions are adapted. The contact algorithm used in this analysis is augmented Lagrange method. The maximum indentation depth during simulation is kept less than the film thickness. In this simulation, the piling-up and the sinking-in during the indentation on soft films are not considered for simplicity. In addition, residual stress in the film and film radial cracks are not included. As it will be discussed later in this article, the film radial crack affects the delamination crack shape only near the two ends of the wedge indenter, and the crack front shape is not affected by the radial crack in the films.
III. EXPERIMENTAL PROCEDURE
The BD films investigated by wedge indentation experiments have various thicknesses of 100, 300, 500, 700, 1000, and 1200 nm, respectively. To study the interfacial delamination process, wedge indentation experiments are conducted by using diamond wedge tips with 120° included angle and two wedge lengths of l = 2W mi = 4.06 μm and l = 2W mi = 7.24 μm using a commercial nanoindenter machine (UMIS-2000H; CSIRO, Sydney, Australia). The lengths of the wedge tips were measured from scanning electron microscope images. The indentation test consists of three segments: (i) loading to the predefined maximum load in 20 s, (ii) holding at the maximum load for 5 s, and (iii) unloading to 30% of the maximum load in 20 s. For every case, 20 indentation tests are performed at the indentation load, which leads to the interface crack kinking to the film surface.Reference Yeap, Zeng, Jiang, Shen and Chi18, Reference Yeap, Zeng and Chi19 Field-emission scanning electron microscopy (FESEM) (JEOL JSM-5700F; JEOL Corporation, Tokyo, Japan) is used to capture the plane view images of the delaminated area. In addition, an FIB (Quanta 2003D; FEI Company, Hillsboro, OR) is used to make cross-sectional cuts at the middle of the wedge indentation impression to view the interfacial delamination profile (not shown in this article). The details of experiments and analyses are presented earlier.Reference Yeap, Zeng, Jiang, Shen and Chi18, Reference Yeap, Zeng and Chi19
IV. RESULTS AND DISCUSSION
A. Computational predictions
1. Basic model behavior
In view of simulating the interfacial delamination processes induced by a wedge indentation, 2D plane strain models have been well established earlier.Reference Chen, Yeap, Zeng and Liu20–Reference Schulze and Nix23 However, generally speaking, the wedge indentation induces a 3D stress state unless the indenter is long enough compared to the other characteristic lengths, such as the film dimension and the indentation depth.
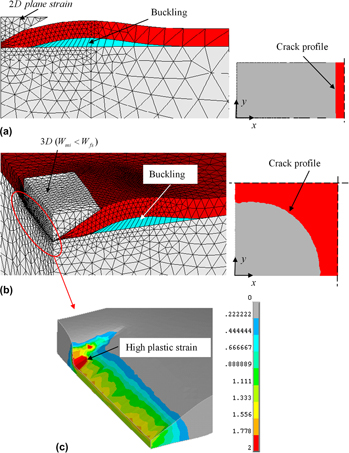
In this study, 3D stress state is modeled with the length of the wedge tip less than the width of the sample (Fig. 2), i.e., W mi < W fs. For comparison, 2D plane strain models are also modeled with the length of the wedge tip greater than or equal to the width of the sample, i.e., W mi ≥ W fs. Figure 4 compares the indentation deformations, film buckling, and interface crack profile for the SFHS system under both the 2D plane strain condition (W mi = W fs) and 3D stress state condition (W mi = 0.2W fs = 2Δ0; other parameters were described in “Model description” at the indentation depth of h = 0.8h f, where the film thickness is h f = 0.5Δ0. In both cases, the interfacial properties are taken to be the same as σ s / σ yf = 0.5 and Γ0 / (σ yfΔ0) = 0.006. To better show the difference of crack profiles in the y-direction (Fig. 2) between the 2D and 3D models, the crack line path under 2D plane strain condition is extruded along the y-axis to the area crack profile as shown on the right side in Fig. 4(a). It appears that during indentation, as the indentation depth increases, the stress in the x-direction σxx (Fig. 2) induced by the indenter simultaneously increases, causing a large displacement in the x-direction within the film. Meanwhile, the deformation within the substrate remains small and cannot accommodate this large deformation. The mismatch between substrate and film deformation leads to the interfacial crack propagation in the x-direction. When σxx exceeds a critical value, buckling occurs and the film lifts off from the substrate. For the 2D plane strain case, the σxx is nearly the same along the y-direction (Fig. 2). As a consequence, the crack front is almost parallel to y-axis as shown in Fig. 4(a). Note that the crack front contours are obtained when the damage evolution function in Eq. (3) is unit (d = 1), which also means:

The film deformations and crack front profiles with σ s / σ yf = 0.5, Γ0 / (σyfΔ0) = 0.006, W mi / Δ0 = 2.0, and h f / Δ0 = 0.5 at indentation depth of h = 0.8h f: (a) two-dimensional (2D) plane strain condition with W mi = W fs; (b) 3D stress state with W mi < W fs; and (c) distribution of plastic strain in the region near the indenter. (color online)

On the other hand, the 3D case possesses nonuniform distribution of the resistance to interfacial delamination along the y-direction. In this simulation, the resistance to interfacial delamination includes two parts: the plastic dissipation and the interfacial toughness (cohesive energy). As shown in Fig. 4(c), higher plastic strain is observed in the region at the “end of wedge indenter.” This means more plastic dissipation is required in this region. Although we assume the cohesive energy is the same everywhere during the simulation, the resistance to interfacial delamination at the “end of wedge indenter” is larger than that along the side of the indentation. Therefore, the growth of crack front at the end of indenter is slower, and the crack front is not straight-sided but elliptical in shape as plotted in Fig. 4(b). Similar results were also observed in earlier experimental works.Reference Yeap, Zeng, Jiang, Shen and Chi18, Reference Yeap, Zeng and Chi19
2. Effects of indenter length and film thickness
It is known that the global behavior of interfacial delamination process during wedge indentation can be depicted from the characteristics of the indentation load–displacement (P–h) curve. Thus, the effects of indenter length and film thickness on the P–h curves are systematically investigated in this study.
a. Effect of indenter length
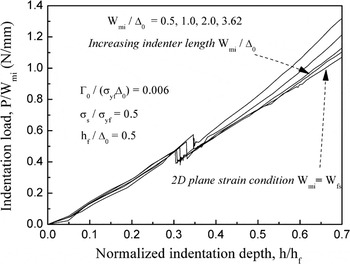
Figure 5 shows the P–h curves as the function of the indenter lengths of W mi / Δ0 = 0.5, 1.0, 2.0, and 3.62. It is found that while increasing the indenter length W mi / Δ0, the corresponding P–h curve gradually approaches the case of 2D plane strain condition for a given indentation depth. This observation indicates that the indenter length is one of the key parameters controlling the 2D to 3D transition of stress states. It is also noted that if the indenter length is shorter, the critical indentation depth at the onset of the interfacial delamination becomes deeper, and the corresponding indentation load is higher. Therefore, when comparing the 2D FEM simulation results with the wedge indentation experiments, if the wedge tip used in experiments is not long enough (3D), then for the given interfacial properties, the 2D simulated critical indentation load will be lower than the experimentally measured one (3D) as indicated in Fig. 5. On the other hand, at a given critical load, the interfacial properties determined from the simulation will be higher than the experimentally determined values. These are consistent with previous 2D FEM simulation results.Reference Chen, Yeap, Zeng and Liu20 One of the possible reasons for this is the energy consumption, i.e., the resistance to interfacial delamination at the two ends of the indenter is larger than that at the side of the indentation impression as stated in “Basic model behavior.” It is easily understood that the energy consumption at the ends of indenter accounts for higher percentage with decreasing the length of the indenter. Hence, the shorter indenter will cause a delay in the interface delamination, and the overall indentation load will increase with decreasing the length of the indenter.
Indentation load–depth curves for a range of wedge indenter lengths with a fixed film thickness of h f / Δ0 = 0.5.

b. Effect of film thickness
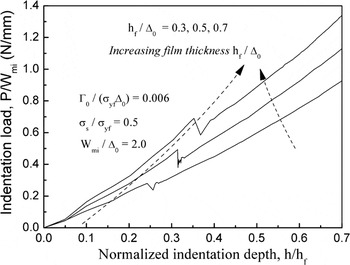
The P–h curves have also been obtained by solely varying the thicknesses of the film from h f / Δ0 = 0.3, 0.5 to 0.7 as shown in Fig. 6. It is found that an increase in film thickness increases both critical indentation load and indentation depth for the onset of delamination. This means that it requires a large driving force to initiate the delamination for thicker film. One likely explanation for this characteristic is that the thicker film may serve as a buffer layer, which reduces the driving force and therefore delays the delamination, resulting in an increase in both critical indentation load and depth.
Indentation load–depth curves for a range of film thicknesses with a fixed wedge indenter length of W mi / Δ0 = 2.0.

It is worthwhile noting that by comparing Figs. 5 and 6, it is found that the decrease of indenter length and the increase of film thickness lead to the same directional change of the P–h curves, i.e., the increase of critical indentation depth and load for delamination. Since the dimension of the specimen is infinite compared to the film thickness and indenter length, it is reasonable to conclude that in addition to the effects on the P–h curves, decreasing indenter length and increasing film thickness have the same effects on the whole interfacial delamination process, including the delamination crack shapes and stress states, and thus the film thickness can be considered as another key parameter that dictates the 2D to 3D transition of stress states during wedge indentation.
For axisymmetrical indentations, it is common to use the ratio of the contact radius to film thickness. As mentioned in “Computational model,” the pile-up or sink-in during indentations is not considered in the present FEM models. Accordingly, the contact radius a can be readily estimated by the indentation depth, h and half of the inclusion angle for wedge indenter tip, θ (Fig. 2):

In that case, the ratio of contact radius to film thickness can be expressed as:

However, this ratio is only useful for 2D cases, i.e., in the section normal to the length of the wedge indentation impression, it does not, however, reflect what happened along the length direction of the wedge indentation. Also, for thin film system, this ratio may break down if the contact radius is larger than film thickness. Therefore, in this article, for the 3D analysis, we utilize the ratio of indentation depth to film thickness instead of the ratio of contact radius to film thickness with consideration of the fixed value of θ in Eq. (14).
B. Comparison between computations and experiments
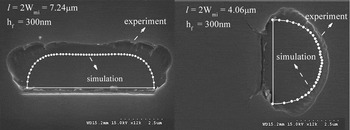
As discussed earlier, the 3D case of interfacial delamination possesses an elliptical-shaped crack profile; therefore, the indenter length and the film thickness are the two key dimensional parameters affecting the delamination crack shapes and stress states. Therefore, the effects of those two parameters on crack profile shape are investigated in this simulation with the indenter length values of W mi / Δ0 = 0.5, 1.0, 2.0, and 3.62 and film thickness in the range of h f / Δ0 = 0.1, 0.3, 0.5, and 1.0. To compare with the simulation results, a series of wedge indentation experiments using the wedge tips with the lengths of l = 4.06 and 7.24 μm on the samples with the film thicknesses of 100, 300, 500, and 1000 nm are conducted. Due to l = 2W mi, for the cases with l = 7.24 μm in experiments, the corresponding indenter length in computation is W mi = 3.62Δ0 = 3.62 μm; likewise, for l = 4.06 μm in experiments, W mi = 2Δ0 = 2.0 μm. Figure 7 superimposes the computational crack front profiles on the FESEM plane view images of the experimental crack profiles resulting from the wedge indentations with the two wedge lengths on the sample with the film thickness of 300 nm. It can be easily noticed that the crack front profiles from computational simulation and experimental studies are matched very well for most part of the crack front except the delaminated region near the “end of the indentation impression.” This discrepancy is most likely due to the fact that the crack propagation is not stable during the initial stage of delamination, which just corresponds to the delaminated region near indenter, as reported by Hutchinson and Suo.Reference Hutchinson, Suo, Hutchinson and Wu31 Another possible reason for this discrepancy is that the FEM model does not account for the radial cracks near the ends of the indenters, whereas the experiments clearly show the cracks in these positions. Despite these, the shapes of crack front profiles in experimental studies and computational simulation follow the similar trend with the changes of the indenter length, i.e., the longer indenter (l = 7.24 μm) results in a relatively straight-sided crack front and the shorter indenter (l = 4.06 μm) results in a more curved crack front.
Comparison of crack front profiles from the experiments and simulations for the wedge indentations with two different lengths of the wedge indenter tips on the same film.

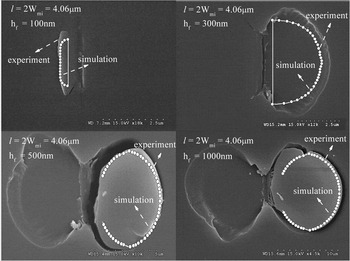
Following this comparison, the computational and experimental crack front profiles are further compared on the samples with different film thicknesses at a constant wedge length of l = 4.06 μm, and the results are shown in Fig. 8. Again, the experimental crack front profiles are found to be nearly identical to the computational ones except the small region near the end of the indenter. In addition, the numerical and experimental crack front profiles also yield the same trend, i.e., the higher film thickness corresponds to the more curved profile, and vice versa.
Comparison of crack front profiles from the experiments and simulations for different film thicknesses with the same wedge indenter tip.

C. Stress state of interfacial delamination
1. A curvature-based criterion
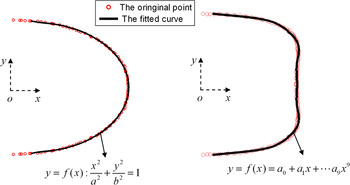
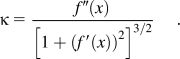
In this study, we define the stress state as 2D when the crack front is more or less straight and as 3D stress when the crack front is curved. Therefore, the changes of crack front from straight side to curved side indicate the changes of stress state from 2D to 3D. To quantitatively investigate this transition of stress states, the curvatures of the crack front profiles are calculated with the following approaches. First, all the points along the front of the delamination crack and the corresponding coordinates are exported from the FEM simulation or experimental results, and then the commercial software (Matlab 7.0) is used to fit the delamination crack front with a function, f(x). For the purpose of low error, two kinds of fitting function are utilized as shown in Fig. 9: (i) a ninth-order polynomial function y = f (x) = a 0 + a 1x +…a 9x Reference Marshall and Evans9 for the relatively straight crack front and (ii) an elliptical function 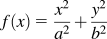 for the curved crack front. The curvature of interfacial crack front, κ, can then be determined using:
Schematic diagram showing the curve fitting for the crack front profiles. (color online)

Based on Eq. (13), the lower curvature indicates that the crack front is more close to the straight-sided shape with curvature of 0, i.e., the 2D plane strain solution and the higher curvature approaches the curved shape or is dominated by 3D stress state.
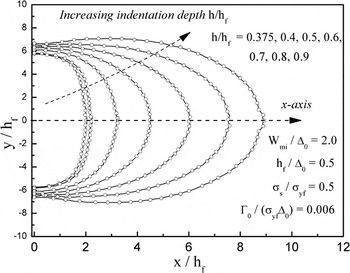
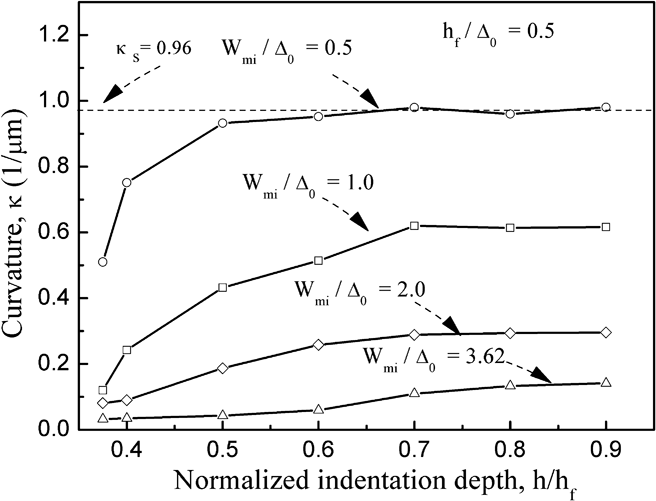
It is worth to mention here that the crack front is relatively straight at the initial stage of crack growth as plotted in Fig. 10, indicating that the state of crack growth is predominantly in the 2D plane strain condition at the beginning of the delamination, whereas the straight front becomes curved with further indentation and crack growth, indicating the 3D stress state. Figure 11 shows the variations of the crack front curvature, κ, versus the normalized indentation depth, h / h f, at different indenter lengths W mi / Δ0 = 0.5, 1.0, 2.0, and 3.62. It can be observed that for all the indenter lengths used, as the indentation depth increases, the curvature, κ, increases significantly at the initial stage of delamination. When κ reaches a certain value κ s, it becomes nearly unchanged and stable. For example, at W mi / Δ0 = 0.5, when the curvature, κ, reaches the value of 0.96 at h/h f ∼ 0.65, little change is observed by further increasing the indentation depth, i.e., κ s = 0.96 (Fig. 11). These observations are consistent with the findings of Hutchinson and Suo,Reference Hutchinson, Suo, Hutchinson and Wu31 i.e., steady-state conditions are reached when the dimensions of interfacial crack significantly exceed the thickness of film.
The crack front contours at different normalized indentation depths, h / h f.

The curvature of crack front versus normalized indentation depth at different lengths of the wedge indenter tips.

Furthermore, effects of indenter lengths are investigated, and the results on crack front curvature are shown in Fig. 11. It is obvious that with the increase in indenter lengths, the crack front curvature markedly decreases, especially for the case with W mi / Δ0 = 3.62, the curvature is lower than 0.1. However, the curvature is ∼0.96 for the case of W mi / Δ0 = 0.5. The curvatures of crack front at the fixed indenter length have also been compared by varying the thin film thickness from h f / Δ0 = 0.1, 0.3, and 0.5 to 1.0, and the results are shown in Fig. 12. On the contrary, by increasing film thickness, the crack front curvature is significantly increased. Thus, it can be concluded that increasing indenter length and increasing film thickness lead to the opposite effects on the crack front curvatures or changes of the stress states, as discussed in “Effects of indenter length and film thickness.”
The curvature of crack front versus normalized indentation depth for the thin films with different film thicknesses.

2. A guideline of stress state for extracting interfacial adhesion properties
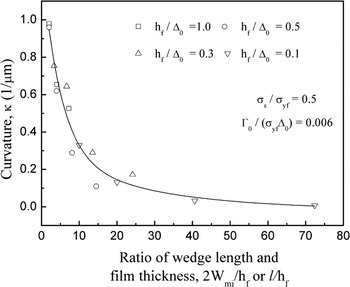
To combine the effects of the indenter length and the film thickness, more cases with different indenter lengths and film thicknesses are simulated, and the variations of the crack front curvature, κ, with the ratio of two times of wedge indenter length to film thickness, 2W mi / h f, are shown in Fig. 13 (the wedge indenter length in experiment is two times of that in computational model, i.e., l = 2W mi, thus 2W mi / h f or l / h f is used here for the comparison in “Comparison between computations and experiments”). On the basis of the above analysis, the crack front curvatures after delamination becomes stable, and the value of κ s is calculated and compared. For convenience, κ s, however, is still denoted as κ in Fig. 13, and it is clear that the crack front curvature is found to decrease exponentially as the ratio of wedge indenter length to film thickness increases.
The curvature of crack front versus ratio of wedge tip length to film thickness.

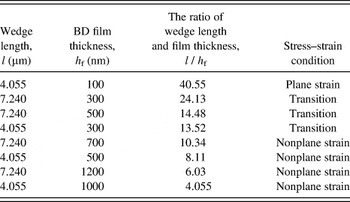
The curvatures of crack front in experiments are also computed by Eq. (13) and listed in Table II. For this purpose, the FESEM plane view image of a wedge indentation impression is first plotted in a transparent grid paper, and the center of the wedge indentation impression is then defined as the origin of the coordination. In this way, the coordinates of the crack front points (more than 30 points for one crack front) can be obtained.
The interfacial crack front’s stress–strain conditions of BD/Si systems in the experiments.

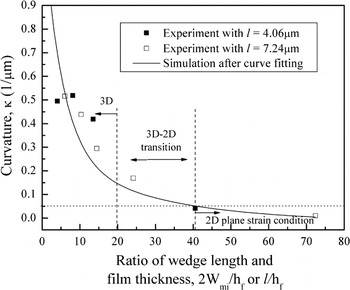
The measured curvatures are also compared with the computational values to further confirm that the FEM simulation can accurately determine the stress state during interfacial delamination. Similar to the simulation, the measured curvature, κ, is also plotted as the function of the ratio of indenter length to film thickness l / h f as shown in Fig. 14. It is found that both the measured and simulated curvatures are comparable and approximately the same in magnitude if l / h f > 7. However, some differences exist if l / h f < 7. These differences may be due to the discrepancy of computational and experimental crack front profiles for the delaminated region near the end of the indentation impression, as discussed in “Comparison between computations and experiments.” Another possible reason for this difference is that the coordinates of the points at crack front are obtained manually based on the grid paper. This operation may introduce some errors in the positions of crack front points and thus lead to the errors in the determination of the curvature.
Comparison of curvature of crack fronts from the experiments and simulations versus ratio of wedge indenter length and film thickness.

It is well known that when a curvature is lower than 0.05, the curve can be considered as a straight line.Reference Kobayashi32 Based on the qualitative comparison of the experimental observations and the FEM simulation (Fig. 14), it can be deduced that: (i) if l / h f > 40, the interfacial crack front is under plane strain condition; (ii) if 40 > l / h f > 20, the interfacial crack front is under the transition from plane strain to nonplane strain condition; and (iii) for 1 / h f < 20, the interfacial crack front is under nonplane strain condition. It is, therefore, noted that if the 2D simulation is used to extract the interfacial adhesion properties of thin film–substrate systems under wedge indentation,Reference Chen, Yeap, Zeng and Liu20, Reference Li and Siegmund21 the geometries of wedge indenter and film–substrate systems should fulfill the ratio of 1 / h f > 40 to achieve the 2D stress state in the wedge indentation experiments.
V. CONCLUSIONS
In this article, the wedge indentation-induced interfacial delamination in an SFHS system is systematically investigated using both 2D and 3D FEM simulations, and the results of the simulation and experiment are compared. In the simulation, a traction–separation law is used to describe the interface failure behavior. The effects of the wedge indenter length and the film thickness on the onset and growth of interface delamination are analyzed. Parametric studies for curvatures of crack fronts show that a 2D to 3D transition of stress states occurs depending on the ratio of indenter length to film thickness. On the other hand, the interfacial delamination process by wedge indentation is also conducted experimentally for different indenter lengths and film thicknesses, and the curvatures of delamination crack front are measured to compare with the computationally derived transition of stress states. The results from simulations show good agreement with those obtained in the indentation experiments. Based on the qualitative comparison of the experimental observations and computations, it is found that the ratio of wedge length to film thickness should be larger than 40 (l/h f> 40) to achieve 2D plane strain condition, and a guideline is proposed to classify the 2D to 3D transition for extracting the interface adhesion properties.
This work proposes a criterion based on the curvature of the delamination crack front, and the stress states are evaluated by the shapes of the interfacial crack. It is expected that this method can be used to solve the delamination problems in a wider range of thin film systems, e.g., hard, stiff films on soft, compliant substrates. A recent work has showed that the substrate deformation could play a more significant role during the interfacial delamination process for a hard-film-on-soft-substrate system (RuO2 film on Si substrate)Reference Zhu, Yeap, Zeng and Lu33; in addition, the substrate cracking may occur if the indentation load is high. Therefore, the proposed approach may need to be modified further to consider the effect of substrate deformation or cracking, when applied to hard-film-soft-substrate systems, which will be studied and presented in a forthcoming contribution.
ACKNOWLEDGMENTS
This work is supported by National University of Singapore under Academic Research Funds (R265-000-190-112 and R265-000-190-133) and National Natural Science Foundation of China (No. 50805079).