I. INTRODUCTION
The divalent alkaline-earth metal hexaborides MB6 (M = Ca, Sr, Ba) crystallize in a CsCl-type structure with the cubic symmetry Pm3m.Reference Adams1 The B6 boron octahedra are at eight corners of a cube, whereas the metal atom is at the cubic body center.Reference Adams1 The B6 boron octahedra link to each other by B–B bonds to form a rigid three-dimensional boron framework.Reference Adams1 As a result, MB6 materials have properties of low densities, low thermal expansion coefficients, high hardness, high melting points, and good chemical stability.Reference Adams1 They are also promising n-type high-temperature thermoelectric materials because of their rising Seebeck coefficients (absolute value) and electrical conductivities as temperature increases.Reference Imai, Mukaida, Ueda and Watanabe2, Reference Takeda, Terui, Takahashi and Ueda3 Recent advances have shown that low-dimensional materials such as quantum dots, one-dimensional (1D) nanostructures, and thin films provide new opportunities to achieve enhanced thermoelectric figure-of-merit.Reference Dresselhaus, Dresselhaus, Sun, Zhang, Cronin and Koga4, Reference Dresselhaus, Chen, Tang, Yang, Lee, Wang, Ren, Fleurial and Gogna5 Our latest synthesis of single-crystalline MB6 1D nanostructures has made the exploration of their thermoelectric performance possible.Reference Xu, Zheng, Nicholls, Stankovich, Piner and Ruoff6, Reference Amin, Li, Roth and Xu7 In addition to the study of thermoelectric properties, understanding the mechanical behavior of these MB6 1D nanostructures is essential before they can be integrated into new devices. However, there have been no reports on mechanical properties of MB6 1D nanostructures. Even for bulk MB6 materials, only scarce data can be found.Reference Grechnev, Baranovskiy, Fil, Ignatova, Kolobov, Logosha, Shitsevalova, Filippov and Eriksson8–Reference Dutta13
Nanoindentation is capable of giving insights to both Young’s modulus and hardness of bulk elastic–plastic materials based on the Oliver–Pharr method.Reference Oliver and Pharr14 The assumptions behind this method are that the material being tested is a homogeneous half-space. Cares must be taken to extract properties of tested materials when those assumptions are broken down, such as in cases when an indentation is close to a free edge and/or a tested system is inhomogeneous.Reference Jakes, Frihart, Beecher, Moon, Resto, Melgarejo, Suarez, Baumgart, Elmustafa and Stone15–Reference Chen and Vlassak20 For example, Jakes et al.Reference Jakes, Frihart, Beecher, Moon, Resto, Melgarejo, Suarez, Baumgart, Elmustafa and Stone15 demonstrated that artifacts, due to an indentation near a free edge, could obscure the real trend of orientation dependent materials properties. A SYS (Stone, Yoder, Sproul) correlation capable of removing the artifacts was proposed. Chen et al. used a finite element method to study the effect of substrate on measurements of mechanical properties of thin films. A substrate effect factor was defined. In addition, hardness and stiffness maps were constructed, serving as a guideline in the interpretation of indentation results for thin films with extremely thin thickness (e.g., under 50 nm).Reference Chen and Vlassak20
Recently nanoindentation has been extended to study mechanical properties of 1D nanostructures.Reference Mao, Zhao and Wang21–Reference Yang, Jiang, Du, Zhang, Li and Mao24 The Young’s moduli of as-tested nanostructures were usually obtained by the Oliver–Pharr method. However, during nanoindentation, individual nanostructures were laid on a substrate such as silicon. This experimental configuration obviously does not satisfy the aforementioned assumptions, indicating the Oliver–Pharr method cannot be directly used to extract the intrinsic properties of nanostructures. Since a nanoindenter senses the response of both the nanostructure and the substrate as a system, the measured modulus given by the software associated with the nanoindenter (which is primarily programmed based on the Oliver–Pharr method) is therefore an effective system modulus instead of the intrinsic nanostructure modulus.Reference Shu, Yang, Fu, Wen and Lu18 Our previous work on nanoindentation of TiO2 nanoribbons has shown that a suitable substrate is one of the keys to obtain reliable mechanical properties of 1D nanostructures.Reference Wu, Amin and Xu19 The measured system modulus could be close to the intrinsic nanostructure modulus only if a suitable substrate is selected. A general rule, based on comparison between the measured modulus and the Young’s modulus of the substrate, was proposed for selection of a proper substrate. In addition, an inverse data analysis method, based on numerical modeling, was outlined to correct the measured modulus and extract the intrinsic modulus of a nanostructure. Our work clearly demonstrated the need of both experimental and numerical investigations when studying the mechanical properties of 1D nanostructures by nanoindentation.
Applying the knowledge learned from our previous work, nanoindentation is used to study the mechanical properties of MB6 1D nanostructures in the present project. Three new challenges exist. (i) Smaller width-to-thickness ratio of a nanostructure with a rectangular cross section. Most MB6 1D nanostructures have rectangular cross sections whose width-to-thickness ratios are less than 2. This value is considerably smaller than that of TiO2 nanoribbons, which is about five. Our previously proposed rule for selection of a proper substrateReference Wu, Amin and Xu19 might be invalid for nanostructures with small width-to-thickness ratios. (ii) Various cross sections of nanostructures. The dominant cross sections of MB6 nanostructures are rectangular. However, a few CaB6 nanostructures have circular cross sections. Different experimental data interpretation and numerical modeling need to be developed for nanostructures with different cross sections. (iii) Uncertainty of the interaction between a MB6 1D nanostructure and a sapphire substrate. When performing nanoindentation on TiO2 nanoribbons, a clear lift-up phenomenon was found experimentally. This observed lift-up behavior and the follow-up numerical simulation result together showed that the interaction between individual TiO2 nanoribbons and a sapphire substrate could be better described by the receding contact mechanics.Reference Wu, Amin and Xu19 However, as revealed by our recent ultrasonication experiments, the adhesion between individual MB6 1D nanostructures and a sapphire substrate seems to be stronger than that between TiO2 nanoribbons and sapphire (see details in Section II). Thus, is the receding contact mechanics still the best mechanics to describe the interaction between individual MB6 1D nanostructures and sapphire? We believe that similar to a thin film-on-substrate system,Reference Yu, Sanday and Rath25 the interaction between a nanostructure and a substrate can be divided into two extreme categories. One is the receding contact, representing no adhesion and less friction between a nanostructure and a substrate. The other is the perfect bond, representing strong adhesion and friction between a nanostructure and a substrate. In reality, the interaction could be neither receding contact nor perfect bond, but something in between. Numerical simulation is able to correlate the experimentally measured modulus to the intrinsic nanostructure modulus. More specifically, the inverse data analysis method can be used to correct the measured modulus for each interaction mechanism. The perfect bond interaction leads to a corrected modulus at the lower bound, whereas the frictionless receding contact yields a modulus at the upper bound. The intrinsic Young’s modulus of a nanostructure falls between the two bounds.
In this work, mechanical properties of MB6 1D nanostructures were studied using nanoindentation. The measured moduli were quite scattering. Both experimental observation and numerical simulation demonstrate that the data scattering was due to several factors such as the width-to-thickness ratio of a nanostructure, the interaction between a nanostructure and a substrate, and the cross section of a nanostructure. A smaller width-to-thickness ratio, a frictionless receding interaction, and a circular cross section could all lead to a lower measured modulus. To find out the intrinsic Young’s modulus of a nanostructure, the inverse data analysis method was used to correct the experimentally measured modulus. The extracted intrinsic modulus of CaB6, SrB6 and BaB6 1D nanostructures fell within ranges of 175–365, 300–425, and 270–475 GPa, respectively.
II. EXPERIMENTAL DETAILS
Single-crystalline MB6 1D nanostructures with the preferred growth direction along [001] were synthesized by pyrolysis of diborane over nickel-coated alkaline-earth metal oxide (MO) powders at elevated temperatures and low pressures.Reference Xu, Zheng, Nicholls, Stankovich, Piner and Ruoff6, Reference Amin, Li, Roth and Xu7 The as-synthesized MB6 nanostructures grew on top of MO powders, forming an urchin-like geometry. The nanostructures were transferred to two different substrates: silicon(100) and sapphire(0001) for nanoindentation. The width and length of each substrate were about 0.5 and 1 cm, respectively. Two transfer methods were used. (i) “Wet transfer” method. The nanostructures were scraped off from powders and dispersed uniformly into absolute alcohol by ultrasonication. A few drops of alcohol solution were deposited onto substrates, followed by blow drying with compressed nitrogen. (ii) “Dry transfer” method. Bare substrates were slid against powders for direct transferring of nanostructures. The substrates were then gently washed by stream alcohol and blow dried. Although it was confirmed later that the testing results were not affected by sample transfer methods, the “dry” one is preferred because it can transfer more nanostructures to a substrate. Optical microscopy (OM; Olympus BX51 research-level microscope, Tokyo, Japan; dark field) was used to locate individual MB6 nanostructures on substrates. The nanostructures were then studied by Atomic force microscopy (AFM; Dimension 3100, Veeco Instruments Inc., Plainview, NY) to examine their geometry and obtain dimensional information. To avoid the sliding problem during nanoindentation, nanostructures with rectangular cross sections are preferred.Reference Wu, Amin and Xu19 Experimental results presented in section IV.A are all obtained from nanostructures with well-defined rectangular cross sections. Both tested SrB6 and BaB6 nanostructures had a width of ∼100–200 nm. However, the average thickness of SrB6 nanostructures was ∼100 nm and that of BaB6 nanostructures was ∼160 nm. The CaB6 nanostructures were relatively small. Most of them had both thickness and width less than 100 nm. A few CaB6 nanostructures were found to have circular cross sections. Sliding phenomenon was observed for these CaB6 nanostructures whose corresponding experimental results were discarded without further analysis.
All nanoindentation tests were conducted in the continuous-stiffness-measurement mode of an Agilent Technology G200 nanoindenter (Santa Clara, CA), which is equipped with the NanoVision scanning force microscopy (SFM) option and the Dynamic Contact Module option. The indentation-loading scheme was similar to our previous experiments.Reference Wu, Amin and Xu19 For general measurements of modulus and hardness, the maximum indenter displacement was set to 15 nm for CaB6 nanostructures and 20 nm for SrB6 and BaB6 nanostructures. For fracture behavior studies, the maximum indenter displacement was set to 20 nm for CaB6 and 30 nm for SrB6 and BaB6. For each material, at least ten nanostructures on sapphire substrates were tested. For each nanostructure, multiple indentation tests were performed along its preferred growth direction. The residual indentations (∼1–2 nm in depth) were checked by the NanoVision SFM. Data analyses were only done on those nanostructures with well-centered residual indentations.
For comparison experiments on the adhesion behavior between nanostructures and underlying substrates, two kinds of samples were prepared. One was a sapphire substrate with TiO2 nanoribbons on top. The other was a sapphire substrate with MB6 1D nanostructures on it. The samples were put in absolute alcohol solution and subjected to ultrasonication for 1 min. The substrates were then taken out, blow dried, and examined under the Olympus BX-51 microscope. Ninety percent of TiO2 nanoribbons were lifted off during sonication, whereas majority of MB6 1D nanostructure stayed still. These results indicated that the adhesion between a TiO2 nanoribbon and sapphire is weaker than that between a MB6 nanostructure and sapphire.
III. MODELING OF NANOINDENTATION EXPERIMENTS
A. A better way to simulate the Berkovich indenter
For depth-sensing nanoindentation, with the help of an experimentally obtained indentation load–displacement (P–h) curve, the reduced elastic modulus E r of a tested material can be determined based on the Sneddon theoryReference Oliver and Pharr14
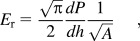
where P is the load applied on the indenter, h is the indenter displacement into the surface of a tested material, dP/dh is the slope of the P–h curve upon unloading, and A is the projected contact area between the indenter and the tested material. Given E r, the Young’s modulus for the tested material (E) can be obtained from the following equation with minor algebraic manipulation.
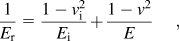
where ν is the Poisson’s ratio of the tested material, and E i and ν i are elastic properties of the indenter tip.
By observing the above two equations, the projected contact area A is obviously one important parameter which needs to be carefully analyzed. For example, an underestimation of A could lead to an overdetermination of E. Thus, when performing numerical simulation, the projected contact area needs to be properly modeled to assure its values are close to the experimental data.
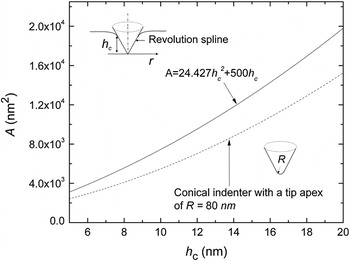
The solid line in Fig. 1 is a plot of A versus h c (contact depth) obtained from our tip geometry calibration experiment. The line can be mathematically represented by the following functional form

Projected contact area A versus contact depth h c curves. The solid line was obtained from a tip geometry calibration experiment of a Berkovich indenter. The dashed line was calculated assuming the intender is conical whose tip apex R is 80 nm.

where α 1 = 24.427 and α 2 = 500. In our previous numerical simulation,Reference Wu, Amin and Xu19 a conical indenter with a tip apex of R = α 2/2π was used to mimic the Berkovich indenter. The corresponding A–h c curve was calculated and presented as the dashed line in Fig. 1. The curve is obviously not overlapped with the experimental A–h c curve, indicating that the Berkovich indenter in our experiment should not be simply modeled as a conical one. Inspired by the work done by the Pharr’s group,Reference Bei, George, Hay and Pharr26 a rigid axially symmetric indenter of a revolution spline is used to simulate the Berkovich indenter. The inset in Fig. 1 illustrates the profile of the indenter, where r the contact radius is defined as  at any contact depth h c.
B. Finite element modeling
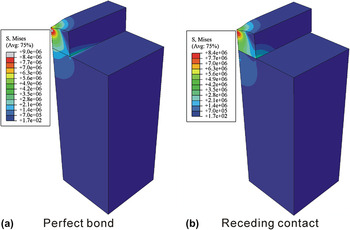
Three-dimensional finite element modeling (FEM) was carried out to simulate indenting nanostructure-on-substrate systems using the commercial software ABAQUS. Compared to our previous work,Reference Wu, Amin and Xu19 a couple of important modifications were used in the current one. (i) As discussed in Section III.A, the Berkovich indenter was modeled as a rigid axially symmetric indenter of a revolution spline to ensure the accurate representation of A. (ii) The dimension of nanostructures and sapphire substrates used to generate results in Section IV.B are listed in Table I. The thickness of a substrate was chosen to be at least seven times of that (or diameter) of a nanostructure so that the substrate finite boundary condition effect can be ignored. (iii) To compromise between the computational accuracy and cost, a coarse mesh with the minimum element size of 10 nm was chosen. This selection was based on a mesh sensitivity study. The maximum load applied on the indenter at the maximum indentation depth was compared between simulation using coarse (minimum element size: 10 nm) and fine meshes (minimum element size: 3.2 nm). The load difference was found to be 0.03%, indicating that the P–h curve is insensitive to a mesh size. (iv) Two types of interactions between a nanostructure and a substrate were simulated. One was a “tie” constraint to simulate the perfect bond interaction. The other was the frictionless receding contact. When simulating the perfect bond interaction, for a nanostructure with a rectangular cross section, all six degrees of freedom of nodes on the bottom surface of a nanostructure were constrained with those of nodes on the top surface of a substrate. For a circular nanowire, it initially contacted with the substrate on one line. The degrees of freedoms of nodes on the contact line were constrained with each other. Figure 2 shows typical deformation patterns and stress distribution of an indented nanostructure-on-substrate system under two different nanostructure–substrate interactions. The von Mises stress is continuous across the nanostructure–substrate interface for the perfect bond interaction, whereas the stress is discontinuous across the interface for the receding contact interaction. The figure clearly indicates that the system responses depend on nanostructure–substrate interactions. (v) The Young’s modulus of sapphire was set to be 500 GPa. The Poisson’s ratio was chosen to be 0.3 for both the nanostructure and the substrate. Varying Poisson’s ratios from 0.3 to 0, the simulation result (i.e., the maximum load applied on the indenter at the maximum depth) was changed less than 5%, indicating the P–h curve is insensitive to Poisson’s ratios.
Typical simulated deformation patterns and stress distribution of an indented nanostructure-on-substrate system under two different nanostructure–substrate interactions: (a) perfect bond and (b) receding contact. The nanostructure has a rectangular cross section (w = t = 100 nm). And the indentation depth is 20 nm.

Dimensions for nanostructures and sapphire substrates used in simulation.

IV. RESULTS AND DISCUSSION
A. Experimental results
Preliminary tests were done on both nanostructure-on-silicon and nanostructure-on-sapphire systems. Sliding phenomenon was observed when indenting individual nanostructures on silicon, producing unreliable testing results. Thus, sapphire was chosen as the proper substrate to support MB6 nanostructures for later nanoindentation.
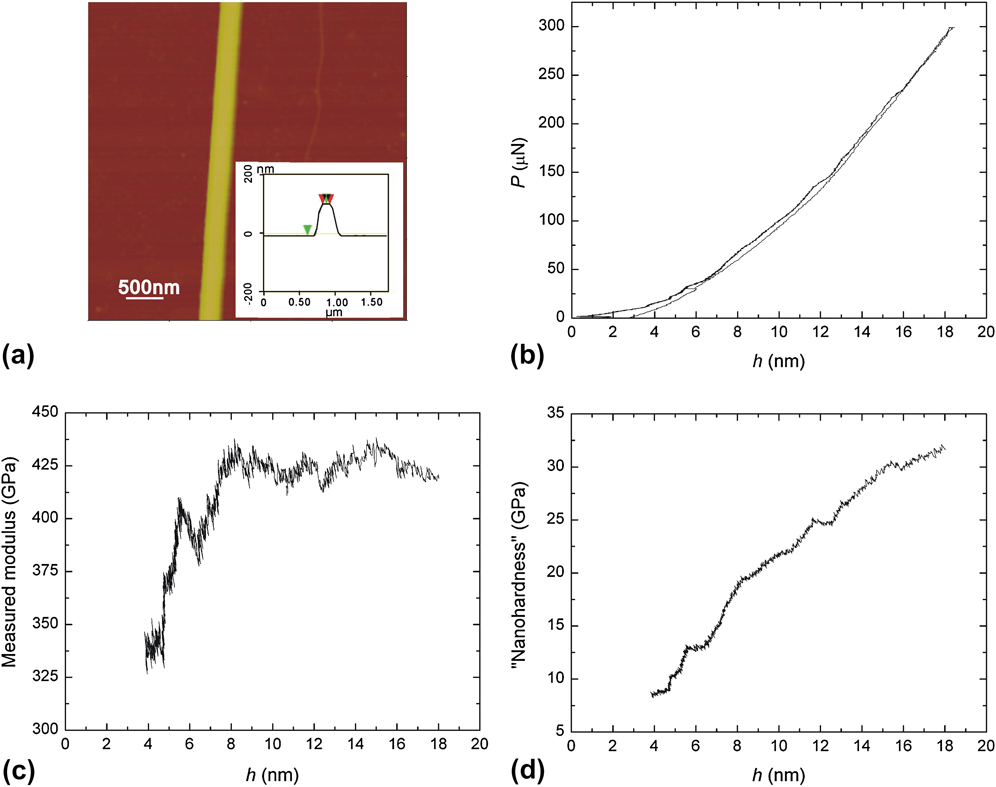
Since similar experimental phenomena were observed for nanoindentation on MB6 nanostructure-on-sapphire systems, only results for SrB6 nanostructures are qualitatively described here. Figure 3(a) is a representative AFM image, showing a part of a SrB6 nanostructure lying on sapphire. The inset presents the result of section analysis, revealing the nanostructure has a rectangular cross section and its thickness and width are ∼108 and 100 nm, respectively. Figure 3(b) is a typical P–h curve of nanoindentation on the SrB6 nanostructure-on-sapphire system. The elastic-like deformation behavior is observed. Figures 3(c) and 3(d) present the measured modulus and “nanohardness,” respectively. These data were automatically produced by the software associated with the nanoindenter, by which they were calculated based on the Oliver–Pharr method.Reference Oliver and Pharr14 The measured modulus seems to be constant when the indenter displacement is larger than 8 nm. The data variation at the initial stage could be due to the indenter tip rounding, surface roughness, and machine resolution.Reference Chen, Liu and Wang27 Generally, the “nanohardness” (H) is defined as the peak load (P max) applied during a nanoindentation test divided by the projected contact area (A) of the indentation.Reference Oliver and Pharr14 It can also be considered as the mean contact pressure (P m) for a material under an elastic deformation. Depending on the geometry of an indenter tip, various expressions of “nanohardness” with respect to the indenter displacement for an elastic deformation can be derived based on contact mechanics.Reference Maugis28 For a spherical indenter, the “nanohardness” is proportional to the square root of the indenter displacement (i.e.,  ). For a conical indenter, the “nanohardness” is independent of the indenter displacement. For a flat punch, the “nanohardness” is directly proportional to the indenter displacement (i.e., H ∝ h). Carefully analyzing Fig. 3(d), one can find that the “nanohardness” increases with the indenter displacement in an asymptotic manner (i.e., H ∼ h α, 0.5 < α < 1), indicating that the geometry of the indenter tip in our experiments is neither spherical nor conical nor flat. This observation is consistent with the result obtained by analyzing the projected contact area A, as discussed in Section III.A.
(a) An atomic force microscopy (AFM) image of a part of a SrB6 nanowire on sapphire. The inset is the result of section analysis, revealing the nanostructure has a rectangular cross section. Its thickness and width is about 108 nm (vertical distance between two green arrows) and 100 nm (horizontal distance between two red arrows), respectively. (b) A typical load–indenter displacement (P–h) curve of the SrB6 nanostructure-on-sapphire system. (c) Measured modulus and (d) “nanohardness” given automatically by the software associated with the nanoindenter. The values were calculated using the Oliver–Pharr method. Note: the noisy data points within the initial contact range (i.e., between 0 and 4 nm) were removed for clarity.
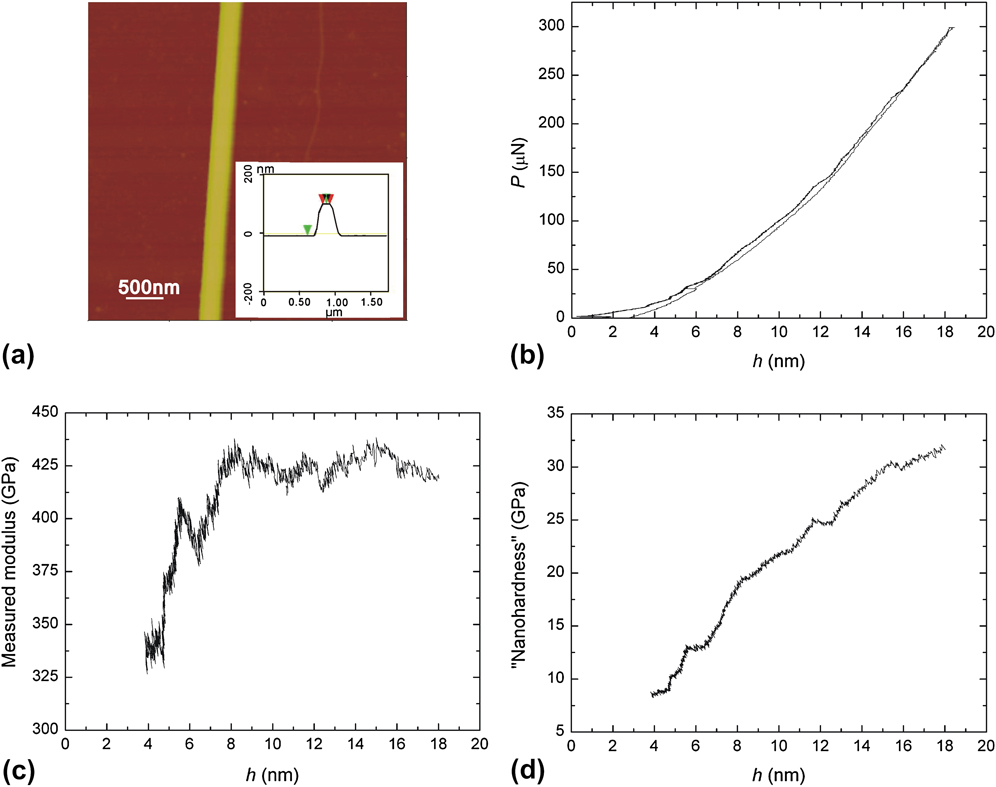
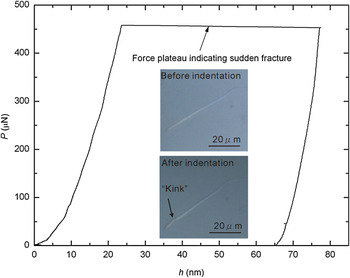
Figure 4 shows a P–h curve of a SrB6 nanostructure fractured during an indentation process with an original maximum indenter displacement setting as 30 nm. When the indenter displacement reached 23 nm, the nanostructure suddenly fractured and the software lost its control of the indenter until the indenter touched the sapphire substrate. Then the software “realized” that the indenter displacement was larger than the target displacement and started to unload. Cracks might initiate when the indenter displacement was close to 23 nm, followed by a quick propagation and catastrophic fracture of the nanostructure. For total nine MB6 nanowires subjected to fracture behavior studies, similar P–h curves as shown in Fig. 4 were observed. SrB6 and BaB6 nanostructures typically fractured when the indenter displacement was around 25 nm, whereas CaB6 nanostructures broke when the indenter displacement was around 19 nm. The above indenter displacement at fracture is typically less than 30% of the thickness of a nanostructure. Each nanostructure broke into two parts, which was confirmed by the follow-up OM or AFM examination. This observed catastrophic fracture is different from other indentation-induced failure behavior reported for SnO2 nanobeltsReference Mao, Zhao and Wang21 and ZnS nanobeltsReference Li, Wang, Xiong and Eklund22, Reference Yang, Jiang, Du, Zhang, Li and Mao24 from which only crack initiation at the edges of the residual indentation or limited amount of crack propagation was found even the indentation displacement is about 40% of the thickness of the nanostructure. This study of fracture processes demonstrates the brittle nature of as-synthesized MB6 1D nanostructures.
A P–h curve of a SrB6 nanostructure experiencing sudden fracture during an indentation process.

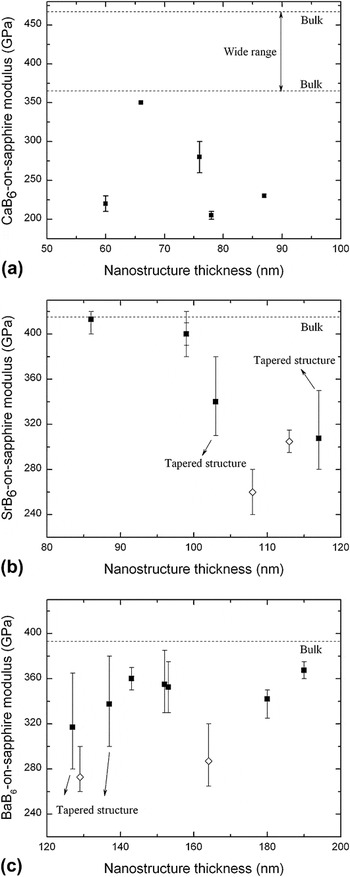
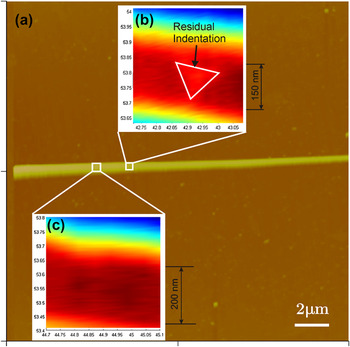
As mentioned in Section II, multiple indentation tests were performed along the preferred growth direction of each tested 1D nanostructure. Most of the time, two to four tests would be found valid (i.e., a test produces a well-centered residual indentation), generating useful experimental data. As shown in Fig. 5, for most of tested nanostructures, the measured moduli are presented as a symbol against a vertical line. The symbol represents the mean value, whereas the ends of the vertical line (terminated by horizontal bars) indicate the minimum and maximum values. Analyzing experimental results presented in Fig. 5, three important issues can be identified. (i) The measured moduli for MB6 nanostructure-on-sapphire systems are scattering and generally lower than the Young’s moduli of MB6 bulk materials (see dashed lines in Fig. 5 and detailed data in Table II). (ii) Special attention was paid to those data points [see SrB6 at 103 and 117 nm thickness in Fig. 5(b) and BaB6 at 127 and 137 nm thickness in Fig. 5(c)] associated with longer vertical lines (i.e., have larger difference between the maximum and minimum values). It was found that these data were obtained from tapered nanostructures. Figure 6(a) is an AFM image of a typical tapered SrB6 nanostructure. Two areas subjected to nanoindentation tests are outlined by white squares. The two areas are 2 μm apart. They are further enlarged in Figs. 6(b) and 6(c), which were images produced by NanoVision SFM. Each image represents a 0.4 × 0.4 μm2 area, showing a part of the tested nanostructure. The black portion corresponds to the flat top of the nanostructure, from which the width of the nanowire can be estimated. The width of the part of the nanostructure shown in Fig. 6(b) is about 150 nm, while that in Fig. 6(c) is about 200 nm. The corresponding measured modulus in these two areas is (b) 340 GPa and (c) 380 GPa, respectively. This result indicates that the measured modulus is sensitive to the width of a nanostructure. (iii) Further examination of those data (−◊−) with lower measured moduli shown in Figs. 5(b) and 5(c) revealed that the associated tested nanostructures were ∼25–50% narrower than other tested nanostructures. For example, in Fig. 5(b), the nanostructure of 108 nm in thickness was only 100 nm in width, and the nanostructure of 113 nm in thickness was about 150 nm in width. Other tested SrB6 nanostructures were about 200 nm in width. This result again demonstrated that the measured modulus of a nanostructure-on-substrate system is sensitive to the width of the nanostructure. The narrower the nanostructure is, the lower the measured modulus can be.
Measured moduli of (a) the CaB6 nanostructure-on-sapphire system, (b) the SrB6 nanostructure-on-sapphire system, and (c) the BaB6 nanostructure-on-sapphire system.

(a) AFM image of a tapered SrB6 nanostructure-on-sapphire. (b) Zoom-in scanning force microscopy (SFM) image of an indented section of the nanostructure. The white triangle frame outlines the residual indentation. (c) Zoom-in SFM image of a section before indentation. The width of the two sections is obviously different.

Experimental and theoretical values of elastic constants of some hexaborides.

B=(C 11 + 2C 12)/3 is the bulk modulus.
a Theoretical data at 0 K.Reference Wei, Yu, Li, Cheng and Ji12
b Experimental and theoretical data at 78 K.Reference Grechnev, Baranovskiy, Fil, Ignatova, Kolobov, Logosha, Shitsevalova, Filippov and Eriksson8
c Theoretical data at 298 K.Reference Shang, Wang and Liu9
d Calculated or experimental (hot-pressed) data.Reference Kosolapova10
e Experimental (hot-pressed) data.Reference Dutta13
f Single-crystal nanostructure.Reference Zhang, Tang, Zhang, An and Qin11
B. Numerical simulation
The aforementioned experimental results unambiguously demonstrate that the scattering of measured moduli could be due to several factors such as the width-to-thickness ratio of a nanostructure with a rectangular cross section. To further study the effects of these factors, FEM-based simulation of nanoindentation on nanostructure-on-substrate systems was carried out. The dimensions listed in Table I were used for simulation. Due to the similarity of simulation results obtained from three MB6 nanomaterials, data presented here is typical for SrB6 unless noted otherwise.
1. Effect of the width of a nanostructure with a rectangular cross section
Figure 7(a) shows the simulated P–h curves of nanostructures with different widths. The legend “w = 100 400 on 500 perfect bond” represents a nanostructure with a half-width w of 100 nm and a Young’s modulus of 400 GPa is perfectly bonded to a sapphire substrate with a Young’s modulus of 500 GPa. “400 half space” denotes a homogeneous half space with a modulus of 400 GPa. The P–h curve of “w = 100 400 on 500 perfect bond” is steeper than that of “400 half space” (note: comparison was done on the slope dP/dh upon unloading of each curve), indicating that the measured modulus of this nanostructure-on-sapphire system would be higher than the intrinsic nanostructure modulus: 400 GPa. When the half-width of the nanostructure is reduced to 50 nm, the corresponding P–h curve of “w = 50 400 on 500 perfect bond” is now less steep than that of “400 half space,” implying the measured modulus will be lower than 400 GPa. These simulation results are consistent with aforementioned experimental findings. They clearly demonstrate that the measured modulus is not the intrinsic nanostructure modulus and can be affected by the width of a nanostructure. The measured modulus decreases as the width of a nanostructure decreases. This conclusion is also valid when the interaction between a nanostructure and a substrate becomes frictionless receding contact.
Simulated P–h curves for studying of various factors affecting measured moduli. These factors include (a) the width of a nanostructure with a rectangular cross section, (b) the interaction between a nanostructure and a substrate, (c) the cross section of a nanostructure, (d) the diameter of a nanostructure with a circular cross section, and (e) the oxide layer on a nanostructure.

The width effect is qualitatively illustrated in the inset of Fig. 7(a). Considering a nanostructure with an infinite width and finite thickness t laid on a substrate, the interaction radius between the nanostructure and the substrate is a 2 for an indentation of a certain indentation depth-to-nanostructure thickness (h/t) ratio. When the width of the nanostructure becomes finite, two situations exist. (i) The half-width w of the nanostructure is larger than a2. Indentation on this type of nanostructures is same as indentation on infinite wide nanostructures. In other words, no width effect exists. (ii) The half-width of the nanostructure is smaller than a 2. Indentation on these narrower nanostructures deviates from that on infinite wide nanostructures. The deviation increases as the half-width of the nanostructure decreases. Detailed studies of the width effect have been carried out and the results will be published elsewhere. It has been found that analytical solutions can be used to study nanoindentation of wider nanostructures, whereas FEM-based modeling is needed for narrower nanostructures.
2. Effect of the interaction between a nanostructure and a substrate
As shown in Fig. 7(b), the P–h curve of “w = 100 400 on 500 perfect bond” is steeper than that of “w = 100 400 on 500 receding.” This result indicates a perfect bond interaction between a nanostructure and a substrate could lead to a higher measured modulus. Based on the inverse data analysis method introduced in our previous report,Reference Wu, Amin and Xu19 it can also be derived that a perfect bond interaction could lead to a corrected modulus at the lower bound.
3. Effect of the cross section of a nanostructure
As mentioned in Section II, a few CaB6 nanostructures were found to have circular cross sections. Although nanoindentation of these circular nanostructures did not produce reliable testing results due to the sliding problem, it is natural to ask ourselves a question: “Is there any effect of cross section on measured moduli if no sliding happens?” Simulation was done on nanostructures with two different cross sections: square and circular. The square has an edge length of 80 nm, whereas the circle has a diameter of 80 nm. Receding contact interaction was considered between the nanostructure (assumed modulus: 300 GPa) and the substrate (assumed modulus: 500 GPa). As shown in Fig. 7(c), the simulated P–h curve for a nanostructure with a circular cross section is less steep than that with a square cross section, and also the “300 half space” curve. In other words, a circular cross section could result in a lower measured system modulus. This result is qualitatively consistent with the work done by Shu et al.,Reference Shu, Yang, Fu, Wen and Lu18 in which they concluded that for a nanostructure with a circular cross section, the measured moduli could be 50% lower than the intrinsic modulus of the nanostructure.
4. Effect of the diameter of a nanostructure with a circular cross section
How does the diameter (D) of a nanostructure affect measured moduli? Does a smaller diameter always result in a lower measured modulus? Our simulation results revealed that the diameter effect is tangled with the substrate effect. A smaller diameter indicates a smaller contact width (i.e., the short axis of the contact ellipse) between a nanostructure and a substrate, which shall result in a lower measured modulus. However, a smaller diameter also means that the nanostructure is shallow and the measured modulus is prone to be affected by the underlying substrate. Several P–h curves of nanoindenting nanostructures of different diameters are shown in Fig. 7(d). The assumed modulus of the nanostructure is 400 GPa, whereas that of the substrate is 500 GPa. The P–h curve of a nanostructure with a diameter of 60 nm is less steep than that of 80 nm, implying the measured modulus decreases as diameter decreases. However, when the diameter is further decreased to 30 nm, the corresponding P–h curve becomes steeper, indicating that a higher measured modulus would be obtained. The inset in Fig. 7(d) shows the load at the maximum indentation depth: 15 nm for three different diameters, from which no linear relation between P and D can be found. These results demonstrate that the reduction of diameter does not always lead to a lower measured modulus. When the diameter is smaller than a certain value, the substrate effect could show up, resulting in a higher measured modulus.
5. Effect of the oxide layer surrounding a nanostructure
Each as-synthesized nanostructure has a core-sheath geometry.Reference Xu, Zheng, Nicholls, Stankovich, Piner and Ruoff6, Reference Amin, Li, Roth and Xu7 The core is crystalline MB6. The sheath is amorphous oxide whose thickness can be up to 4 nm. Will this oxide layer affect the P–h curve of nanoindentation on a nanostructure-on-substrate system when the maximum indentation depth is 20 nm? To answer this question, simulation was conducted on a sandwich nanostructure consisting of a thick core with two thin oxide surface layers. The thickness of the core and each oxide layer is 92 and 4 nm, respectively. The moduli of the core and oxide layer are assumed to be 400 and 150 GPa, respectively. Simulation was also done on a “pure nanostructure” whose thickness is 100 nm and modulus is 400 GPa. The half-width of both nanostructures is 100 nm. Both perfect bond and receding contact were considered, and similar results were obtained. As revealed in Fig. 7(e), the difference between the slope dP/dh upon unloading for the simulated P–h curves of a “pure nanostructure” and a “sandwich nanostructure” is less than 3%. In other words, the oxide layer has minor effects on nanoindentation tests. This is due to the factor that the effective flexural rigidity of a sandwich nanostructure is close to that of a pure material.Reference Chen, Shi, Zhang, Zhu and Yan29
C. Data analysis
The aforementioned experimental results and numerical simulation have clearly revealed that the measured modulus generally cannot represent the intrinsic Young’s modulus of a nanostructure. In addition, the measured modulus can be easily affected by several factors. A narrower nanostructure, a frictionless receding contact and a circular cross section can all generally result in a lower measured modulus. To obtain a reliable value of Young’s modulus of a nanostructure, the measured modulus needs to be corrected. As discussed in the introduction, different approaches have been and/or are being developed to correct the measured modulus for the cases in which assumptions of the Oliver–Pharr method are not fully satisfied.Reference Jakes, Frihart, Beecher, Moon, Resto, Melgarejo, Suarez, Baumgart, Elmustafa and Stone15–Reference Chen and Vlassak20 In this study, the FEM-based inverse data analysis method proposed in our previous reportReference Wu, Amin and Xu19 is used to correct the measured modulus.
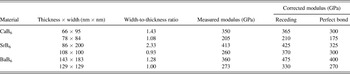
As outlined in the introduction, correction needs to be done for both the perfect bond and the receding contact interactions. The perfect bond interaction leads to a corrected modulus at the lower bound, whereas the receding contact interaction yields a modulus at the upper bound. The intrinsic modulus shall fall between the two bounds. For MB6 nanostructures, it is possible that the intrinsic modulus is more toward the lower bound since the ultrasonication tests revealed relatively strong adhesion between the nanostructures and the substrate. Table III shows the data analysis results for a couple of tested MB6 1D nanostructures. For each material, data correction was done on two nanostructures. The two nanostructures were selected because their width-to-thickness ratio and measured modulus are the maximum and minimum among all tested nanostructures. As shown in Table III, it seems that the intrinsic modulus of MB6 nanostructures is dependent on the width-to-thickness ratio. The larger the width-to-thickness ratio is, the higher the intrinsic modulus can be. There have been some recent studies of ZnO nanobelts on whether the elastic modulus is dependent on the width-to-thickness ratio.Reference Ni and Li30–Reference Zheng, Zheng, Wang, Yu, Li, Song and Han34 The reported results were somewhat contradictory. For example, Ni et al.Reference Ni and Li30 showed the independence of elastic modulus as the width-to-thickness ratio increases from 2.3 to 8.8. Lucas et al.Reference Lucas, Mai, Yang, Wang and Riedo31 reported the decreasing of elastic modulus as the width-to-thickness ratio increases from 1.2 to 10.3. Bai et al.Reference Bai, Gao, Wang and Wang32 and Mai et al.Reference Mai and Wang33 showed the increasing of elastic modulus as the width-to-thickness ratio increases from 1.1 to 1.7, and from 1.1 to 1.3, respectively. For MB6 nanostructures studied in this work with the width-to-thickness ratio varying between about 1 and 2, the elastic modulus increases as the ratio increases. This observation is consistent with Bai and Mai’s results.
Measured nanostructure-on-substrate system moduli and corrected nanostructure moduli for two different nanostructure–substrate contact interactions.

Mechanical properties of single crystals are commonly anisotropic. Therefore, it is important to correlate the measured properties with crystallographic information. The surfaces of as-synthesized MB6 1D nanostructures are {100} planes.Reference Zhang, Tang, Zhang, An and Qin11, Reference Futamoto, Aita and Kawabe35, Reference Xin, Liu, Wang, Han, Wang, Xu, Tian, Liu, He and Yu36 In other words, the nanoindentation loading direction is perpendicular to {100} planes. MB6 materials have a cubic symmetry, indicating only three elastic constants are needed to estimate the crystallographic direction-dependent Young’s moduli. Unfortunately, rare experimental and theoretical data about the elastic constants of MB6 can be found after extensive literature search (Table II). The unavailability of reliable information on elastic constants prevented us to estimate effective modulus for indenting against MB6 nanostructures, study their anisotropic ratio, and make detailed comparison between experimental data and theoretical values.
V. CONCLUSIONS
In summary, Young’s moduli of alkaline-earth metal hexaboride single-crystalline 1D nanostructures were studied by nanoindentation. The indentation direction is perpendicular to {100} planes of nanostructures. The experimentally measured moduli were scattering. Systematic experimental investigation and numerical simulation revealed that the data scattering can be caused by several factors such as the width of a nanostructure with a rectangular cross section and the interaction between a nanostructure and a substrate. A narrower nanostructure, a frictionless receding interaction, a circular cross section can all lead to a lower measured modulus. To obtain a reliable intrinsic modulus of a nanostructure, a FEM-based inverse data analysis method was used in this work. The modulus extracted based on the receding contact and the perfect bond interaction gives upper and lower bound values of the intrinsic modulus of the nanostructure, respectively. The extracted intrinsic modulus seems to be dependent on the width-to-thickness ratio of a nanostructure. The larger the ratio is, the higher the intrinsic modulus can be.
It is worth of noting that the current work could be further extended. For example, (i) the current FEM simulation is based on an elastic model for studying the Young’s modulus of nanostructures. To reliably extract the intrinsic hardness of nanostructures, numerical simulation including plastic deformation for both nanostructure and substrate is essential. (ii) Different indentation tips such as a cube corner tip can be explored in future experiments. A cube corner tip having a smaller equivalent conical half angle might be able to reduce the substrate effect and lead to more reliable experimental results, as indicated by some recent publications.Reference Kim, Son, Choi, Choi, Park and Jang37, Reference Nagao, Fujikane, Tymiak and Nowak38 (iii) To better understand the dependence of elastic modulus on the width-to-thickness ratio, more simulation works can be done, especially for the ratio in the range between 0 and 2. Nevertheless, the present work is a good example, demonstrating the need of careful postanalysis to understand the experimental results of nanoindentation of 1D nanostructures. The applicability of the Oliver-Pharr method to obtain the intrinsic modulus of a nanostructure should be cautiously evaluated. In addition, we hope that more research work can be done on MB6 materials at different length scales, so that properties of this promising group of high temperature thermoelectric material can be better understood.
ACKNOWLEDGMENTS
We appreciate the financial support from the National Science Foundation (CMMI 0800366 and 0748090), the American Chemical Society—Petroleum Research Fund (PRF No. 44245-G10), and The University of North Carolina at Charlotte (UNC Charlotte). We are grateful to the Center for Precision Metrology, Department of Mechanical Engineering and Engineering Science, and Center for Optoelectronics and Optical Communications at UNC Charlotte for multiuser facilities. We also appreciate the valuable suggestions and comments from Professor Xiaodong Li at University of South Carolina, Professor Gang Feng at Villanova University, and supporting staffs at Agilent Technology nanomechanics division. We appreciate help on exporting part of AFM images by Mr. Youfei Jiang at UNC Charlotte.