Implications
Many dairy production systems focus on high-yielding cows, and less on longevity and lifetime productivity. A longevity strategy might become more attractive if there was evidence that cows do not lose efficiency or even become more efficient with age. Here, 0.5- to 10-year-old cattle were investigated. Older cows showed greater digestive and metabolic efficiency of energy utilization, independent of the feeding regime (with or without concentrate) they were subjected to. Older cows retained more energy in the body and utilized metabolizable energy more efficiently for milk production. These findings support the endeavour to increase longevity in dairy cattle.
Introduction
Limited length of productive lives of dairy cows with high daily milk yields and great dietary proportions of concentrate are characteristics of intensive dairy production systems (Mowrey and Spain, Reference Mowrey and Spain1999; Knaus, Reference Knaus2009), but these have limited sustainability despite the high daily productivity of the cows (Cassidy et al., Reference Chwalibog, Jensen and Thorbek2013). Reasons are the long non-lactating period of life during rearing in relation to the productive lifespan and the food-feed competition problem associated with the intensive use of concentrate. Therefore, increasing the length of the productive life of dairy cows is an approach to decrease the environmental footprint of milk production and, concomitantly, even to improve economic viability of cattle production systems (e.g. Bell et al., Reference Bell, Eckard, Haile-Mariam and Pryce2013; Zehetmeier et al., Reference Zehetmeier, Hoffmann, Sauer, Hofmann, Dorfner and O’Brien2014). Concerns that the breeding progress would be slowed down by a longevity strategy are not substantiated as voluntary culling is known to be much more dependent on economic circumstances and replacement management (e.g. use of beef/sexed semen, selection of dams for replacement) than on genetic progress (de Vries, Reference de Vries2015). However, along with a longer average productive life of dairy cattle, the share of comparatively old cows in the herds will increase. This would be disadvantageous if the efficiency of nutrient and energy utilization of cows decreased with age. Energy balance studies in dairy cattle are numerous, but changes with age of the cows have not been explicitly investigated in such studies (e.g. Kebreab et al., Reference Kebreab, France, Agnew, Yan, Dhanoa, Dijkstra, Beever and Reynolds2003). Age is usually not specified in detail, and can only be roughly estimated in cases where parity number is indicated in the studies. However, recently some distinct changes found in eating behaviour and digestion patterns like increased intake and prolonged retention of feed in the gastrointestinal tract with age and a reduced methane yield in the oldest cows (Grandl et al., Reference Grandl, Luzi, Furger, Zeitz, Leiber, Ortmann, Clauss, Kreuzer and Schwarm2016a and Reference Grandl, Amelchanka, Furger, Clauss, Zeitz, Kreuzer and Schwarm2016b) indicate that senescence of cattle might affect digestive and metabolic efficiency in dairy cows. It is, therefore, important to thoroughly investigate the effect of age on metabolizability, energy partitioning and efficiency of energy utilisation of dairy cattle in order to evaluate current efforts to promote longevity in dairy cattle.
Dairy productions systems with low concentrate input are increasingly recognized as alternatives to high-input systems, particularly in the light of ‘feed no food’ discussions (Knaus, Reference Knaus2013). Energy metabolism depends on diet type (Dong et al., Reference Dong, Ferris, McDowell and Yan2015). For example, Yan et al. (Reference Yan, Gordon, Agnew, Porter and Patterson1997) found a significant increase in metabolizable energy (ME) requirements for maintenance with increasing grass silage proportions and decreasing concentrate proportions in the diet, but no effect on the efficiency of the utilization of ME for milk production (k l), whereas others showed a clear dependence of k l on metabolizability (Strathe et al., Reference Strathe, Dijkstra, France, Lopez, Yan and Kebreab2011). Longevity strategies are often combined with concomitant attempts to lower dietary concentrate proportion, as reduced milk revenues can be compensated with lower expenses for concentrate and replacement animals (Horn et al., Reference Horn, Knaus, Kirner and Steinwidder2012). As a consequence, when investigating longevity strategies for milk production, concomitant changes in feeding strategy should also be considered.
Therefore, the aim of the present study was to quantify the changes with age in digestive energy utilization (characterized by faecal and methane energy losses) and metabolic energy utilization (characterized by urine and heat energy losses) in dairy cattle subjected to two feeding regimes, one without and the other with concentrate in the diet. For this purpose, an energy balance experiment was performed with animals covering a large range in age.
Materials and methods
Animals and diets
The experiment was approved by the veterinary office of the Swiss Canton of Zurich (149/2013) and was carried out from October 2013 to February 2014.
In total, 30 lactating cows and 12 heifers were selected from two Brown Swiss herds of the Agricultural Education and Advisory Centre Plantahof (Landquart, Canton of Grisons, Switzerland). These herds had been formed in 2003 and were since then kept under different feeding regimes. Concentrate was completely omitted in one feeding regime (−CON), whereas in a second regime (+CON) the diet included 5 kg/day per cow of pelleted concentrate. All other management measures were identical for the animals. Both herds were kept in one tie stall barn. Replacement was exclusively done within feeding regime, but sires used for artificial insemination were the same in both feeding regimes. The heifers, offspring of cows from the two feeding regimes, were reared on the same forage-only diet and were not separated before first parturition after which the two feeding regimes were introduced.
The selection of the animals (including the non-lactating heifers) for the experiment aimed at achieving a maximum age spectrum within each of the feeding regimes. Eventually, 15 and 15 lactating cows as well as seven and five heifers were selected from the regimes −CON and +CON, respectively. The age ranged from 199 to 3648 days for +CON and 310 to 3640 days for −CON. The corresponding levels for the selected cows in BW, milk yield (last milk recording before experiment) and days in milk were 710±53 and 666±51 kg, 42.5±7.5 and 39.3±8.2 kg/day, and 127±57 and 111±68 days (means±SD) for +CON and −CON, respectively. Medians were different (Wilcoxon’s rank-sum test) for BW (test statistic W=163, P=0.038), but not for milk yield (W=149, P=0.135) and days in milk (W=137, P=0.330).
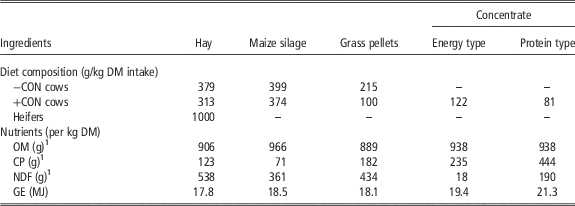
The forages (hay, maize silage and pellets prepared from artificially dried grass, supplemented with NaCl and minerals) were largely the same for animals of both feeding regimes in the experiment. The heifers received the same hay as that offered to the cows during the experiment. The diet composition as fed and the nutrient and energy contents of the feeds are provided in Table 1. In brief, the experimental treatment for each animal was the following: The experiment started after the animals were moved in pairs together with their diet (except maize silage) from Plantahof to Agrovet-Strickhof (Eschikon, Lindau, Canton of Zurich, Switzerland; distance ~160 km) for 3 days to stay in respiration chambers. Afterwards, the animals returned to the tie stall barn at Plantahof for an 8-day sampling period. At both sites, feeding and milking took place along with the normal routine applied to all cattle in the barn. All animals had permanent access to water. The cows were milked at 0315 and 1500 h. Further details on diets, animals and experimental settings are given in Grandl et al. (Reference Grandl, Luzi, Furger, Zeitz, Leiber, Ortmann, Clauss, Kreuzer and Schwarm2016a).
Ingredients, diet composition and analysed nutrient and energy contents of the feeds used in the experiment

DM=dry matter; OM=organic matter; GE=gross energy.
1 Taken from Grandl et al. (Reference Grandl, Luzi, Furger, Zeitz, Leiber, Ortmann, Clauss, Kreuzer and Schwarm2016a).
Data recording and sampling
Data recording and sampling procedures were the same as described in detail in Grandl et al. (Reference Grandl, Luzi, Furger, Zeitz, Leiber, Ortmann, Clauss, Kreuzer and Schwarm2016a and Reference Grandl, Amelchanka, Furger, Clauss, Zeitz, Kreuzer and Schwarm2016b). The open-circuit respiration chambers used were elaborately presented by Buehler and Wanner (Reference Buehler and Wanner2014). For quantification of the gaseous exchange of the animals, the average of days 2 and 3 of measurement were used for all calculations. The two chambers used for cows and heifers >400 kg BW had volumes of 19.3 m3 each, whereas all lighter heifers were put into a smaller chamber (8.3 m3). Staff accessed the chambers through airlocks in order to minimize distortion of gas measurements. The chambers were air-conditioned to maintain a temperature of 18°C and a relative humidity of 55%. Airflows were set to 700 l/min and 250 l/min in the larger and the smaller chambers, respectively (Promethion FG 1000 and FG 250 flow generators; Sable Systems Europe GmbH, Berlin, Germany). Chambers were operated under negative pressure (−60 Pa) compared with ambient air pressure. Concentrations of O2, CO2 and CH4 were analysed with a gas analyser (Promethion GA-4, Sable Systems Europe GmbH). Calibrations of the gas analysers were done automatically before each measurement. By burning of propane gas, gas recovery (average 96.9% for CO2) was determined before each experimental period.
The BW was measured on a pallet scale at Plantahof before the subsequent 8-day sampling period. Milk yield was recorded at each milking by weighing of the milking buckets at Agrovet-Strickhof and with a mechanical milk metre (Tru-Test Limited, Auckland, New Zealand) at Plantahof. Bronopol-conserved samples were collected and analysed for fat, protein and lactose on a MilkoScan FT6000 (Foss, Hillerød, Denmark).
During the 8-day sampling period, feed intake (feed offered minus refusals) and excreta amounts were recorded. Forages were sampled at the beginning and the end of the 8-day period. Samples of concentrate and grass pellets were taken twice during the entire experiment. Leftovers from each animal were collected and weighed twice per day. The samples from feeds and leftovers were immediately dried at 60°C to constant weight and ground for later analyses. Urinals attached around the vulva of the cows were fixed by hook-and-loop fastener straps glued (Cyanolit 202; Panacol Elosol GmbH, Steinbach, Germany) onto the skin in order to separate urine from faeces. Complete faeces were collected in polypropylene trays placed at the rear end of the tie stalls. Urine was collected in 20-l containers with part of the urine being channelled into 1-l containers containing 5 M sulphuric acid to maintain a pH below 5 for later determination of urinary N content. Representative samples were taken from the faeces trays twice a day proportional to the amounts excreted. The faeces were immediately frozen and composited per cow and collection period for later analyses.
Laboratory analyses
Feed and excreta were analysed according to standard procedures (Association of Official Analytical Chemists (AOAC), 1995). Feed items, faeces and urine were analysed for dry matter (DM) with a thermo-gravimetric device (model TGA-500; Leco, St. Joseph, MI, USA). Urine was analysed for nitrogen and carbon content using a C–N analyser (AOAC no. 977.02; model Analysator Type CN-2000; Leco). Combustion energy was determined in feed items to calculate gross energy (GE) intake and in faeces by a bomb calorimeter device (model Calorimeter System C700 with Cooler C7002; IKA, Staufen, Germany).
Calculations and statistical analysis
The following equations were applied for calculating energy-related variables:
 $$\eqalignno { {\rm aD}\,{\rm of}\,{\rm energy}\,& {\equals}\, [ {{\rm GE}\,{\rm intake}\,( {{\rm MJ/day}} ) } \cr & \ \ \, {{\minus}\,{\rm faecal}\,{\rm energy}\,{\rm loss}\,( {{\rm MJ}/{\rm day}} \right)} ] /\cr\ \ \,{\rm GE}\,{\rm intake } \ ( {{\rm MJ}/{\rm day}} ).$$
 $$\eqalignno { \hskip -2pc{\rm CH}_{{\rm 4}} \,{\rm energy}\,\left( {{\rm MJ}/{\rm day}} \right)\, {\equals} \,{\rm CH}_{{\rm 4}} \left( {{\rm l}/{\rm day}} \right) \cr \quad {\times}{\rm 0}{\rm .03957 } \ \left ( {{\rm Brouwer, 1965}} \right).$$
 $$\eqalignno { {\rm Urine}\,{\rm energy}\,\left( {{\rm MJ}/{\rm day}} \right)\,{\equals}\, {\rm 0}{\rm .0331}{\times}{\rm urine}\,{\rm C}\,\left( {{\rm g}/{\rm day}} \right) \cr \quad {\plus}{\rm 0}{\rm .0092}{\times}{\rm urine}\,{\rm N}\,\left( {{\rm g/day}} \right)\,\cr &\quad{\rm (Hoffmann} \ {\rm and} \ {\rm Klein,} \ {\rm 1980)}{\rm .}$$
 $$\eqalignno { {\rm ME}\,\left( {{\rm MJ}/{\rm day}} \right)\,{\equals}\, & {\rm GE}\,{\rm intake}\,\left( {{\rm MJ}/{\rm day}} \right) \cr & {\minus}{\rm faecal}\,{\rm energy}\,{\rm loss}\,\left( {{\rm MJ}/{\rm day}} \right) \cr & {\minus}{\rm CH}_{{\rm 4}} \,{\rm energy}\,{\rm loss}\,\left( {{\rm MJ}/{\rm day}} \right) \cr & {\minus}{\rm urine}\,{\rm energy}\,{\rm loss}\,\left( {{\rm MJ}/{\rm day}} \right).$$
 $$\eqalignno { & {\rm Heat}\,{\rm energy}\,({{\rm MJ}/{\rm day;}}\,{\rm corrected}\,{\rm for}\,{\rm assumed}\,{\rm CO}_{{\rm 2}} \,{\rm production}\, \cr & {\rm from}\,{\rm microbial}\,{\rm fermentation} \right) \,\cr \quad{\equals}\,{\rm 0}{\rm .01618}{\times}{\rm O}_{{\rm 2}} \,\left( {{\rm l}/{\rm day}} \right) \cr & \quad{\plus}{\rm 0}{\rm .00502}{\times}\left[ {{\rm CO}_{{\rm 2}} \left( {{\rm l}/{\rm day}} \right) {\minus}{\rm 3}{\times}{\rm CH}_{{\rm 4}} \left( {{\rm l}/{\rm day}} \right)} \right] {\minus}{\rm 0}{\rm .00217} \cr & \quad{\times}{\rm CH}_{{\rm 4}} \,\left( {{\rm l}/{\rm day}} \right){\minus}{\rm 0}{\rm .00599} {\times}{\rm urine}\,{\rm N}\,\left( {{\rm g}/{\rm day}} \right) \cr & \quad\quad\,\left( {{\rm Chwalibog} \ { et \ al} {\rm .,}\,{\rm 1996}} \right). $$
 $$\eqalignno { {\rm Milk}\,{\rm energy}\,{\rm content}\,\left( {{\rm MJ}/{\rm kg}} \right) \, {\equals}\, &{\rm 0}{\rm .038}{\times}{\rm fat}\,\left( {{\rm g}/{\rm kg}} \right){\plus}{\rm 0}{\rm .024} \cr & {\times}{\rm protein}\,\left( {{\rm g}/{\rm kg}} \right) {\plus}{\rm 0}{\rm .017}\cr &{\times}{\rm lactose}\,\left( {{\rm g}/{\rm kg}} \right)\, \cr & {\rm (Agroscope,}\,{\rm 2017)}{\rm .} $$
 $$\eqalignno { {\rm ECM}\,\left( {{\rm kg}/{\rm day}} \right)\,{\equals}\,{\rm milk}\,\left( {{\rm kg}/{\rm day}} \right) {\times}{\rm milk}\,{\rm energy}\,\left( {{\rm MJ}/{\rm kg}} \right)/{\rm 3}{\rm .14} \cr & \quad {\rm (Agroscope,}\,{\rm 2017)}{\rm .}$$
 $$\eqalignno{ q\,{\equals}\, & {\rm ME}\,{\rm intake}\,\left( {{\rm MJ}/{\rm day}} \right)/{\rm GE}\,{\rm intake}\,\left( {{\rm MJ}/{\rm day}} \right) \cr & ({\rm GfE},\,{\rm 2}00{\rm 1)}{\rm .} $$
 $$\eqalignno { {\rm Estimated}\,k_{{\rm l}} \,\left( {\tf="Frutiger_condfont_roman"%} \right)\,{\equals}\,&0.{\rm 6}{\times}({\rm 1}{\plus}0.00{\rm 4)}{\times}({\rm 1}00{\times}q{\minus}{\rm 57})\, \cr & ({\rm modified}\,{\rm after}\,{\rm Van}\,{\rm Es},\,{\rm 1975}).$$
$$\eqalignno { {\rm Calculated}\,k_{{\rm l}} \,{\equals}& \, {\rm milk}\,{\rm energy}\ ({\rm MJ} ) / [ {{\rm ME}\,{\rm intake}} {\minus}\cr & ( {{\rm NEL}\,{\rm requirements}\,{\rm for}\,{\rm maintenance}/0.{\rm 72}} ) \cr & \!{\plus }({\rm body}\,{\rm energy}\,{\rm retention}/0.{\rm 65 )} ]. $$
In Equation (10) it is assumed that the efficiency of ME utilization for maintenance is 0.72 and the efficiency of ME utilization for body energy retention is 0.65 (the average value used for growth) (Gesellschaft für Ernährungsphysiologie, Ausschuss für Bedarfsnormen (GfE), 2001). The double transformation loss for storing energy in body tissue and mobilizing it for milk production was neglected, because most cows were either in positive or only slightly negative energy balance, and its introduction largely increased between-animal variation.
Finally, energy supply relative to calculated requirements was calculated. Intakes were either given as net energy for lactation (NEL) (calculated using k l from equation (9)) or as ME (measured). For cows, the NEL requirements were calculated as the sum of maintenance requirements (BW0.75×0.293 MJ NEL/kg BW0.75; GfE, 2001) and the requirements for energy-corrected milk (ECM) production (3.14 MJ/kg ECM). The ME requirements were calculated as 488 kJ/kg BW0.75 for maintenance (0.293 MJ NEL/kg BW0.75×k l) and the NEL requirements for ECM production×(1/k l). For the heifers, the ME requirements were calculated according to recommendations in GfE (2001) depending on their BW and an estimated average daily BW gain of 500 g/day.
All statistical analyses were performed with the statistical software R (R Core Team, 2017). Data were subjected to parametric regression analyses. The following model was applied to analyse the effects on the log-transformed response variables:
 $$E\left[ {Y\left| {{\mib{X}} \,{\equals}\,{\mib{x}} } \right.} \right]\,{\equals}\,\beta _{0} {\plus}{\mib{\bibeta }} {\times}{\mib{x}} ,$$
where β 0 is the intercept, β the regression coefficients of the explanatory variables ( x ) feeding regime and age and their interaction, and of the covariates BW, daily ECM yield and the proportion of hay in the forage. Age (in days) was included in the full model as linear variable and transformed with the natural logarithm (ln) in order to allow for different types of relationships of age and the response variables. Dietary characteristics were considered by including the feeding regime effect. The model included BW, daily ECM yield and the proportion of hay in the forage (all ln-transformed) as covariates (data shown in Grandl et al., Reference Grandl, Luzi, Furger, Zeitz, Leiber, Ortmann, Clauss, Kreuzer and Schwarm2016a), which ensured that effects of feeding regime and age were corrected for individual variation among animals in performance and forage preferences. Akaike‘s information criterion (Akaike, Reference Akaike1974), modified for small sample sizes (Symonds and Moussalli, Reference Symonds and Moussalli2011), was used to facilitate model selection for each trait analysed in an all-subsets approach using the package glmulti (Calcagno, Reference Calcagno2013). Model assumptions were verified by graphically analysing the residuals for normality, independence and homoscedasticity of the errors.
Adjusted means for the feeding regimes were calculated with the effects package (Fox, Reference Fox2003). The figures display measured individual data points, as well as regression lines for cows visualising the age effects while keeping the covariates BW, ECM yield and hay proportion constant at their median. Non-lactating heifers and cows clearly differed in diet ingredient composition and metabolic status. Therefore, the heifer data were analysed separately applying regression models which included feeding regime and age as effects. As the non-lactating heifers were growing, age effects also included effects of changing BW. Heifers never differed (P>0.10) between the two groups (the designated feeding regimes); therefore, data were presented in tables as means across both feeding regimes.
Results
Absolute intake, losses and retention of energy
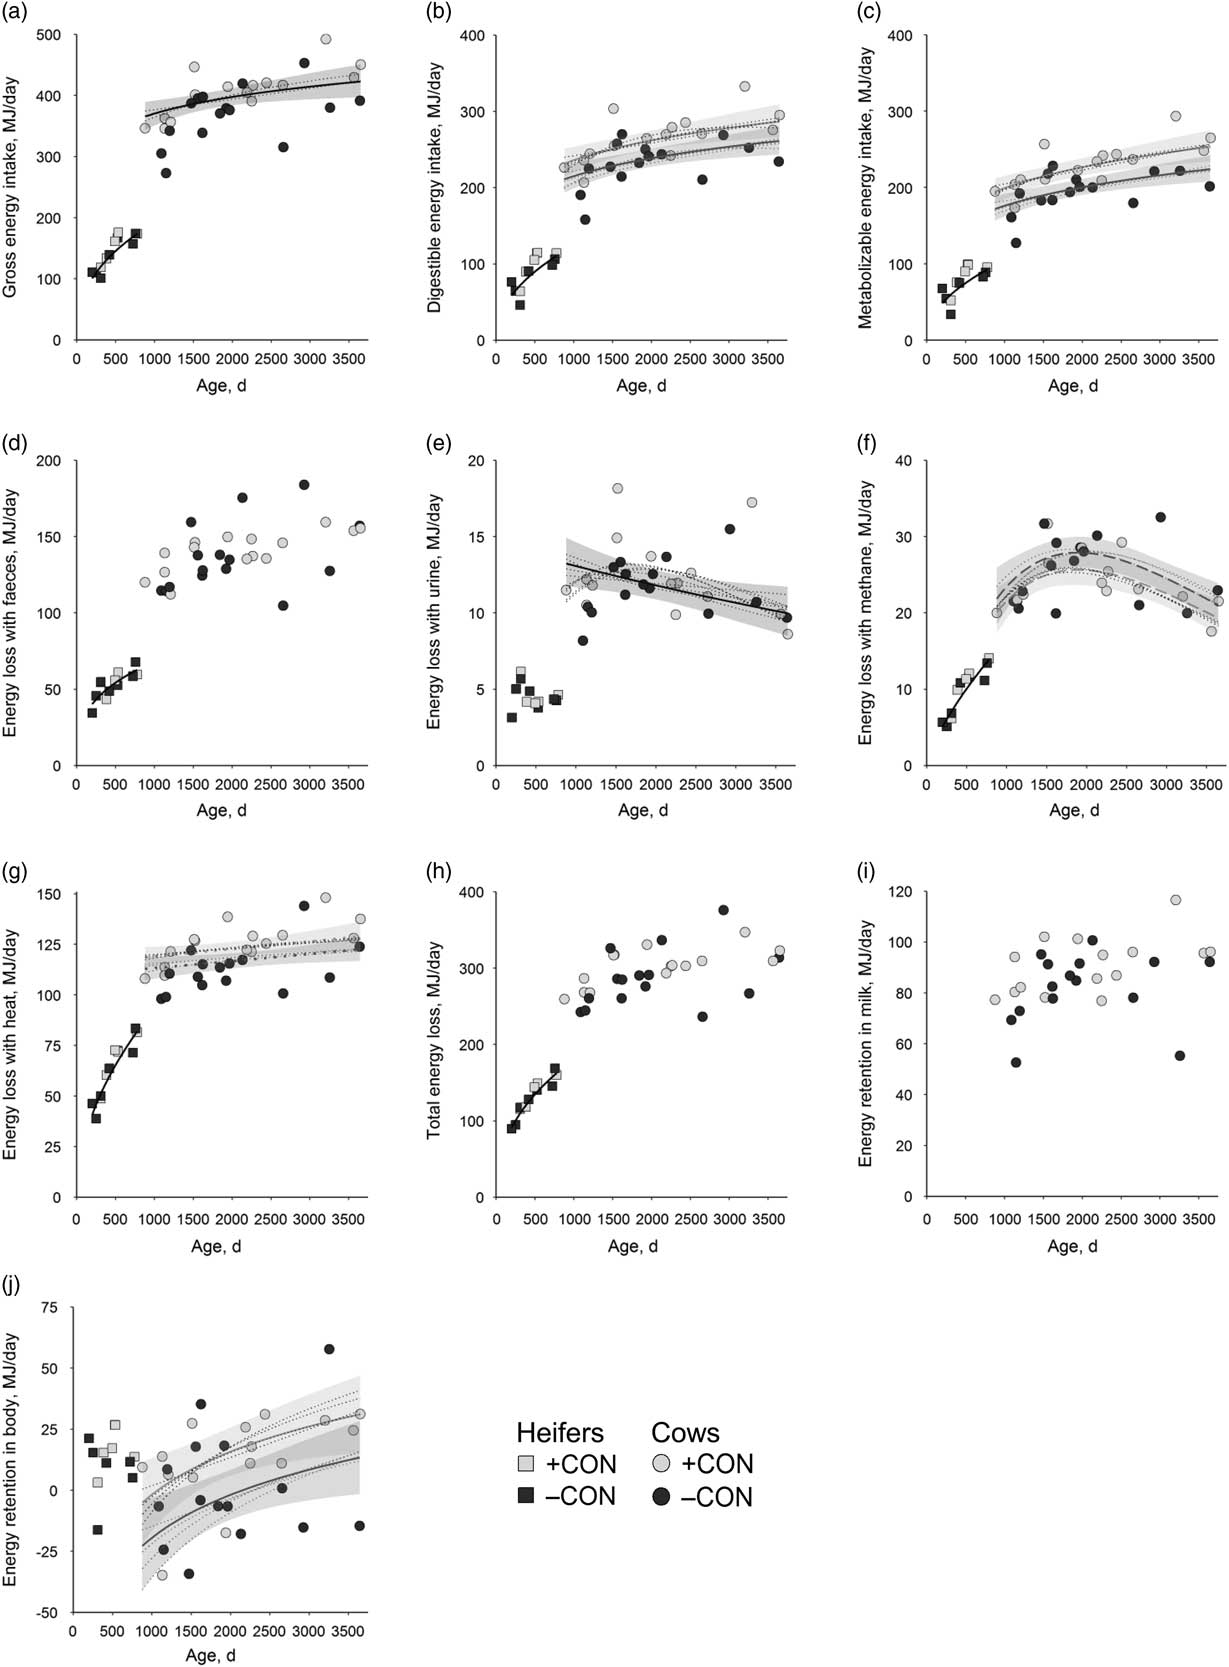
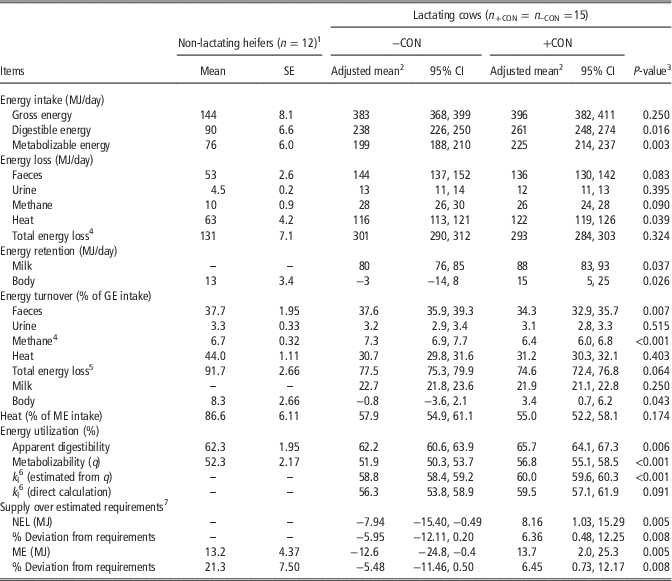
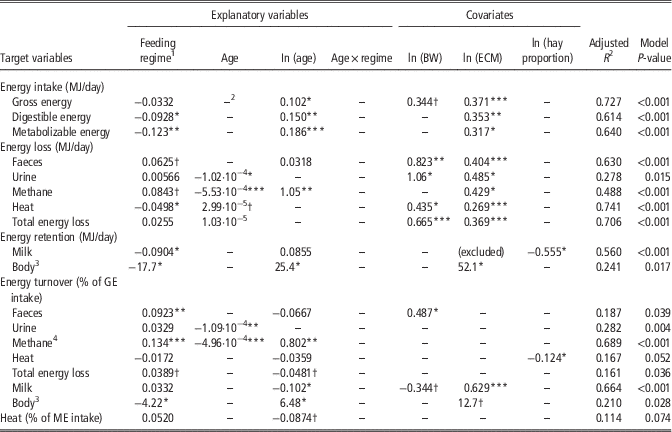
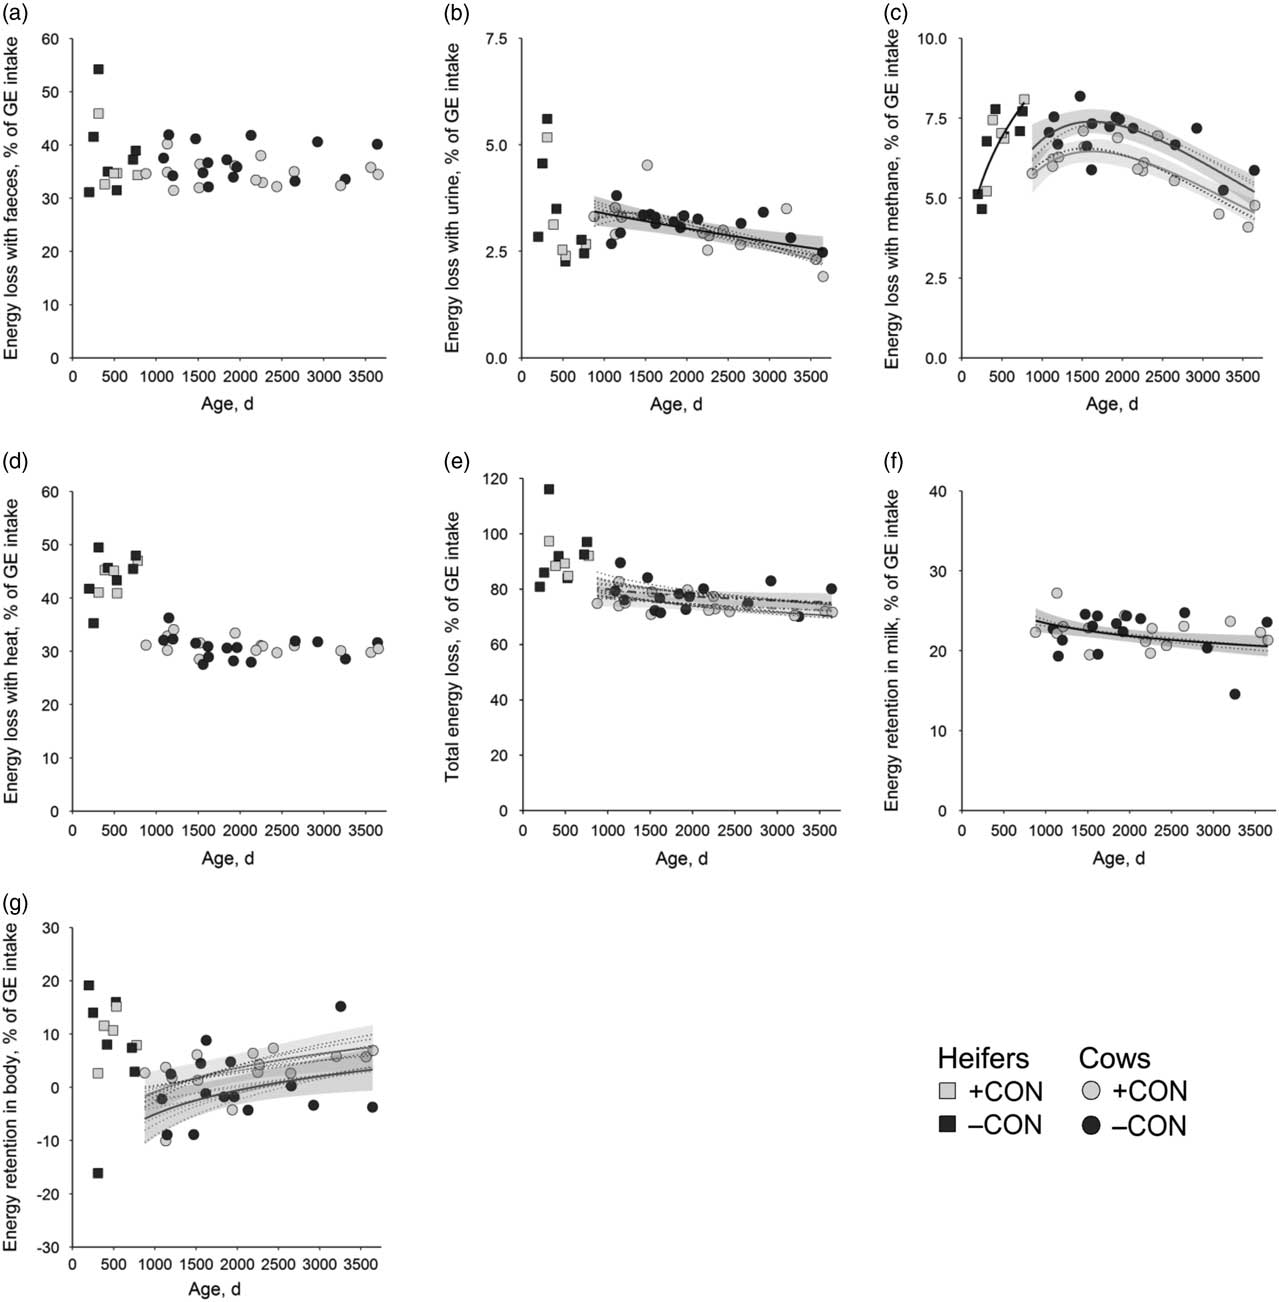
There were no differences in GE intake between the feeding regimes but the levels of digestible energy (DE) and ME intakes were smaller in −CON cows (Table 2). The intakes of GE, DE and ME increased with age in the cows (Figure 1a to c; Table 3). No effects of age on energy losses with faeces were observed in the cows, but losses with urine decreased with age in cows without any difference between the feeding regimes (Figure 1d and e; Table 3). Energy losses with faeces and CH4 were greater by tendency (P=0.083 and 0.090, respectively, Table 2) in −CON cows compared with +CON cows, and CH4 energy losses showed a curvilinear relationship with age (Figure 1f, Table 3). Energy losses with heat were smaller in −CON cows and tended to increase with age in cows (Figure 1g, Table 3). There was no effect of feeding regime or age on total energy losses in the cows. Retention of milk energy was smaller in cows of the −CON feeding regime. There was no significant effect of age on the energy retained in milk. Compared with −CON cows, cows from the +CON feeding regime were able to retain more energy in their body (Table 2). The same was true for older cows in both feeding regimes (Figure 1j, Table 3). The interaction of feeding regime and age was never significant in any of the daily energy balance traits investigated (Table 3). In the heifers, there was an increase in all energy intake traits with age (Figure 1). The same applied to all daily energy losses except for energy losses with urine (Figure 1). Energy retention was about 13 MJ/day on average for heifers of all ages.
Observed values for cows (○) and heifers (□) and prediction lines for regression fits (varying age but keeping BW, energy-corrected milk yield and hay proportion in forage to the respective median) for intake of gross (a), digestible (b) and metabolizable (c) energy, loss of energy with faeces (d), urine (e), methane (f), heat (g) and the sum thereof (h), and energy retention in milk (i) and body (j). Symbol and line colours indicate values and prediction lines for feeding regimes with concentrate (+CON; open, light grey) and without concentrate (−CON; solid, dark grey) animals. Only one prediction line was drawn in case of P>0.10 for feeding regime. No prediction line was drawn in case of P>0.10 for age. Dashed or dotted prediction lines were drawn in case of 0.05<P<0.10 for feeding regime and age, respectively. For cow regressions, shaded areas represent 95% confidence bands, and thin dotted lines represent prediction lines for regression fits of regression models within a difference <2 in Akaike‘s information criterion value between the best and the respective model. The medians of heifer and cow data were significantly (P<0.001) different in the traits presented in a, b, c, d, e, f, g and h.

Energy intake, excretion and utilization of heifers and of cows from the feeding regime with concentrate (+CON) and without concentrate (−CON)

CI=confidence interval; GE=gross energy; ME=metabolizable energy; NEL=net energy for lactation.
1 Data from heifers from both feeding regimes are combined in the table, as they were fed the same diet and no differences (P>0.05) between feeding regimes were found.
2 Adjusted means (fitted values for feeding regime levels keeping age, BW and energy-corrected milk yield at their median).
3 P-value of regression coefficient of feeding regime from analysis of cow data.
4 Taken from Grandl et al. (Reference Grandl, Amelchanka, Furger, Clauss, Zeitz, Kreuzer and Schwarm2016b).
5 Sum of energy losses with faeces, urine, methane and heat.
6 Proportionate utilization of ME for milk energy formation. Calculations see ‘Materials and methods’ section.
7 Calculations see ‘Materials and methods’ section.
Regression coefficients for energy balance traits in cows and their statistical significance (equations are displayed as graphs in Figure 1 (variables with daily amounts) and Figure 2 (variables giving proportions of gross energy (GE) intake))

BW=body weight; ECM=energy-corrected milk yield; ME=metabolizable energy.
1 Reference level is the feeding regime with concentrate (+CON).
2 Variable not included in the final regression model after the variable selection procedure.
3 No ln-transformation applied.
4 Taken from Grandl et al. (Reference Grandl, Amelchanka, Furger, Clauss, Zeitz, Kreuzer and Schwarm2016b).
***P<0.001, **P<0.01, *P<0.05; †P<0.10.
Energy intake, losses and retention relative to gross energy intake
When the energy balance traits were related to GE intake, faecal losses were greater in −CON cows (Table 2) but were not related to age (Figure 2a, Table 3). Proportional energy losses with urine did not differ between animals from the two feeding regimes (Table 2), but a decrease with age was observed in the cows (Figure 2b, Table 3). Energy losses with CH4 as a proportion of GE intake were greater in −CON cows (Table 2) and showed a curvilinear relationship with age with a maximum in the middle-aged cows (Figure 2c, Table 3). No effects of feeding regime and age were observed in cows for relative energy losses as heat. Total losses of energy as a proportion of GE intake were smaller (P=0.064) for +CON cows (Table 2) and decreased (P=0.069) slightly with age (Figure 2d, Table 3). Milk energy as a proportion of GE intake did not differ between feeding regimes whereas there was an effect in retained energy in the body, where +CON cows retained a small proportion of the GE consumed and −CON cows mobilized energy from body tissue (Table 2). With increasing age, the cows retained a smaller proportion of their ingested GE as milk (Figure 2f, at constant milk energy output, Figure 1i) and increased the proportion of energy that was retained in their body (Figure 2g). Again, no significant interaction of age and feeding regime was identified in these traits (Table 3). In the heifers, there were no significant age effects on relative energy balance traits except for an increase in relative CH4 losses with age (Figure 2c).
Observed values for cows (○) and heifers (□) and prediction lines for regression fits (varying age but keeping BW, energy-corrected milk yield and hay proportion in forage to the respective median) for loss of energy with faeces (a), urine (b), methane (c), heat (d) and the sum thereof (e), and energy retention in milk (f) and body (g) as a proportion of intake of gross energy. Symbol and line colours indicate values and prediction lines for feeding regimes with concentrate (+CON; open, light grey) and without concentrate (−CON; solid, dark grey) animals. Only one prediction line was drawn in case of P>0.10 for feeding regime. No prediction line was drawn in case of P>0.10 for age. A dot-dashed line was drawn in order to represent the P-value for age and feeding regime being in the interval (0.05, 0.10). For cow regressions, shaded areas represent 95% confidence bands, and thin dotted lines represent prediction lines for regression fits of regression models within a difference <2 in Akaike‘s information criterion value between the best and the respective model. The medians of heifer and cow data were significantly (P⩽0.001) different in the traits presented in d, e and g.

Energy utilization and energy supply over requirements
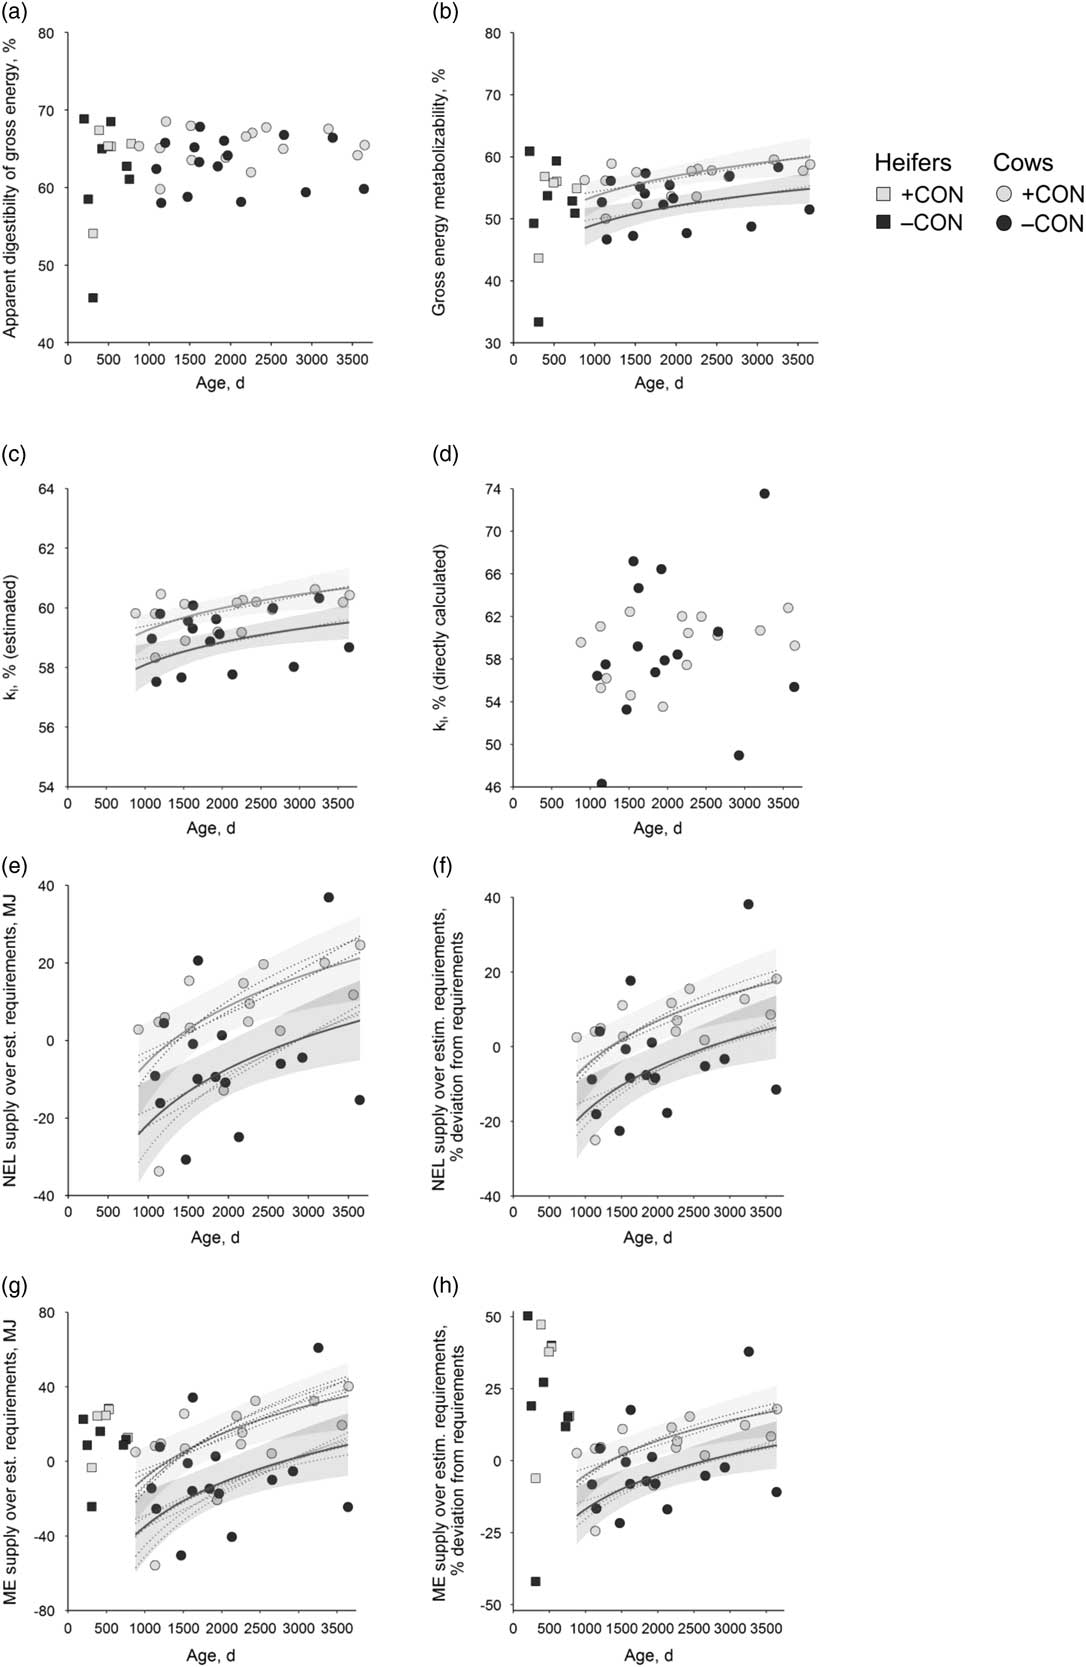
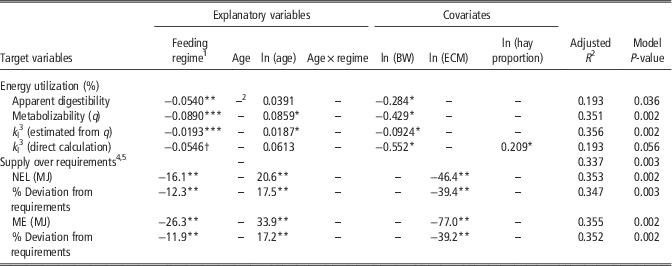
Both apparent digestibility (aD) of energy and metabolizability (q) were smaller in −CON cows relative to +CON cows and were in a similar range to heifers (Table 2). There was no significant relationship with age in aD of energy (Figure 3a), but an increase was found with age of cows in q (Figure 3b, Table 4). The estimated k l was lower in −CON cows compared with +CON cows (Table 2) and was increasing with age (Figure 3c, Table 4). Values for k l directly calculated pointed into the same directions for feeding regime and age, but values were highly variable between cows (Figure 3d) and thus the effects could not be statistically confirmed (Table 4). When energy intake, losses and energy utilization were put together and related to estimated requirements for maintenance and milk production (in cows), it was obvious that most cows from the −CON feeding regime could not fulfil their energy requirements by intake during the experiment (Figure 3e-h). This deficiency was in the order of about 6% of the estimated requirements. There was also a significant effect of age on the energy intake over requirements (Figure 3e-h). However, the variation among cows in energy balance was quite large. Although in the calculations the requirements for growth in first-lactating cows were not included, this omission did not result in a sharp increase in supply over requirements for slightly older cows with more parities (Figure 3e-h; parity number not shown). The non-lactating heifers consumed more energy compared to the estimated requirements and all but two animals showed a positive energy balance.
Observed values for cows (○) and heifers (□) and prediction lines for regression fits (varying age but keeping BW, energy-corrected milk yield and hay proportion in forage to the respective median) for apparent digestibility (a) and metabolizalibilty (b) of gross energy, efficiency of energy utilization for milk production (c, d) as well as supply over estimated requirements for energy, presented on the level of net energy for lactation (e, f) and metabolizable energy (g, h). Symbol and line colours indicate values and prediction lines for feeding regimes with concentrate (+CON; open, light grey) and without concentrate (−CON; solid, dark grey) animals. No prediction line was drawn in case of P>0.10 for age. For cow regressions, shaded areas represent 95% confidence bands, and thin dotted lines represent prediction lines for regression fits of regression models within a difference <2 in Akaike’s information criterion value between the best and the respective model. The medians of heifer and cow data were significantly (P<0.001) different in the trait presented in h. ME=metabolizable energy; NEL=net energy for lactation.

Regression coefficients for traits describing energy utilization and supply over requirements in the cows and their statistical significance (equations are displayed as graphs in Figure 3)

BW=body weight; ECM=energy-corrected milk yield; NEL=net energy for lactation; ME=metabolizable energy.
1 Reference level is the feeding regime with concentrate (+CON).
2 Variable not included in the final regression model after the variable selection procedure.
3 Proportionate utilization of ME for milk energy formation. Calculations see ‘Materials and methods’ section.
4 No ln-transformation applied.
5 Calculations see ‘Materials and methods’ section.
***P<0.001, **P<0.01, *P<0.05; †P<0.10.
Discussion
In the present study, we investigated the effect of age on the energy balance of 42 Brown Swiss dairy cattle between 0.5 and 10 years of age. One goal of the present study was to determine whether age effects would develop differently in the two different feeding regimes. However, not a single significant interaction between the effect of the feeding regime and the age effect on the investigated traits was observed. Diets with a greater difference in concentrate proportion than those used in the present study might have had a greater effect on the response of cows of the different regimes to age. Still, the present data indicate that the age effects are quite robust against dietary differences and thus also were similar in cows in positive energy balance and in cows slightly mobilizing energy.
As data were analysed separately, the differences between lactating cows and non-lactating heifers can only be discussed qualitatively, and only in relation to GE intake. The aD of GE was in a similar range for heifers and −CON cows. Compared with the cows, the energy losses with heat were greater in the heifers. This indicates a certain level of overfeeding of the heifers, as was also obvious from calculating energy supply over estimated requirements. The reason was the rather high quality of the hay offered during the study which contradicts the slow growth of heifers to reach a target age of first calving of 30 to 36 months intended by the herd management.
Effects of feeding regime on energy turnover
Given the design of the −CON feeding regime, it was expected that cows in this group had a lower level of DE and ME intake compared with the cows receiving concentrate, despite consuming almost the same amounts of GE. The different levels of fibre in the diet (458 v. 395 g NDF/kg DM as consumed in the −CON and the +CON group, respectively) had only a small effect on feed intake, even though a reduction of DM intake is often reported with increasing fibre content (discussed extensively, e.g., by Allen, Reference Allen2000). Indeed, the −CON diet was less digestible than the +CON diet. As fibre is the main substrate for methanogenesis through fibrolytic micro-organisms and methanogens, the greater absolute and relative energy loss with CH4 of the −CON cows compared with the +CON cows was expected (discussed in detail in Grandl et al., Reference Grandl, Amelchanka, Furger, Clauss, Zeitz, Kreuzer and Schwarm2016b). This resulted in a diet-induced smaller digestive efficiency of the −CON cows. The different CH4 energy loss between the two feeding regimes explained the even larger difference in metabolizability compared with digestibility and, consequently, the smaller ME intake of the −CON cows.
This was associated with smaller absolute heat energy losses in the −CON cows compared with the +CON cows, but this relationship was not present when heat was related to GE and ME intake. Concerning the retention of body energy, the ME supply was not sufficient to allow −CON cows to accrete body energy reserves, whereas +CON cows utilized 3.4% of GE for this purpose. The extent of this difference was not expected because the −CON cows were lighter (666 v. 710 kg in +CON; Grandl et al. Reference Grandl, Luzi, Furger, Zeitz, Leiber, Ortmann, Clauss, Kreuzer and Schwarm2016a) and therefore would have had lower ME requirements for maintenance. Freetly et al. (Reference Freetly, Nienaber and Brown-Brandl2006) found that beef cattle with greater energy retention in the body had a greater absolute heat production, which is consistent with the greater heat production found in the +CON cows compared with the −CON cows. This might be explained with the great proportionate energy losses associated with metabolic protein formation.
Still, apart from digestive energy utilization, also the metabolic energy utilization was superior in the +CON cows compared with the −CON cows. There are several potential reasons for this. At first, there is evidence that the metabolic activity of organs is elevated in cattle with increasing fibre content in the diet (Reynolds et al., Reference Reynolds, Crompton and Mills1991), which reduces the availability of energy for other purposes. Another reason could be that the available ME was used less efficiently for milk energy production in −CON cows. This was actually the case, as estimated k l was significantly lower in the −CON cows than in the +CON cows. A decrease in efficiency of ME utilization for production was also reported by Coppock et al. (Reference Coppock, Flatt, Moore and Stewart1964) when the forage proportion was increased from 500 to 1000 g/kg. In contrast, Ferris et al. (Reference Ferris, Gordon, Patterson, Porter and Yan1999), and recently Dong et al. (Reference Dong, Ferris, McDowell and Yan2015), found no differences in k l for different forage proportions in the diet. The estimation of k l from q is based on the assumption that ME can be better utilized (in a linear pattern) during metabolism with increasing q. This is a well characterized relationship in ruminants (e.g. Van Es, Reference Van Es1975; Blaxter and Boyne, Reference Blaxter and Boyne1978), and extensive, more recent statistical re-evaluations confirmed this relationship even though the coefficient differed to some extent (Strathe et al., Reference Strathe, Dijkstra, France, Lopez, Yan and Kebreab2011; Dong et al., Reference Dong, Ferris, McDowell and Yan2015). Still the original articles where this relationship has been introduced into energy metabolism research do not specify reasons for it. Although Agnew and Yan (Reference Agnew and Yan2000) state that information of a direct influence of volatile fatty acid composition on k l is inconsistent, the types of substrates generated in the rumen might play a role (Strathe et al., Reference Strathe, Dijkstra, France, Lopez, Yan and Kebreab2011; Dong et al., Reference Dong, Ferris, McDowell and Yan2015). The digestion of less fibrous and more degradable diets results in a higher propionate-to-acetate ratio. Propionate, as an important precursor for milk lactose production, promotes milk yield, whereas acetate primarily promotes milk fat production, which is less energy efficient than lactose production. Accordingly, Huhtanen et al. (Reference Huhtanen, Miettinen and Ylinen1993) reported a reduced k l at increasing butyrate infusion levels and thus low propionate proportions. The difference in CH4 energy loss between the feeding regimes supports the assumption that the volatile fatty acid composition influences k l. Less CH4 energy loss itself does not directly contribute to greater k l, but is often associated with changes in the profile of the volatile fatty acids (more propionate, less acetate; Moss et al., Reference Moss, Jouany and Newbold2000). For the present study, to some extent an independent confirmation of the k l estimation from q was given when the k l values were calculated directly (same trend despite high individual variability).
In the heifers, there were no significant differences between the animals originating from the two different feeding regimes. As these animals were fed the same diet both during their entire rearing phase and during the present experiment, any difference could have indicated selection effects of animals specifically suited for their respective feeding regime, or epigenetic effects of the diets of their respective dams. However, in energy balance no such differences were found.
Effect of age on energy turnover
The age effects found in the non-lactating heifers were mostly related to the increasing GE intake with age and the concomitantly increasing BW and were thus expected. One exception was CH4, which increased with age also relative to GE intake in the heifers. The energy retention in the body found in the non-lactating animals varied from 3% to 19% of GE. Only one animal had a negative energy balance during the 8-day measurement period of the experiment, but the reason for this is could not be determined. The average retention of 8.3% of GE intake was greater than that reported by Hammond et al. (Reference Hammond, Humphries, Crompton, Kirton and Reynolds2014) for heifers also fed on forage-based diets, and was even in the range of maize-silage fed dairy heifers in another study by Hammond et al. (Reference Hammond, Humphries, Westbury, Thompson, Crompton, Kirton, Green and Reynolds2015). Still, aD and q were smaller in the heifers of the present study compared to animals supplied with the higher quality feeds in Hammond et al. (Reference Hammond, Humphries, Westbury, Thompson, Crompton, Kirton, Green and Reynolds2015) and Jiao et al. (Reference Jiao, Yan, Wills and McDowell2015), and were in the range of the forage fed animals in Hammond et al. (Reference Hammond, Humphries, Crompton, Kirton and Reynolds2014). The difference in energy turnover and aD and q of heifers between the present and other the cited studies might be related to heifer rearing intensity (i.e. different physiological development of heifer reared intensively or extensively), but this would require further investigation.
Results on feed efficiency (feed per unit of milk or BW; c.f. Grandl et al., Reference Grandl, Amelchanka, Furger, Clauss, Zeitz, Kreuzer and Schwarm2016b) already indicated that older cows might be overall more efficient than younger cows. Older cows showed increased energy intakes, but energy loss with faeces and aD of GE were not affected by age. Energy losses with CH4 first increased from primiparous cows to cows of about 1500 days of age, and then decreased again. From the lack of change in aD of organic matter, despite a maximum in aD of fibre found in the middle-aged cows, and the development of CH4 losses with age (discussed in detail in Grandl et al., Reference Grandl, Amelchanka, Furger, Clauss, Zeitz, Kreuzer and Schwarm2016b) we conclude that digestive energy efficiency was high in very young and old cows. Apparently, these animals were able to obtain the nutrients required without extensively degrading fibre, thus reducing proportionate losses as CH4. While we hypothesized that a key mechanism might consist of different stages of tooth development and wear (Grandl et al., Reference Grandl, Luzi, Furger, Zeitz, Leiber, Ortmann, Clauss, Kreuzer and Schwarm2016a), it is still unclear how these animals are superior in making use of non-fibre carbohydrates.
The relationship with age was of a different kind in metabolic losses and efficiency of metabolic energy utilization. Although energy losses via urine are reflecting an inefficiency in metabolism, the term ME, as conventionally applied, already excludes the energy needed to compensate for these losses. There was a clear and linear decrease of absolute and relative urine energy excretion with age. The corresponding urine N excretion (data not shown) was less clearly affected by age, whereas the majority of the changes were caused by changes in urine C excretion (data not shown). This indicates that especially older cows excreted organic compounds with a smaller C : N ratio, likely urea, and less of other no longer utilized metabolic N compounds with the urine such as hippuric acid, creatine and creatinine (Dijkstra et al., Reference Dijkstra, Oenema, van Groenigen, Spek, van Vuuren and Bannink2013). The changes in urine energy relative to GE were not very pronounced but were sufficient to result in a continuously increasing ME supply with age (absolute and relative), at a slope which could not be the result of CH4-energy-related modifications alone.
The most important energy loss in metabolism, heat production, did not change with age in its share of GE intake. Given the higher ME supply, this allowed older cows to transfer more energy in either milk or body, or both. Accordingly, the calculated ME and NEL supply was higher than required for maintenance and milk yield. Despite the preference of older cows for body energy retention, older cows in addition utilized ME more efficiently for milk energy production as can be seen from the slightly curvilinear increase with age in estimated k l. Like for the effects of feeding regime, the directly calculated k l values point towards the same direction although the relationship with age was not significant and individual variation was very large. The question for the biological reason behind the increase in efficiency of milk production in older cows remains to be answered. The age-related changes in CH4 energy loss as such do not explain a better utilization of the extra ME, but the associated changes in ruminal fermentation with age might improve energy utilization. The observed decline in aD of fibre (Grandl et al., Reference Grandl, Luzi, Furger, Zeitz, Leiber, Ortmann, Clauss, Kreuzer and Schwarm2016a) at unchanged aD of energy suggests that propionate-to-acetate ratio increased with age. The second component contributing to the increase with age in estimated k l were the lower urinary energy losses. This points towards a generally higher metabolic efficiency of older cows compared with the younger cows participating in the present study. However, Reynolds et al. (Reference Reynolds, Tyrrell and Reynolds2011) considered the effects of urea production on overall energy expenditure as rather small. Other explanations might include age-related changes in gut and liver tissue. Reynolds et al. (Reference Reynolds, Tyrrell and Reynolds2011) stress the great impact of these tissues and their metabolism in ruminants. Finally, the age-related changes in metabolic efficiency of cows might be related to different amounts and quality (lipid v. protein) of mobilized and retained tissues, or simply due to a changing body tissue composition, which alters the energetic costs of maintenance (Strathe et al., Reference Strathe, Dijkstra, France, Lopez, Yan and Kebreab2011).
From the present results, it cannot be distinguished if the old cows were efficient because of improvements with age, or because the most energy efficient cows survived several culling decisions. However, when we compared the breeding values (Braunvieh Schweiz, Personal communication) of the animals in the experiment, there was no age trend in the total merit index, the milk index or the fitness index (data not shown), indicating that the experimental animals were genetically quite similar with regard to the indices. It is nevertheless a topic for further investigations whether there is genetic variation for the characteristics we observed in the present study that is not yet covered by these indices.
Conclusion
In the present study, we investigated the effect of age of dairy cattle originating from two feeding regimes on digestive and metabolic energy utilization. Non-lactating heifers and lactating cows clearly differed in most traits. Within the heifers, no age effects were found apart from traits where the effects were obviously related to the increasing body size of growing animals. Independent of feeding regime, digestive and metabolic energy utilization were greatest in the oldest lactating cows even though energy digestibility did not change. Further investigations are needed to decide whether recommendations for energy requirements should be adapted for older cows with respect to their greater body energy retention. Indeed, extra reserve formation would be desirable in the earlier part of the lactation in order to allow cows to return to good body condition earlier, whereas excessive body energy reserve formation in later lactation stages should be minimized in order to avoid over-conditioned animals. The present results support efforts to further investigate advantages of increased longevity of cows.
Acknowledgements
The project was supported by the Mercator Research Program of the ETH Zurich World Food System Center. The authors gratefully acknowledge the help of the institutions and numerous persons involved in the experiment, especially at Plantahof (A. Accola, D. Balestra, C. Brandenburger, K. Freuler, J. Jenewein, P. Küchler) and at ETH Zurich (C. Kunz, S. Marquardt, M. Mergani, R. Messikommer, P. Stirnemann, E. Wenk).