INTRODUCTION
Antibody prevalence data place human toxocariasis (HT) among the most common zoonotic helminthic infections worldwide (Rubinsky-Elefant et al. Reference Rubinsky-Elefant, Hirata, Yamamoto and Ferreira2010). HT is caused by infection with the larval stage of the Toxocara canis or T. cati worms. Humans are paratenic hosts and do not spread infection. They get infected by the accidental ingestion of Toxocara eggs, which are shed in the environment by dog or cat feces (Glickman and Schantz, Reference Glickman and Schantz1981). To be infective, eggs need to be embryonated (i.e. contain Toxocara larvae), which requires specific climatic conditions. Most infections in humans are asymptomatic, yet they may be associated with severe disease conditions. HT-related syndromes include visceral, ocular and neural involvement, depending on the organ affected by migration of the larvae (Beaver et al. Reference Beaver, Snyder, Carrera, Dent and Lafferty1952; Magnaval et al. Reference Magnaval, Glickman, Dorchies and Morassin2001).
Assays detecting IgGs specific for T. canis excretory–secretory antigens have been used to measure exposure in humans and have provided important insights in the epidemiology of HT, i.e. showing that exposure is frequent, but also varies greatly across countries (Smith et al. Reference Smith, Holland, Taylor, Magnaval, Schantz and Maizels2009). Environmental contamination with Toxocara eggs has repeatedly been proposed to be the best indicator of human exposure (Mizgajska, Reference Mizgajska2001; Mizgajska-Wiktor and Uga, Reference Mizgajska-Wiktor, Uga, Holland and Smith2006; Won et al. Reference Won, Kruszon-Moran, Schantz and Jones2008), but few studies have concurrently analysed antibody seropositivity rates and contamination of environmental spaces frequented by humans. Hence, it remains unclear whether this relationship is valid across different geographical and socio-economic settings.
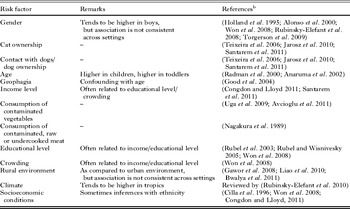
Children, and especially toddlers, are particularly prone to exposure with Toxocara, as they are likely to engage in risky behaviour such as playing in soil, and geophagia. In addition, exposure to Toxocara spp. eggs has been associated with poverty (Rubel et al. Reference Rubel, Zunino, Santillan and Wisnivesky2003; Won et al. Reference Won, Kruszon-Moran, Schantz and Jones2008; Congdon and Lloyd, Reference Congdon and Lloyd2011), poor sanitation (Magnaval et al. Reference Magnaval, Michault, Calon and Charlet1994; Baboolal and Rawlins, Reference Baboolal and Rawlins2002), gender (Alonso et al. Reference Alonso, Bojanich, Chamorro and Gorodner2000; Won et al. Reference Won, Kruszon-Moran, Schantz and Jones2008), ethnicity (Congdon and Lloyd, Reference Congdon and Lloyd2011), infection rates in dogs in the peri-domestic environment (Muradian et al. Reference Muradian, Gennari, Glickman and Pinheiro2005; Jarosz et al. Reference Jarosz, Mizgajska-Wiktor, Kirwan, Konarski, Rychlicki and Wawrzyniak2010) and many other factors (Table 1, see also Rubinsky-Elefant et al. (Reference Rubinsky-Elefant, Hirata, Yamamoto and Ferreira2010) for overview of risk factors). However, reported associations are inconsistent and there is still ambiguity regarding the interpretation of factors driving the onset of antibody positivity to Toxocara.
Risk factors associated with antibody positivity to Toxocara a

a This list does not pretend to be comprehensive, but rather intends to give an illustration of the risk factors which have been associated with Toxocara seropositivity in different settings.
b References given are only a sample among other papers which have dealt with risk associations with Toxocara-specific antibody positivity.
To account for the host–pathogen–environment complexity in HT, a flexible approach is needed, considering different causes of exposure and disease and their interrelations at multiple levels. Rule-based modelling is a technique that can deal with such complexity. It consists of combining a set of rules based on several sources of information, i.e. literature, field data and expert opinion as a starting point, and formulated as hypothesized interactions based on an understanding of system behaviours. The rules are then transformed into computer code to generate simulated data. Comparing the results of the simulation with field data from active surveillance or experimental settings allows fine-tuning of the model, until it provides a useful representation of reality. Agent-based models (ABMs) use this rule-based modelling paradigm. The defining characteristics of agent-based models are agents, the temporal and/or spatial environment, and the rules according to which the agents interact with each other and with their environment. Each individual agent in the framework is treated as a discrete entity, considering the heterogeneity of a population, thereby enabling asynchronous behaviours, as individuals can update their status independently of one another (Bonabeau, Reference Bonabeau1997). The power of this approach lies in the emergence of behaviour that arises from interactions between agents, which would otherwise be impossible to know a priori (Levin, Reference Levin1999).
The objective of the work presented here was to assess the validity of our current understanding on the key processes driving exposure in HT by providing the first conceptual model described so far on toxocariasis. We constructed a basic agent-based model predicting antibody positivity in HT, using seroconversion and seroreversion, and the parameters driving these processes, as its main determinants. We aimed to keep the model simple, with the least possible parameters, and incorporated only ‘universal’ parameters, i.e. parameters that are not context-specific risk factors but have consistently been associated with exposure in HT across different settings. The model was developed for children, the most susceptible population. The results of the simulation were validated against published data from 5 different geographical settings in 4 different countries.
MATERIALS AND METHODS
The following subsections describe the main steps in the development of the agent-based Toxocara antibody prevalence model. First, the selection of published data from different geographical settings is presented. The geographical setting was used as proxy for specific environmental and climatic conditions. Next, the agent-based model is outlined. Finally, the sensitivity analyses used to examine the robustness of the model estimates are described.
Selection of different geographical settings for model validation
In order to validate the Toxocara antibody prevalence model, prevalence estimates in children up to 15 years and empirical data on environmental contamination with Toxocara eggs were obtained from diverse geographical settings, i.e. Argentina, Brazil (2 settings), the Netherlands and Poland (Table 2). The locations were selected following a literature search conducted in January 2011 in the PUBMED and MEDLINE databases using the following keywords simultaneously: ‘Toxocara’ ‘seroprevalence’ ‘environmental contamination’ and ‘epidemiology’. Retrieved records were screened manually to search for countries where both Toxocara antibody prevalence and environmental contamination data were available, as much as possible in the same time period (using ‘year of survey’ as the criterion). All retained studies applied a Toxocara antibody detection method that was assumed to have a reliable sensitivity and specificity: either (i) studies using a commercially available, well-validated and/or widely applied assay, or (ii) studies using an in-house method that applies pre-absorption with other parasite antigens, or equivalent methods, to limit cross-reactivity (Smith et al. Reference Smith, Holland, Taylor, Magnaval, Schantz and Maizels2009; Rubinsky-Elefant et al. Reference Rubinsky-Elefant, Hirata, Yamamoto and Ferreira2010).
Setting-specific climate types, observed Toxocara-specific antibody prevalences and environmental contamination levels

a The characteristics of the climate types can be found in the Supplementary file 2 (Table S1 – in Online version only: climate types). All selected areas had a different Köppen classification. The climate of Resistencia (Argentina) is characterized by moderately mild and dry winters and a hot, humid summer (Köppen type: Cwb). The climate of Parana (Brazil) is characterized by the absence of extreme temperature all year round (Köppen type: Cfa). The climate in Campinas (Brazil) is tropical but mitigated by elevation (Köppen type Cwa), with lower rainfall in winter, dry and mild winters (rarely too cold) and rainy summers with warm to hot temperatures. The maritime climate of the Netherlands has cold winters and warm summers, but temperatures are seldom extreme (Köppen type: Cfb) whereas in Poznan (Poland) large seasonal temperature variance is observed across seasons (Köppen type: Dfb).
Model description
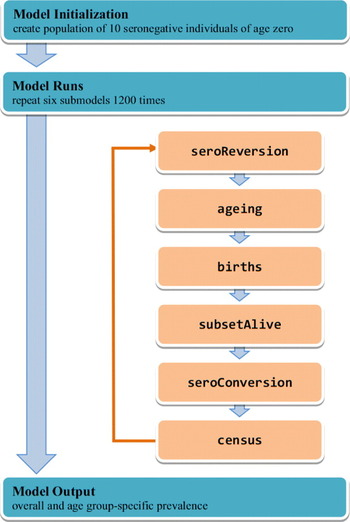
The ensuing model description follows the ODD (overview, design concepts, details) protocol introduced by Grimm et al. (Reference Grimm, Berger, Bastiansen, Eliassen, Ginot, Giske, Goss-Custard, Grand, Heinz, Huse, Huth, Jepsen, Jørgensen, Mooij, Müller, Pe'er, Piou, Railsback, Robbins, Robbins, Rossmanith, Rüger, Strand, Souissi, Stillman, Vabø, Visser and DeAngelis2006) and updated by Grimm et al. (Reference Grimm, Berger, DeAngelis, Polhill, Giske and Railsback2010). The model was implemented in R 2.15.0 (R Development Core Team, 2012) and made available as supplementary material to this manuscript (Supplementary file 1 – in Online version only). A schematic overview of the model is presented in Fig. 1.
Schematic overview of the agent-based Toxocara-specific antibody prevalence model.

Overview of the model
The purpose of the model is to explore whether our current understanding of Toxocara transmission dynamics is sufficient to explain observed Toxocara antibody prevalence rates as a measure of exposure.
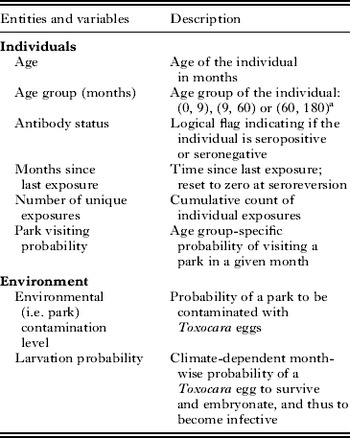
The basic model entities are individual children (up to 15 years old) and the environment in which they live and get exposed to Toxocara. Table 3 gives an overview and description of the state variables of these entities. The temporal resolution of the model is 1 month, and simulations are run for 1200 months (100 years). The model is not spatially explicit.
Agent-based model entities and state variables

a We assumed a higher mean contact probability with Toxocara spp. eggs for children under 5 years (60 months) than for children between 5 and 15 years (180 months); babies up to 9 months of age were assumed to have no soil contact.
The model applies synchronous updating, taking advantage of the data frame concept in R (Petzoldt, Reference Petzoldt2003). During each update (i.e. simulation), 6 processes are scheduled in the following sequence.
1. Seroreversion. Based on the time since last exposure and the number of unique exposures, it is determined whether a seropositive individual returns to a seronegative status or remains seropositive. A detailed description of this process is given in subsection ‘Details of the model’.
2. Ageing. For each individual age increases by 1 month, and the age category of all individuals is subsequently re-assigned.
3. Births. New, seronegative individuals aged 0 months are added to the population; the number of new individuals is randomly drawn from a Poisson distribution with a mean of 5.
4. Subset alive. Individuals of age 180 months (15 years) are removed from the population. The target population of the model is children up to the age of 15 years.
5. Seroconversion. Based on the environmental contamination level (‘envc’), month-wise egg larvation probability (‘month’) and age group-specific contact frequency (‘young’ and ‘old’), antibody-inducing exposures are randomly generated for all individuals older than 9 months (as younger children are not likely to have contact with soil). Seronegative exposed individuals become seropositive, while seropositive exposed individuals remain seropositive. For all exposed individuals, exposure status increases by 1. A more detailed description of this process is given below in subsection ‘Details of the model’.
6. Census. The total and age group-specific number of all individuals and the total and age group-specific number of seropositive individuals are registered. Based on these data, overall and age group-specific antibody prevalences are calculated.
Design concepts of the model
The basic principle of the model is that the prevalence of antibodies in a population emerges from a combination of seroconversion and seroreversion in its constituent individuals. Seroconversion to Toxocara spp. is assumed to depend on a collective, age group-specific probability of visiting a contaminated area (e.g. park or playground) and on an environmental exposure sensed by the individuals (and modelled as the product of the setting-specific park contamination level and the month-wise, climate-dependent larvation rates). Seroreversion is assumed to be an adaptive trait, as immunity strengthens and seroreversion slows down with consecutive exposures (Janeway and Travers, Reference Janeway and Travers1997). Interaction between individuals is not explicitly incorporated in the model.
Stochasticity is assumed for both geographical variables (i.e. environmental contamination levels and larvation probabilities) and for the age group-specific probabilities of visiting a contaminated area. In each model iteration, the individual-level seroconversion is modelled as a random Bernoulli variable, and the onset of seroreversion as a random Poisson variable.
After a burn-in period of 200 iterations, the (overall and age-specific) antibody prevalences observed in the remaining 1000 iterations are stored and used for analysing the model. Because the model is characterized by a Markov process, these values can be considered as samples from the posterior distribution of predicted antibody prevalence. To check for convergence, 2 chains are run and trace plots of the overall antibody prevalences are generated and visually assessed for proper mixing.
Details of the model
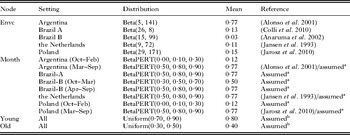
The model is initialized by generating 10 antibody-negative individuals of age 0. No external input data are used in this model. The values for the distributions of the stochastic nodes are presented in Table 4.
Distributions used for the stochastic nodes of the agent-based Toxocara-specific antibody prevalence model

a Assumed based on climate conditions of the context.
b Assumed.
All submodels are presented in the online supplementary material (Supplementary file S1 – in Online version only). In accordance with the basic principle of the model, the two driving submodels of our agent-based model are the individual seroconversion (i.e. acquisition of antibodies as a result of exposure to infective eggs) and the consecutive seroreversion (Fig. 1). Both submodels are described in detail in the following 2 subsections.
Seroconversion
The probability of seroconversion is modelled based on the 3 parameters that have been most consistently related to the probability of HT across different settings, i.e. the age-related probability of being in contact with Toxocara eggs, the environmental contamination with Toxocara spp. eggs and the climate-dependent probability of a Toxocara egg embryonating and becoming infectious. The few studies that have conducted a detailed analysis of Toxocara antibody prevalence in the subgroup below 15 years of age, demonstrated that the prevalence tends to be higher in children less than 5 years old as compared with older children (de Melker et al. Reference de Melker, van der Peet, Berbers, van de Akker, van Knapen, Schellekens and Conyn-van Spaendonck1995; Colli et al. Reference Colli, Rubinsky-Elefant, Paludo, Falavigna, Guilherme, Mattia, Araujo, Ferreira, Previdelli and Falavigna-Guilherme2010; Pinelli et al. Reference Pinelli, Herremans, Harms, Hoek and Kortbeek2011). We therefore assumed a higher mean contact probability for children under 5 than for older children (80% vs 40%), and allowed to range uniformly between 70 and 90%, and 30 and 50%, respectively; babies below 9 months of age were assumed to have no soil contact. Country-specific estimates of environmental contamination with Toxocara eggs were obtained from studies conducted in Argentina (Alonso et al. Reference Alonso, Stein, Chamorro and Bojanich2001), Brazil (Anaruma et al. Reference Anaruma, Chieffi, Correa, Camargo, Silveira, Aranha and Ribeiro2002; Colli et al. Reference Colli, Rubinsky-Elefant, Paludo, Falavigna, Guilherme, Mattia, Araujo, Ferreira, Previdelli and Falavigna-Guilherme2010), the Netherlands (Jansen et al. Reference Jansen, van, Schreurs and van1993) and Poland (Jarosz et al. Reference Jarosz, Mizgajska-Wiktor, Kirwan, Konarski, Rychlicki and Wawrzyniak2010) (Table 2). Based on these estimates, Beta distributions were derived to account for sampling variance (Table 4). The probability of Toxocara egg larvation depends on climate conditions, as the eggs are known to be sensitive to extreme temperatures (either very cold or very hot) (O'Lorcain, Reference O'Lorcain1995) or very arid conditions (Uga et al. Reference Uga, Minami and Nagata1996; Mizgajska, Reference Mizgajska2001; Mizgajska-Wiktor and Uga, Reference Mizgajska-Wiktor, Uga, Holland and Smith2006). The Köppen–Geiger climate classification was used to obtain context-specific climate conditions (Supplementary file S2 – in Online version only, Peel et al. Reference Peel, Finlayson and McMahon2007), based on which context-specific Beta-PERT probability distributions for larvation were derived (Table 4).
Seroreversion
The limited information available on the dynamics of antibody responses in HT pertains to clinical cases and/or adult populations (Altcheh et al. Reference Altcheh, Nallar, Conca, Biancardi and Freilij2003; Lopez et al. Reference Lopez, Martin, Chamorro and Mario2005; Elefant et al. Reference Elefant, Shimizu, Sanchez, Jacob and Ferreira2006), and is therefore not suitable for our purpose. We therefore assumed that, as for most infectious diseases, the strength of the immune response in HT, and thus the longevity of antibodies, will increase with consecutive exposure to Toxocara antigens (Janeway and Travers, Reference Janeway and Travers1997). As a result, seroreversion rates will slow down with consecutive seroconversions. We modelled this dependency as 3 independent scenarios, in increasing order of complexity. In a first scenario, we only included a single short-lasting antibody response in which seroreversion was initiated 3 months after exposure. In a second scenario, the short-lasting primary antibody response was followed by an intermediate antibody response in which seroreversion was initiated 6 months after exposure. The third scenario consisted of a primary short-lasting antibody response (see above), a secondary intermediate antibody response (see above), and a long-lasting antibody response (seroreversion initiated 12 months after exposure) in any consecutive seroconversion. For each scenario, seroreversion following the above-mentioned antibody lifetimes was modelled as a truncated exponential decline, leading to a 100% seroreversion 5 months after the onset of seroreversion.
Sensitivity analyses
For each setting and each scenario, probabilistic global sensitivity analyses were performed to identify the stochastic nodes with the largest influence on the overall within-setting variability. One-way global sensitivity analyses were conducted to visually assess the robustness of the model estimates against changes in the stochastic nodes. In addition, an overall sensitivity analysis was performed, per scenario, to identify the stochastic node that had the largest influence on the between-setting variability.
RESULTS
Comparison of simulated and observed anti-Toxocara antibody prevalence estimates
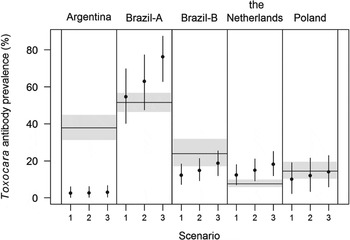
Figure 2 compares the simulated overall Toxocara antibody prevalence estimates with the observed antibody prevalences from Argentina (Alonso et al. Reference Alonso, Bojanich, Chamorro and Gorodner2000), Brazil-A (Colli et al. Reference Colli, Rubinsky-Elefant, Paludo, Falavigna, Guilherme, Mattia, Araujo, Ferreira, Previdelli and Falavigna-Guilherme2010), Brazil-B (Anaruma et al. Reference Anaruma, Chieffi, Correa, Camargo, Silveira, Aranha and Ribeiro2002), the Netherlands (Buijs et al. Reference Buijs, Borsboom, van Gemund, Hazebroek, van Dongen, van and Neijens1994, Reference Buijs, Borsboom, Renting, Hilgersom, van Wieringen, Jansen and Neijens1997; Pinelli et al. Reference Pinelli, Herremans, Harms, Hoek and Kortbeek2011) and Poland (Jarosz et al. Reference Jarosz, Mizgajska-Wiktor, Kirwan, Konarski, Rychlicki and Wawrzyniak2010). The predicted estimates are presented separately for each scenario of seroreversion. With the exception of Argentina, for all geographical settings a good correspondence was observed between predicted and observed data. Convergence of both chains was achieved for each model run.
Prevalence estimates of the agent-based Toxocara antibody prevalence model, compared with observed prevalence estimates. For each scenario of seroreversion (1–3), the mean and 95% credibility interval of the estimated overall prevalence is depicted. For each environmental setting, the observed mean prevalence is depicted as a horizontal line, and its 95% exact confidence interval as a shaded area.

Simulated prevalences did not differ much between the 3 scenarios of seroreversion (see Fig. 2, within settings; all estimates had overlapping credibility intervals). Incorporation of a prolonged duration of antibody longevity improved the model predictions for Poland and Brazil-B while for Brazil-A and the Netherlands the best agreement with observed data was with simulated antibody prevalences of scenario 1.
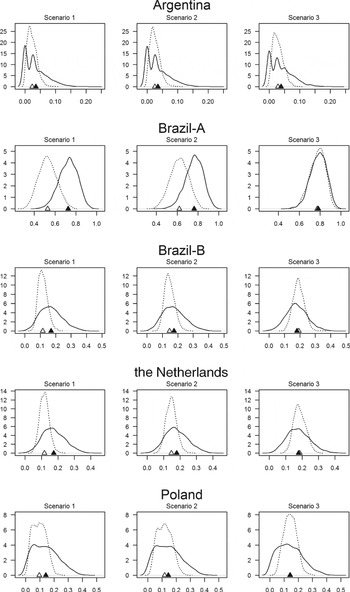
Figure 3 provides density plots and mean values of the estimated prevalences for young children (i.e. 9–60 months), and for older children (i.e. 60–180 months).The 2-fold higher probability of contact that was assigned to younger children had little quantitative impact on the Toxocara antibody prevalence. The mean of the prevalence estimates for young and older children were generally close to each other (Fig. 3). Brazil-A, which has potentially the highest transmission rate (high levels of environmental contamination with parasite eggs and continuous optimal weather conditions), showed a distinct pattern of exposure by age. The age-specific density curves showed limited overlap in scenario 1 and then evolved to 2 fully overlapping curves in scenario 3. This suggests that in high transmission areas, the age-related probability of contact with parasite eggs gains importance in determining Toxocara antibody prevalence (Fig. 3, scenario 1 and scenario 2). However, this effect seemed to disappear when considering the effect of long-lasting acquired immunity (Fig. 3, scenario 3).
Density plots of the age group-specific prevalence estimates of the agent-based Toxocara antibody prevalence model. In each box, the x-axis denotes the antibody prevalence and the y-axis the estimated density. The dotted lines correspond to the ‘young’ age group (i.e. 9–60 months), and the solid lines to the ‘old’ age group (i.e. 60–180 months). The estimated mean prevalence of each age group is depicted by a (white, respectively, black) triangle.

Sensitivity analyses
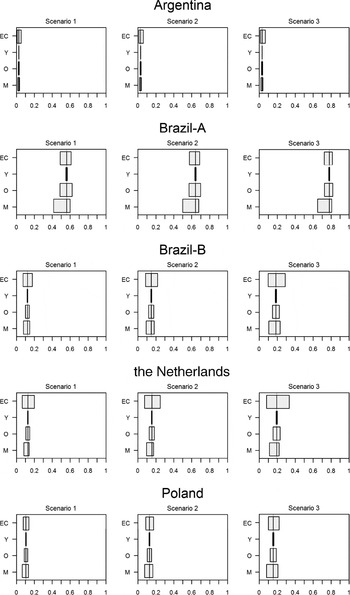
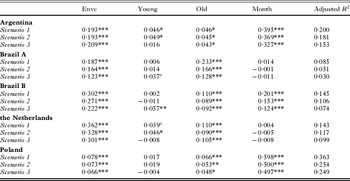
Figure 4 shows the results of the within-setting one-way global sensitivity analyses. The results of the within-setting probabilistic global sensitivity analyses are presented in Table 5. From these results, it becomes evident that the within-setting model results were robust against the uncertainty introduced by the 4 stochastic nodes (i.e. environmental contamination level, the 2 age-related risks of exposure (‘young’ and ‘old’) and month-wise larvation probability). The relative importance of the different nodes differed across settings and scenarios, but the environmental contamination level consistently had a significant contribution to the total variation.
Within-setting one-way global sensitivity analyses. In each box, the x-axis denotes the antibody prevalence and the y-axis the different stochastic nodes.

Standardized regression coefficients from the within-setting probabilistic global sensitivity analyses

***P < 0·001; **P < 0·010; *P < 0·050; °P < 0·100.
Finally, Table 6 presents the results of the between-setting global sensitivity analyses showing that the variation between settings was mainly determined by the probability of environmental contamination (‘envc’). The month-wise probabilities of larvation (‘month’) also contributed significantly to the between-setting variation, albeit at a 10-fold lower level. The age-specific risks of exposure (‘young’ and ‘old’), finally, had a marginal effect, reflecting the fact that same exposure probabilities were used across the different settings.
Standardized regression coefficients from the between-setting probabilistic global sensitivity analyses

***P < 0·001; **P < 0·010; °P < 0·100.
DISCUSSION
Our results demonstrate that the observed Toxocara antibody prevalence data could be simulated by linking the joint probability of 3 parameters: (1) environmental contamination with Toxocara spp. eggs, (2) larvation of these eggs and (3) the age-related contact with these eggs to processes of acquired humoral immunity.
For 4 of the 5 selected geographical settings a good correspondence was observed between predicted and observed data. The low agreement observed with the data from Argentina may have multiple causes. We cannot exclude that a context-specific risk was not accounted for and that the model can thus not be generalized across all settings. Alternatively, the lack of correspondence between model predictions and observed data may also arise from a bias in the data that were incorporated in the model, and not from the model itself. The authors of the Argentinean studies put forward 2 reasons to explain the low levels of soil contamination with Toxocara spp. eggs (Alonso et al. Reference Alonso, Stein, Chamorro and Bojanich2001). First, soil sampling in the study on environmental contamination was limited to bare ground, whereas a study conducted in Argentina showed that dogs preferably defecate in grass (Rubel and Wisnivesky, Reference Rubel and Wisnivesky2005). Second, people from the city where the studies were conducted mostly lived in individual houses with front gardens or backyards, where they leave their domestic dogs to wander freely and defecate within the housing estate or nearby. Therefore, including the sampling of grass and private gardens might have been more appropriate to obtain representative environmental contamination data. This suggests that the actual environmental contamination level in Argentina may be higher than the observed level of 3·4%. Higher soil contamination levels would also agree more with other studies from Argentina (Rubel et al. Reference Rubel, Zunino, Santillan and Wisnivesky2003; Rubel and Wisnivesky, Reference Rubel and Wisnivesky2005; Martin and Demonte, Reference Martin and Demonte2008; Soriano et al. Reference Soriano, Pierangeli, Roccia, Bergagna, Lazzarini, Celescinco, Saiz, Kossman, Contreras, Arias and Basualdo2010), which showed that in some areas up to 78% of the urban recreation areas were contaminated with T. canis eggs (Martin and Demonte, Reference Martin and Demonte2008).
Finally, the methods used to sample, measure and categorize antibody responses differed between the studies, and this may also have influenced the fit between observed and simulated data.
Incorporation of different scenarios of seroreversion allowed us to explore the role of acquired humoral immunity in determining antibody prevalence. Seroreversion scenarios 1 and 2 were based on the general concept of a primary and a secondary immune response, but did not account for variation in response after the first and second exposure to parasite eggs, respectively. Both scenarios inherently assume that all antibody reactions are transient, i.e. fade within approximately 1 year. The fact that in endemic communities many newly infected individuals only develop a transient antibody reaction that disappears within 1 year has been described previously for Taenia solium cysticercosis (Garcia et al. Reference Garcia, Gonzalez, Gilman, Palacios, Jimenez, Rodriguez, Verastegui, Wilkins and Tsang2001). Individuals with transient antibody reactions may have been exposed to parasite eggs but a viable larval infection never established. Alternatively, the infection may have been self-cured at an early stage. In the design of the model, we assumed that such a phenomenon is plausible in toxocariasis, which involves also a larval stage infection in humans. Although evidence in humans is lacking, this is in agreement with the observation that in dogs infected with T. canis, the onset, level and duration of an antibody response is strictly dose related (Glickman and Schantz, Reference Glickman and Schantz1981).
The fit between observed and simulated data varied between the settings, suggesting that a significant amount of variation in antibody prevalence is not explained by the model, and might well be ascribed to context-dependent factors such as, for example, spatial heterogeneity in egg distribution in the environment (Fontanarrosa et al. Reference Fontanarrosa, Vezzani, Basabe and Eiras2006; Rinaldi et al. Reference Rinaldi, Biggeri, Carbone, Musella, Catelan, Veneziano and Cringoli2006) and how this might interact with (variable) human behaviour.
Overall, the outcome of the simulations tells us that in its current form, the model overestimated the Toxocara antibody prevalence in 2 sites (Brazil-A and the Netherlands) whereas it underestimated the antibody prevalence in the 2 other sites (Brazil-B and Poland). A cautious biological interpretation could be that the better correspondence between observed and simulated prevalence estimates with scenario 1 for Brazil-A and the Netherlands, and with scenario 3 for Poland and Brazil-B, could possibly reflect different mechanisms of immunity acting in populations which are continuously exposed because of optimal larvation all year long (Brazil-A and the Netherlands) as compared with populations with intermittent exposure in settings with more varying weather conditions (Poland and Brazil-B). Nevertheless, there is currently insufficient evidence available to support this as the sole explanation, and unconsidered rules (both biological and sociological) may well be at the base of this observation.
It is also important to acknowledge that none of the scenarios of seroreversion considered the existence of lifelong antibody response. It has been suggested that under normal antigen challenges, the serum concentration of an average antibody specificity decreases to 50% of its original steady state concentration within 23 years, meaning that once humoral memory specific for a given pathogen has been established, it could last for a lifetime (Radbruch et al. Reference Radbruch, Muehlinghaus, Luger, Inamine, Smith, Dorner and Hiepe2006). In the current model, individuals are removed from the population after 15 years of age, and the relevance of such a scenario may be questioned. However, it could be interesting to explore this in a model targeting a full population over a lifetime.
The model presented here combines realistic epidemiological and immunological processes, although some assumptions are clearly simplified.
A first limitation is that the different scenarios of the humoral immune response, while generated based on current immunological understanding, could not be constrained by Toxocara-specific data. As mentioned before, little is known about the longevity of Toxocara antibodies. Moreover, we do not know whether the presence of antibodies is associated with protection against re-infection. Studies in dogs suggest that a previous patent infection does not provide protection against re-infection (Fahrion et al. Reference Fahrion, Staebler and Deplazes2008) and this may be the same for the migratory phase of the infection. Additional data on the role of antibodies in the protection against re-infection in toxocariasis, and on the longevity of antibodies upon infection would help to refine the scenarios of seroreversion.
Second, we assumed a constant level of environmental contamination over the total period of simulation, not accounting for possible effects of interventions on the Toxocara antibody prevalence. The relevance of such effects was illustrated in the Netherlands, where adapted guidelines for de-worming and prevention of parasitic infections in pets and zoonotic infections (http://www.esscap.org/) were reflected by a decrease in Toxocara antibody prevalence over the last 12 years (Pinelli et al. Reference Pinelli, Herremans, Harms, Hoek and Kortbeek2011).
Third, the model did not account for temporal dynamics in the association between environmental contamination and Toxocara antibody prevalence. If the natural sequence of events is followed, it can be expected that environmental contamination at a given time point, will be related to antibody prevalence at a later time point. When selecting the surveys for model validation, the difference in time between serological and environmental contamination surveys was kept limited based on the rationale that: (1) this would reduce the occurrence of confounding effects over time and (2) there is currently no information available about which time interval to consider. The agreement between observed and simulated data seems, however, to point to a limited effect of temporal dynamics or, alternatively, may reflect the establishment of endemic stability in the population.
Finally, there are limitations in the epidemiological data that were available to inform model parameters (i.e. most data were derived from single studies), which makes it more difficult to assess the validity of the model. Whilst it is not possible to determine whether the assumptions underlying the model truly represent the processes generating the observed data, the good fit between the observed and simulated data in nearly all settings suggests that the hypothesis that environmental contamination largely drives the exposure levels is plausible (Mizgajska-Wiktor and Uga, Reference Mizgajska-Wiktor, Uga, Holland and Smith2006). However, we cannot preclude that an alternative model could generate similar data and may predict observed patterns more exactly.
The strength of this model is that, based on a few simple rules, it can reproduce relatively well observed Toxocara antibody prevalence data. By validating our data across different settings we sought to develop a solid model to explore the dynamics of transmission of toxocariasis, as well as the possible impact of interventions against the disease. Although the differences between observed and simulated data illustrate that other parameters, which were not included in the model, may also play a role in determining antibody prevalence in HT, a basic model as currently presented can be useful for these purposes. As more data become available, the applied set of rules can be easily extended, in an iterative process. We believe that such a stepwise approach can significantly improve our understanding of the transmission dynamics and control of toxocariasis.
FINANCIAL SUPPORT
Kirezi Kanobana is supported by the Framework agreement programme between the Institute of Tropical Medicine, Antwerp and the Directorate General of the Belgian Development Cooperation. Brecht Devleeschauwer is supported by a BOF (Bijzonder Onderzoeksfonds) grant of Ghent University.