

I. Introduction
Cider is an ancient drink with references back to at least Roman times (Watson, Reference Watson2013), and is currently enjoying a revival in the USA. Sales and production of cider have shown significant increases from 2007 to 2014. Production of bottled cider, on which taxes were paid, was approximately 6 million gallons in 2007, and by 2014 this had risen to over 53 million gallons (ATTTB, various years). Much of the growth in the cider industry has been in the bulk product segment of the market. This segment includes brands such as Angry Orchard, Woodchuck, and Strongbow, currently accounting for 90% of cider sales (Keri, Reference Keri2015). The remaining 10% of cider sales is spread across approximately 400 cideries, many producing small quantities of “craft” cider.
Given the small but growing nature of the current industry, consumer knowledge of cider and their preferences for sensory characteristics, including taste, is limited. Another factor that is challenging to consumers is the sheer number of ciders available in the market place, either from retail outlets or online markets. As with all beverages, consumers vary in their preferences and it may be difficult for them to decide upon a cider. It would be useful for cider makers to understand which cider characteristics drive consumer preference, and using this information, cider makers could decide what style or taste profile to produce. As noted by several authors there are as many ciders as there are cider makers (Jolicoeur, Reference Jolicoeur2013; Watson, Reference Watson2013). Given that there are no well-defined standards to categorize cider styles, such as there are for wines, consumers are faced with a difficult task of making a cider purchase based on inconsistent information on the product label.
Cider, like wine, has many intrinsic characteristics that contribute to the taste profile including bitterness, astringency, sweetness, and acidity (Jolicoeur, Reference Jolicoeur2013). These characteristics manifest themselves to the consumer through the taste, aroma, “body”, dryness, or bitterness of the cider. Wine and cider are both “experience” goods, in that the consumer cannot gain any utility from the product until it is consumed (e.g., Ashton, Reference Ashton2014). Because of this, if a consumer has a bad sensory experience with a product, their repeat purchase of the product, either the same brand or the same product, may be affected by this experience (Grunert, Reference Grunert2002).
There are two common approaches to estimate consumer valuation for product characteristics: hedonic price analysis using market data and willingness to pay (WTP) estimation using either a stated preference technique or economic experiment. Hedonic price analysis has been used many times to estimate the market value of specific product characteristics. Examples of hedonic price analysis in the wine industry are numerous and include Cardebat and Figuet (Reference Cardebat and Figuet2004), Lecocq and Visser (Reference Lecocq and Visser2006), and Oczkowski and Doucouliagos (Reference Oczkowski and Doucouliagos2014). Also, Capehart (Reference Capehart2015) utilized hedonic price analysis to study the pricing of characteristics of bottled water. However, the relationship between price and quality has been questioned by several researchers (Goldstein et al., Reference Goldstein, Almenberg, Dreber, Emerson, Herschkowitsch and Katz2008; Ashton, Reference Ashton2014). Rather than using revealed prices as a method of analysis, as in hedonic price analysis, WTP analysis asks consumers if they are willing to pay a specific price for a product with certain attributes, including sensory and or physical attributes that may enhance consumption or utility. Willingness-to-pay analysis has been utilized in estimating the value consumers place on certain sensory attributes in wine (Holmquist et al., Reference Holmquist, McCluskey and Ross2011; Yang et al., Reference Yang, McCluskey and Ross2009). As noted earlier, the cider industry is relatively small and diverse, and as far as could be determined, no sensory evaluation of ciders and consumer preference valuation of cider sensory properties has been reported previously. Didier et al. (Reference Didier, Symoneaux, Schlich, Sybiril, Droger, Baudin, Gilles, Sanoner, Lequéré, Simon, Raimbaud, Dechatre, Lepage, Simard, Desvignes and Legendre2012) showed that consumers differed in their preference for characteristics of cider, but did not value individual ciders or characteristics of these ciders.
Blind taste testing, as described in Ashton (Reference Ashton2014) and Olkin et al. (Reference Olkin, Lou, Stokes and Cao2015) amongst others, is the preferred method to elicit consumer preferences that are not biased by extrinsic factors, such as labels, price or other marketing related materials. However, blind testing is still somewhat subjective as each tester brings to the test their own preferences and tastes, and their own physiological makeup, i.e., how their nose and tongue sense various attributes (Lawless and Heymann, Reference Lawless and Heymann2010).
In this research, we used an untrained consumer panel for blind tasting of four commercially available craft ciders from the U.S. Pacific Northwest region to estimate consumer preferences for particular characteristics of ciders, and how consumers rank and price these characteristics. A secondary part of the analysis using analytical methods was to measure how well the cider characteristics – tannin, residual sugar, acidity, and acid levels – of the four ciders explain consumer WTP in comparison to how well the consumers’ responses to sensory questions explain their WTP. In the context of the current research, subjects were provided with a definition of craft cider. The definition was not complete, but included terms such as orchard or farm-based, small-scale independent producers, and cider made with local cider apple juice, containing natural colors, flavors and aromas.
The results from this research can be useful to craft cider makers to aid them in understanding the levels of cider characteristics that consumers prefer and value. Secondly, the use of analytical measurements for cider valuation through a WTP framework has not been empirically tested, and we will assess whether this approach is valid in some research scenarios.
II. Model
A double-bounded (DB) dichotomous choice contingent valuation (CV) model was utilized to estimate the WTP for cider attributes (Hanemann et al., Reference Hanemann, Loomis and Kanninen1991). In the DB model, participants are presented with a set of sequential “price bids” with the price increasing or decreasing depending on the response to previous bids. This sequence of bids places upper and or lower bounds on the true WTP for a particular consumer. The bounds partition the WTP into four intervals based on the response to bids. To initiate the process, a participant is offered an initial bid price, B 0 , if the reaction to this initial bid is negative (no), the participant is offered a second discounted bid, B D , if the response to the second bid is also no (no, no), then the respondent's WTP is bounded by the interval (0, B D ). If the second lower bid is accepted (no, yes), then the WTP has a lower bound of B D and an upper bound of B 0 , i.e., B D ≤ WTP < B 0 . A positive response to the initial bid (yes), B 0 , leads to a second higher bid, B H , if the participant rejects this second higher bid (yes, no), the WTP for that respondent is bounded by B 0 and B H . Accepting B H (yes, yes) indicates the participant's WTP is bounded below by B H . Formally, the partitioned space for WTP for individual i is given as:
 $${Y_i}\, = \,\left\{ \matrix{1\,if\,WT{P_i}\, < \,{B_D} \hfill \cr 2\,if\,{B_D} \le \,WT{P_i}\, < \,{B_0} \hfill \cr 3\,if\,{B_0} \le \,WT{P_i}\, < \,{B_H} \hfill \cr 4\,if\,WT{P_i}\, \ge \,{B_H} \hfill} \right.$$
Now Y i , the bid function for each individual is a function of the ultimate or last bid for the consumer (B i ) and a vector of explanatory variables (z i ) including socio-demographics – age, gender, education, cider and other alcoholic drink consumption, and other factors, as well as attributes of the product, such as sweetness, bitterness, or dryness. The WTP bid function for an individual, i, based on sensory evaluation is as follows:
 $$WTP_i \, = \,\alpha \, - \rho B_i \, + \,\lambda ^{\prime}z_i \, + \,\varepsilon _i $$
where α, ρ, and λ are parameters to be estimated and ɛ i is an error term with mean 0 and variance σ 2 of a cumulative logistic distribution. The bid function for the objective evaluation is similar except that the vector z i is replaced by a vector of objective measurements (ζ i) rather than the sensory evaluation and demographic information.
The DB dichotomous choice CV model used in this research is well-documented in Hanemann et al. (Reference Hanemann, Loomis and Kanninen1991) and Lopez-Feldman (Reference Lopez-Feldman2012), and the analysis used in this research does not deviate from the standard model in those publications. The WTP model was estimated using the “doubleb” macro in STATA (Lopez-Feldman, Reference Lopez-Feldman2012). The “doubleb” macro is designed for CV dichotomous questions with follow-up or double bounded questions as in this research. The “doubleb” method has been used in research to elicit the WTP of nuclear power in China (Sun and Zhu, Reference Sun and Zhu2014) and smart-home function in Europe (Rihar et al., Reference Rihar, Hrovatin and Zoric2015). Different to previous methods of determining WTP, the “doubleb” model directly estimates the marginal values for each variable then estimates the WTP from these mean values (Lopez-Feldman, Reference Lopez-Feldman2012). The mean WTP is calculated as − (α ̂ + z̄λ̂)/ρ̂ as shown in Grimsrud et al. (Reference Grimsrud, McCluskey, Loureiro and Wahl2004).
III. Data and Experimental Method
A. Sensory Evaluation
Sensory evaluation data were collected from an experiment conducted at the Washington State University School of Food Science Sensory Evaluation Laboratory in February 2015. An untrained panel of 109 subjects was recruited with a small non-monetary compensation; each subject tasted four commercially available “craft” ciders in a blind taste test for a total of 436 tastings. All participants were over 21 years of age and signed an informed consent form as required by the institutional review board's approval for human subject experimental protocol. Due to the lack of standards in regards to labeling of ciders, four ciders were selected based on recommendations from independent cider industry experts and the researchers. The trial design was such that there were two ciders considered “dry” and two “semi-sweet”.
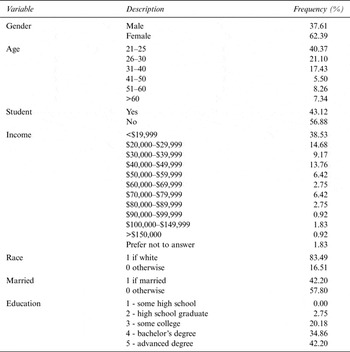
At the beginning of the sensory evaluation panel, samplers were asked a series of demographic questions covering gender, age, income, race, marital status, education, drinking habits, and preferences for cider, beer and wine. Table 1 summarizes the demographic characteristics of the sample. Females made up a large proportion of the sample (62.4%), which is not a “true” representation of the population in general, but may be a reflection of the cider drinking population. The average age of the sample group was 32, and median age was approximately 28 years old, which may be an indication of the college setting for the study; however, only 43% of the sample were students. Income ranged from less than $20,000 to greater than $151,000, but a large proportion of the panel earned incomes less than $30,000. No mean income was reported as subjects were asked to designate an income range, rather than a specific value. This was done to reduce potential under-reporting of income. Most of the sample panel identified as Caucasian, less than half were married, and a majority held at least a bachelor's degree.
Definitions and Summary Statistics of the Demographic Variables from Sensory Panel Survey (n = 109)

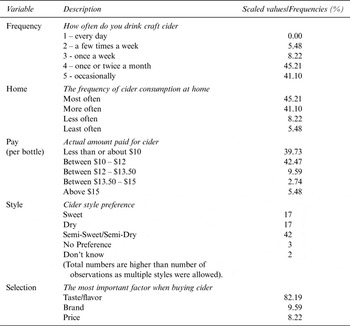
Cider drinking preferences are summarized in Table 2. Of the 109 subjects, 73 indicated they had previously consumed craft cider, 92 drank wine, and 82 drank beer. A majority of the sample that drank cider did not drink it more frequently than once or twice per month, and preferred to drink cider at home. Most samplers who indicated they were cider drinkers identified their cider preference in the semi-sweet/semi-dry range which may be an indication of the lack of standard styles of cider or consumers not knowing how to clearly define cider preferences. Subjects' responses showed that the actual price paid for craft cider was typically less than $12 per 750 mL bottle equivalent, and that taste or flavor rather than price determined their purchase decision.
Cider Consumption and Preferences (n = 73)

Prior to the trial, the sample ciders were purchased directly from each cider maker in glass bottles (either 500 mL or 750 mL bottles) with one of two types of stoppers, champagne-style corks or standard steel beer bottle crown caps. Cost for each cider was $10, $19, $15, and $10.50 per 750 mL bottle equivalent, for Cider 1, 2, 3, and 4, respectively. The cider was kept refrigerated prior to serving and only one bottle of each cider was open at any one time during the sampling phase. During the sampling phase, all ciders were kept in ice-baths to maintain serving temperature at approximately 5 °C. Each sampler received all four cider samples, with cider samples presented in a random serving order, one sample at a time. Each sample consisted of 25 mL of cider served in an International Standards Organization/Institut National des Appellations d'Origine (ISO/INAO) tulip-shaped wine tasting glasses (250 mL) covered with a petri dish. Each sample was coded with a unique three-digit code. Subjects were instructed to cleanse their palates between samples with a bite of cracker and deionized filtered water and wait at least 45 seconds between samples.
After each cider sample was evaluated, samplers were asked to score the appropriate sensory attribute for the sample on a 9-point scale. The categorical dislike/like scale was anchored by extremely dislike (1) and extremely like (9) with a midpoint of neither like nor dislike (5). The sensory attributes scored were, in order: 1) appearance; 2) aroma; 3) sweetness; 4) bitterness; and 5) flavor or taste. A final question in the sensory evaluation was for the sampler to rate how well they disliked/liked the sample overall.
The final step in the individual cider sensory evaluation was to ask each sampler how much they would be willing to pay to purchase a 750 mL bottle of the cider just evaluated. Each sampler was offered an initial bid of $13.50 per bottle. The value of $13.50 was the average price for a 750 mL bottle equivalent of craft cider available for purchase on-line in the Pacific Northwest, using the Northwest Cider Association's (NWCA) website for cider makers in the region (NWCA, 2015). If the sampler rejected the initial bid, a lower price of $12.50 was offered. Similarly, if the sampler accepted the initial bid, they were offered a higher bid of $14.50.
B. Chemical Analysis of Cider
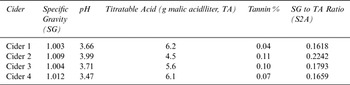
Chemical analysis of one bottle of each of the four ciders was undertaken using protocols developed for evaluation of apple juice and cider (Miles and King, Reference Miles and King2014; Miles et al., Reference Miles, Zimmerman, Scheenstra, King and Moulton2015). A single bottle of each cider was analyzed at the Washington State University Northwestern Washington Research and Extension Center in Mount Vernon, WA. Values for cider pH, specific gravity (SG), titratable acid (TA), and percent tannins were collected and presented in Table 3. The specific gravity to acid ratio (SP2A) was included post evaluation as a means of capturing the “balance” of sugar to acid as is undertaken in the International Riesling Foundation's taste profile protocol (IRF, 2008). Specific gravity is used as a measure of sugar content as it is the simplest measure of sugar content that is not confounded by other factors such as a refractometer measurement error (Jolicoeur, Reference Jolicoeur2013).
Chemical Analysis of the Four Sample Ciders

IV. Results and Discussion
A. Sensory Evaluation
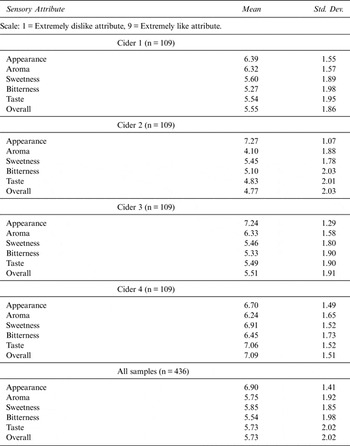
The mean sensory attribute scores for each cider, and over all ciders, are presented in Table 4. Scores for sensory attributes across all ciders were, in general in the neutral (5) to slightly liking or positive range of 6 or 7. Cider 2 tended to be scored in the neutral to slightly negative range for each individual attribute, and based on the comments of samplers, this cider may have possessed off-flavors. From Table 4, we can see that Cider 4 was ranked highest based on the mean overall liking score (7.04), followed by Ciders 1 (5.56), 3 (5.51) and 2 (4.77). A paired t-test for each cider pair using the overall scores showed that Cider 4 had a statistically higher score than the other three ciders. Cider 2's overall liking score was significantly lower than Ciders 1 and 3, and there was no significant difference in the overall liking for Ciders 1 and 3.
Summary Statistics for Sensory Attributes for Each Cider Sample

After the final sample cider was tested, each sampler that had responded “no” to the question – “Whether they drink craft cider” – was asked if their experience with the ciders tested had changed their drink preference, and if they would now consider cider a potential alternative drink. Of the 36 samplers who responded “no”, 20 (or 55%) indicated that they would now consider craft cider as an alternative to beer or wine. A further seven (13%) said that after sampling, they would not change their drink preference, three (5%) indicated that they would not consider cider as an alternative to beer or wine, and four (7%) samplers indicated they would drink less cider (2 samplers had invalid responses to the question and were not included in the analysis).
B. Response to Bids
The participants' responses to higher WTP bidding process was as expected; as the bid price increased, the number of bids rejected increased, i.e., as price increased, respondents increasingly said that they would not buy the cider at the increased price. At the initial bid of $13.50, 349 of 436 bids were rejected. Of the 349 rejected bids, 51 of these respondents accepted the follow-up lower bid at $12.50 leaving a further 298 bids with WTP below $12.50 per bottle. Forty three of the 87 respondents who accepted the initial bids rejected the follow-up higher price of $14.50, with 44 remaining bids with a WTP exceeding $14.50 per bottle.
The responses to bids, particularly the number of bids rejected at the lower end of the bid range could indicate several factors. The straightforward interpretation is that the bids offered were simply too high in relation to the value consumers place on craft cider in the region. However, we suspect that consumers may be comparing the bid to the prices of mass produced ciders being offered at a grocery store. Thus, the samplers may have a reference price in mind for cider, based on prices for non-craft ciders which are typically less than $3.00 per 750 mL equivalent. As consumers are increasingly exposed to craft ciders, they can develop a taste for the product and increase their WTP. A factor could be how consumers define craft cider, in that some consumers may define craft cider, as a cider that is not produced by a major cider maker, such as Angry Orchard, Woodchuck or one of the large European makers such as Strongbow, and others may define craft cider as small lot, farm made or “artisanal” ciders. Depending on the definition of cider by the consumer, prices will differ, as some relatively large regional producers have prices in the range of $5 to $10 per 750 mL equivalent, whereas the smaller cider makers charge between $12 and $19 per 750 mL equivalent (NWCA, 2015). The latter range was used as the basis for bid development in the research reported here as this reflects the price range of ciders included in this study.
C. Impact of Demographic and Sensory Variables on Willingness to Pay
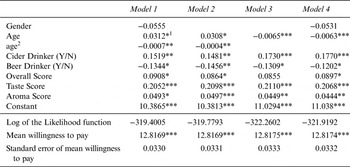
The estimated parameters of models based on equation 2 are presented in Table 5. Four models are presented in this table, with differences in the number of demographic variables, particularly gender, age, and the square of age (age2). Age and income were positively correlated at over 70%; and for this reason, to reduce the impact of multicollinearity on model parameters, income is not included in the final model. But the implication from this correlation is that we would expect WTP to increase with income, if we assume cider is a normal good. In two of the four models, we include both age and age2 to allow for nonlinear effects of age. One might expect for age to have a positive effect and age2 to have a negative effect, which is consistent with the signs of the parameters in the first two models. However, when age2 is included, age is not statistically significant. The age effect on mean WTP increases until a turning point is reached at 34.4 years of age. This indicates that younger drinkers are willing to pay more for cider, but WTP diminishes and then declines as the age of the drinker reaches the maximum point. If cider is a relatively new product to the taster, the older taster may be more set in his/her ways. In the models that do not include the age2 variable, the variable age has a negative coefficient, indicating that as age increases, mean WTP decreases. This is consistent with theory that old habits are hard to change and experienced consumers are less open to new tastes. Model 1 shows that gender does not affect mean WTP, which is interesting given that females composed a substantial majority of the sensory panel. Other demographic variables, such as marital status and education level were not statistically significant in preliminary analyses and were therefore not included in the final models. Also, given that there is no statistical difference between models 1 and 2, model 2 was used for comparative testing due to consistency with economic theory and statistical significance of all variables.
Willingness to pay Models Based on Sensory Evaluations

1 ***, **, * significantly different from zero at P < 0.01, 0.05, and 0.10, respectively.
Drinking habits included in the final mean WTP model were the binary variables, BeerYN and CiderYN, which indicate whether the respondent did or did not drink beer and or cider. If the respondent was a cider drinker mean WTP increased by $0.15 per bottle, and if the respondent answered yes to drinking beer there was a discount of $0.15 per bottle in WTP.
Three sensory attributes were included in the model – overall liking, taste/flavor, and aroma; other sensory variables such as sweetness, bitterness, or appearance did not significantly affect mean WTP, and were thus excluded. All attributes contributed positively to WTP, with taste increasing WTP by $0.21 per bottle per unit of increase in taste score, aroma increased mean WTP by $0.05 per bottle per unit, and overall liking added $0.09 per bottle per unit.
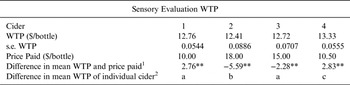
Based on the demographic and sensory variables included in the model, the estimated mean WTP was $12.82 per 750 mL bottle. This value falls below the average price of cider in the region as noted earlier and was in the lower end of the bid range. Individual cider WTP models were also estimated, and the mean WTP for each was $12.76, $12.41, $12.72 and $13.33 for Ciders 1, 2, 3, and 4, respectively. The mean WTP rankings are identical to those for the overall liking scale; and similar to the overall liking scores, pairwise t-tests of the mean WTP showed that with the exception of the mean WTP to pay for Ciders 1 and 3, there were statistically significant differences in mean WTP between all ciders. Cider 4's mean WTP was significantly higher than for the other ciders and the mean WTP for Cider 2 was significantly lower than for the other ciders, perhaps due to off-flavors as noted above.
Estimated mean WTP for each cider, compared to the price paid was significantly different for three of the four ciders (Table 6). The actual price paid for Cider 1 was not different to the WTP; however the mean WTP for Ciders 2 and 3 was significantly less than the price paid (P < 0.001), but the mean WTP for Cider 4 was $1.84 higher than the price paid (P < 0.001).
Mean Willingness to Pay (WTP) for Individual Ciders Compared to Price Actually Paid for 750 mL Equivalent Bottle

1 **significantly different from actual price paid at P < 0.05, except for ciders 2 and 3 that differ at P < 0.1.
2 Columns with different letters indicate that the individual cider WTP differs significantly at P < 0.01.
D. Willingness-to-pay Model with Objective Measurement
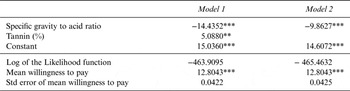
Two models were estimated to assess the explanatory power of analytical measurements in estimating WTP and compare the results to the estimation with sensory analysis variables. Table 7 summarizes the two estimated models. Variables included in these models were tannin percentage and SP2A; cider pH and SG were not included as they did not significantly affect mean WTP; and TA was not included as it was highly correlated to SP2A. Models 1 and 2 differ significantly at P < 0.05, and therefore model 1 was selected as the basis for the final WTP analysis using analytical measurements. The negative SP2A coefficient indicated that as the sweetness of a cider increases, assuming TA level was held constant, WTP declines. The SP2A ratio is also a measure of “dryness” of a cider, and a larger value indicates a cider that has a lower level of “dryness” (Watson, Reference Watson2013). The mean WTP estimated using objective measurements was $12.80 per 750 mL bottle equivalent, which does not differ significantly from the mean WTP based on sensory evaluation.
Willingness to Pay Models Based on Chemical Analysis

1 ***, ** significantly different from zero at P < 0.01, and 0.05, respectively.
Measures of goodness of fit for the models are compared using the fully correctly classified cases (FCCC) method (Kanninen and Khawaja, Reference Kanninen and Khawaja1995). This measure calculates the percentages of respondents that the models correctly classified into the appropriate group based on responses to the first and second bids (yes/yes, yes/no, no/yes, and no/no). A higher value of percentage of correct prediction indicates better model fit, and one should note that pure chance results in 25% correct predictions, since there are four categories. The correct predictions in our models are 46.3% for the sensory analysis model and 26.3% for the analytical version of the model. The FCCC percentage value for the sensory analysis model compares favorably to other studies. For example, Kanninen and Khawaja (Reference Kanninen and Khawaja1995) in studying WTP for water supply reliability correctly predicted the WTP categories for 35% of observations. The WTP from the analytical model shows the limited variation within the model due to a small number of variables affecting the mean WTP.
V. Conclusions
The objectives in this research were to identify the characteristics of craft cider that consumers prefer and value, and to develop a framework for objective analysis of cider and the determination of consumer WTP utilizing this framework. Variables that affect the WTP for cider include age, whether the sampler is a cider or beer drinker, and the sensory attributes of overall liking, taste/flavor, and aroma. From the objective analysis of the sample ciders it is estimated that WTP is affected by tannin percentage, and the ratio of specific gravity to titratable acid of the ciders.
A finding that should be of particular interest to industry is that one of the key factors determining WTP is overall liking of the cider, flavor and aroma, while sweetness and bitterness do not affect WTP. This may indicate that drinkers are willing to pay for a product that provides a complete package of sensory experience, rather than individual components of the sensory experience. However, the lack of WTP for sweetness or bitterness may be due to several reasons. Firstly, it may be that consumer tastes are heterogeneous, so that if a subject prefers sweet, then they are WTP for sweet; but in the overall estimation, the sweet effect may be cancelled out by subjects who like dry. On the other hand given that the panel was untrained, subjects may not have the sensory “skill” to identify the sensory differences between sweetness and bitterness in the ciders presented. Also as noted, a majority of samplers who had not previously consumed craft apple cider, indicated they would now consider craft cider as an alternative alcoholic drink to beer and wine. This could indicate to the craft industry that to increase consumption of craft cider, cider makers need to raise awareness of their product to the non-craft cider drinking population.
As this research is one of the first to attempt to derive consumer preferences for craft cider characteristics the opportunities for further research are numerous. Further comparison of the objective and subjective measurement of cider characteristics could aid industry in determining if cheaper objective evaluations could be a proxy for subjective testing, which is relatively more expensive to undertake. In this study, we used only four ciders and the objective evaluation was based on one sample from each of these four ciders, thus replicating the objective measurements with different bottles of the same cider could also aid in identifying the consistency within a product, as consistency of experience is important to consumers (Grunert, Reference Grunert2002). This type of testing could also determine if characteristics, such as the off-flavors identified in one of the test ciders carried through into a whole batch, thus reducing the consumer experience. Any reduction in the consumer experience, either from an individual cider or from cider in general, could slow the growth in the industry to the detriment of all cider makers and cider apple growers.