Introduction
The aviation environment exposes aircrew members to rapidly changing ambient pressures. Otic barotrauma suffered during air travel is defined as an acute or chronic traumatic inflammation of the middle ear caused by a pressure difference between the air in the middle ear and the surrounding environment.Reference Mirza and Richardson1 Barotrauma is the most prevalent medical problem associated with airplane travel and has been a causal factor in aviation accident.Reference Lewis2 Aircrew members must be able to equilibrate the pressure on both sides of the tympanic membrane; this is possible only with normal tubal function. Failure to equalise pressure across the tympanic membrane may result in otic barotrauma.Reference Ashton and Watson3–Reference King5 Difficulty with clearing the ears during flight is a common cause of temporary or even permanent grounding of aircrew.
Ascent to high altitude usually offers no trouble because the gas in the middle-ear cavity expands and escapes along the eustachian tube into the nasopharynx, so that the pressure remains equal on both sides of the tympanic membrane.Reference Enders and Lopez6, Reference Lundgren and Malm7 During ascent, at a pressure differential of about 15 mmHg, the eustachian tube passively opens and vents off the positive pressure. This process of passive venting is rarely a problem on ascent and occurs at about every 122 metres (400 feet) of increasing altitudes.Reference Brown8 During descent, the eustachian tube needs to be opened actively to equilibrate the pressure; if this fails to occur, barotrauma develops.
The finding of normal resting middle-ear pressure in regular tympanometry does not necessarily indicate normal eustachian tube function, but the finding of negative middle-ear pressure is presumptive evidence of eustachian tube dysfunction.Reference Blustone, Klein, Blustone and Klein9 There is some controversy and a lack of consensus regarding the middle-ear pressure range to be used as an indication that an individual is fit for flying. In 1970, Jerger postulated that negative middle-ear pressure exceeding −100 mmH2O should be considered as pathological.Reference Jerger10 The nine-step inflation/deflation test has also been used as a predictor of middle-ear barotrauma (in scuba divers) and the test was shown to be reliable.Reference Uzun, Adali, Tas, Koten, Karasalihoglu and Devren11
The current practice of eustachian tube function assessment, which involves checking resting middle-ear pressure only, is likely to have resulted in an increase in grounding time for many aircrew members and/or exposed them to unnecessary risk. This study aimed to explore the value of the nine-step test and resting middle-ear pressure range as predictors of barotrauma in order to set guidelines by which to determine whether aircrew members are fit for flying.
Materials and methods
A prospective, non-randomised study was conducted on 100 aircrew members who presented to the ENT clinic at Saudi Airlines Medical Services from March 2010 to March 2013 for assessment of their fitness before flight. All subjects were subjected to a thorough ENT examination (with clearing of wax or secretions from the external canal) and middle-ear pressure assessment using a tympanometer, GSI Tympstar version 2 (Grason-Stadler, Eden Prairie, Minnesota, USA). Resting middle-ear pressure was measured, and post-inflation and post-deflation tests were carried out.
Exclusion criteria included: resting middle-ear pressure outside the range of −100 and +100 mmH2O; chronic suppurative or secretory otitis media; the presence of ventilation tubes, a scarred tympanic membrane or tympanosclerotic patches; and evidence of sinonasal polyposis or nasal masses.
The nine-step inflation/deflation tympanometric test, developed by Bluestone in 1975,Reference Bluestone and Jerger12 was performed in the manner described by Bluestone and Cantekin,Reference Bluestone and Cantekin13 as follows. (1) The tympanogram records resting middle-ear pressure. (2) Ear canal pressure is increased to +200 mmH2O with medial deflection of the tympanic membrane and a corresponding increase in middle-ear pressure. The subject swallows to equilibrate middle-ear over-pressure. (3) While the subject refrains from swallowing, ear canal pressure is returned to normal, thus establishing a slightly negative middle-ear pressure (as the tympanic membrane moves outward). The tympanogram documents the established middle-ear under-pressure (post-inflation) measurement. (4) The subject swallows in an attempt to equilibrate negative middle-ear pressure. If equilibration is successful, airflow is from the nasopharynx to the middle ear. (5) The tympanogram records the extent of equilibration. (6) Ear canal pressure is decreased to −200 mmH2O, causing a lateral deflection of the tympanic membrane and a corresponding decrease in middle-ear pressure. The subject swallows to equilibrate negative middle-ear pressure; airflow is from the nasopharynx to the middle ear. (7) The subject refrains from swallowing while the external ear canal pressure returns to normal, thus establishing a slightly positive pressure in the middle ear as the tympanic membrane moves medially. The tympanogram records the over-pressure established (post-deflation). (8) The subject swallows to reduce over-pressure. If equilibration is successful, airflow is from the middle ear to the nasopharynx. (9) The final tympanogram documents the extent of equilibration.
Failure to alter the middle-ear pressure at least 10 daPa with swallowing during steps 3, 5, 7 or 9 of the inflation/deflation tympanometric test was considered indicative of eustachian tube dysfunction (tubal function was poor) as reported by Fernau et al.Reference Fernau, Hirsch, Derkay, Ramasastry and Schaefer14 In this study, the resting middle-ear pressure measurement was obtained from the tympanogram recorded in the first step, the post-inflation tympanometry measurement was taken from the third step tympanogram and the post-deflation tympanometry measurement was from the seventh step tympanogram. Subjects who did not pass either the post-inflation or post-deflation parts of the test were considered to have poor nine-step test results (they failed the nine-step test); subjects who passed both test parts were considered to have good nine-step test results.
Subjects were allocated to two groups according to tympanometry findings: group A comprised subjects with resting middle-ear pressure outside the range of ±25 and not exceeding ±100 mmH2O; and group B consisted of subjects with resting middle-ear pressure between −25 and +25 mmH2O. In every aircrew member, only the ear with the worst (more negative or more positive) resting pressure result of both ears was included. The rationale behind choosing this criterion for classification was based on: the report by Ghosh and Kumar,Reference Ghosh and Kumar15 which stated that resting middle-ear pressure between −25 and +25 mmH2O indicated fitness for flying; and reports by other authors who consider −100 to +100 mmH2O as the normal range for resting middle-ear pressure.
The subsequent flights of all participating aircrew members were similar in terms of maximum altitude (approximately 25 000 to 30 000 feet (7.62 to 9.14 km)) and rate of descent. The outward-bound flight and return flight took place on the same day for all subjects. All aircrew members were seen on the day of the return flight or on the next day at the latest.
All subjects were assessed (after the return flight) regarding the presence and grade of barotrauma according to Teed's classification, as follows.Reference Teed16 Grade 0 is indicative of a normal otoscopic picture, but with symptoms. Grade 1 is representative of retraction with redness in Shrapnell's membrane and along the manubrium. Grade 2 is indicative of retraction with redness of the entire ear drum. Grade 3 is the same as grade 2 plus evidence of fluid in the tympanum or haemotympanum. Finally, grade 4 is representative of perforation of the ear drum. The otologist who examined the aircrew members for barotrauma was blinded as to whether each subject was in group A or group B.
Statistical analysis
All statistical calculations were carried out using Microsoft Excel version 7 (Microsoft, New York, USA) and the Statistical Package for the Social Sciences software (SPSS, Chicago, Illinois, USA).
Results
This study was conducted on 100 aircrew members divided into two groups: group A had resting middle-ear pressure outside the range of ±25 and not exceeding ±100 mmH2O and group B had resting middle-ear pressure between −25 and +25 mmH2O. Group A included 50 subjects (23 cockpit and 27 cabin crew), comprising 52 per cent males and 48 per cent females with an age range of 25–46 years (mean of 32 years). Group B included 50 subjects (22 cockpit and 28 cabin crew), consisting of 48 per cent males and 52 per cent females with an age range of 26–45 years (mean of 31 years).
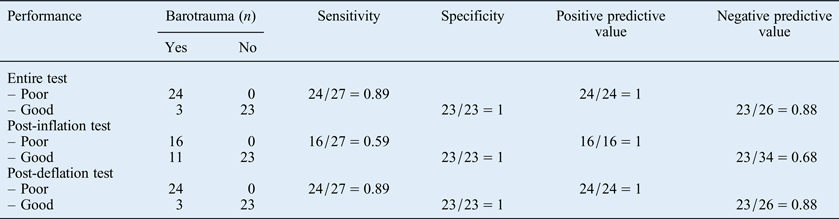
The resting middle-ear pressure in group A ranged from +50 to +30 mmH2O and from −30 to −90 mmH2O; only two subjects had positive pressure values (one was +30 mmH2O and the other was +50 mmH2O). Twenty-seven of the 50 subjects in this group had barotrauma (54 per cent), 24 of which had poor test results overall and 3 had good results overall. In the same group, 23 subjects (46 per cent) showed no barotrauma. All subjects without barotrauma had good test results overall (Table I). It was observed that those 24 subjects (out of 27) who failed the entire test also failed the post-deflation pressure part of the test, indicating a sensitivity of 89 per cent, while only 16 of the 27 subjects had poor post-inflation pressure, revealing a sensitivity of 59 per cent. The specificity value for both the post-inflation and post-deflation tests was 100 per cent (23 out of 23). The sensitivity and specificity values for the entire post-inflation/post-deflation test (89 and 100 per cent respectively) were the same as those for the post-deflation part of the test only (Table I).
Post-inflation/deflation test sensitivity, specificity, and positive and negative predictive values for group A

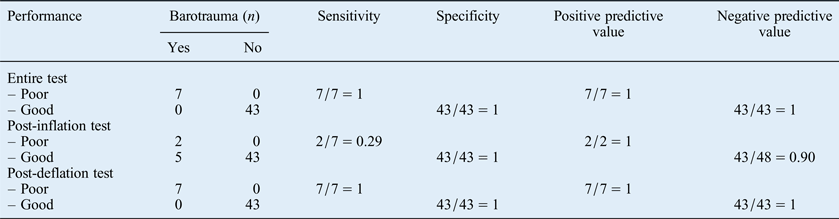
The resting middle-ear pressure in group B ranged from +25 to −25 mmH2O; only three subjects had positive pressure (their pressure values were +25, +15 and +5 mmH2O). The majority of subjects (86 per cent, n = 43) passed the entire test. Only two subjects failed both the post-inflation test and the post-deflation test. A further five subjects had good results for the post-inflation test only (i.e. they failed the post-deflation test). Eighty-six per cent of subjects in this group (43 out of 50) showed no barotrauma; only 7 subjects suffered barotrauma and those 7 subjects showed poor post-deflation pressure values. The sensitivity value and specificity value for the post-deflation pressure test were both 100 per cent (7 out of 7, and 43 out of 43), while the sensitivity and specificity values for the post-inflation pressure test were 29 per cent (2 out of 7) and 100 per cent (43 out of 43) respectively (Table II).
Post-inflation/deflation test sensitivity, specificity, and positive and negative predictive values for group B
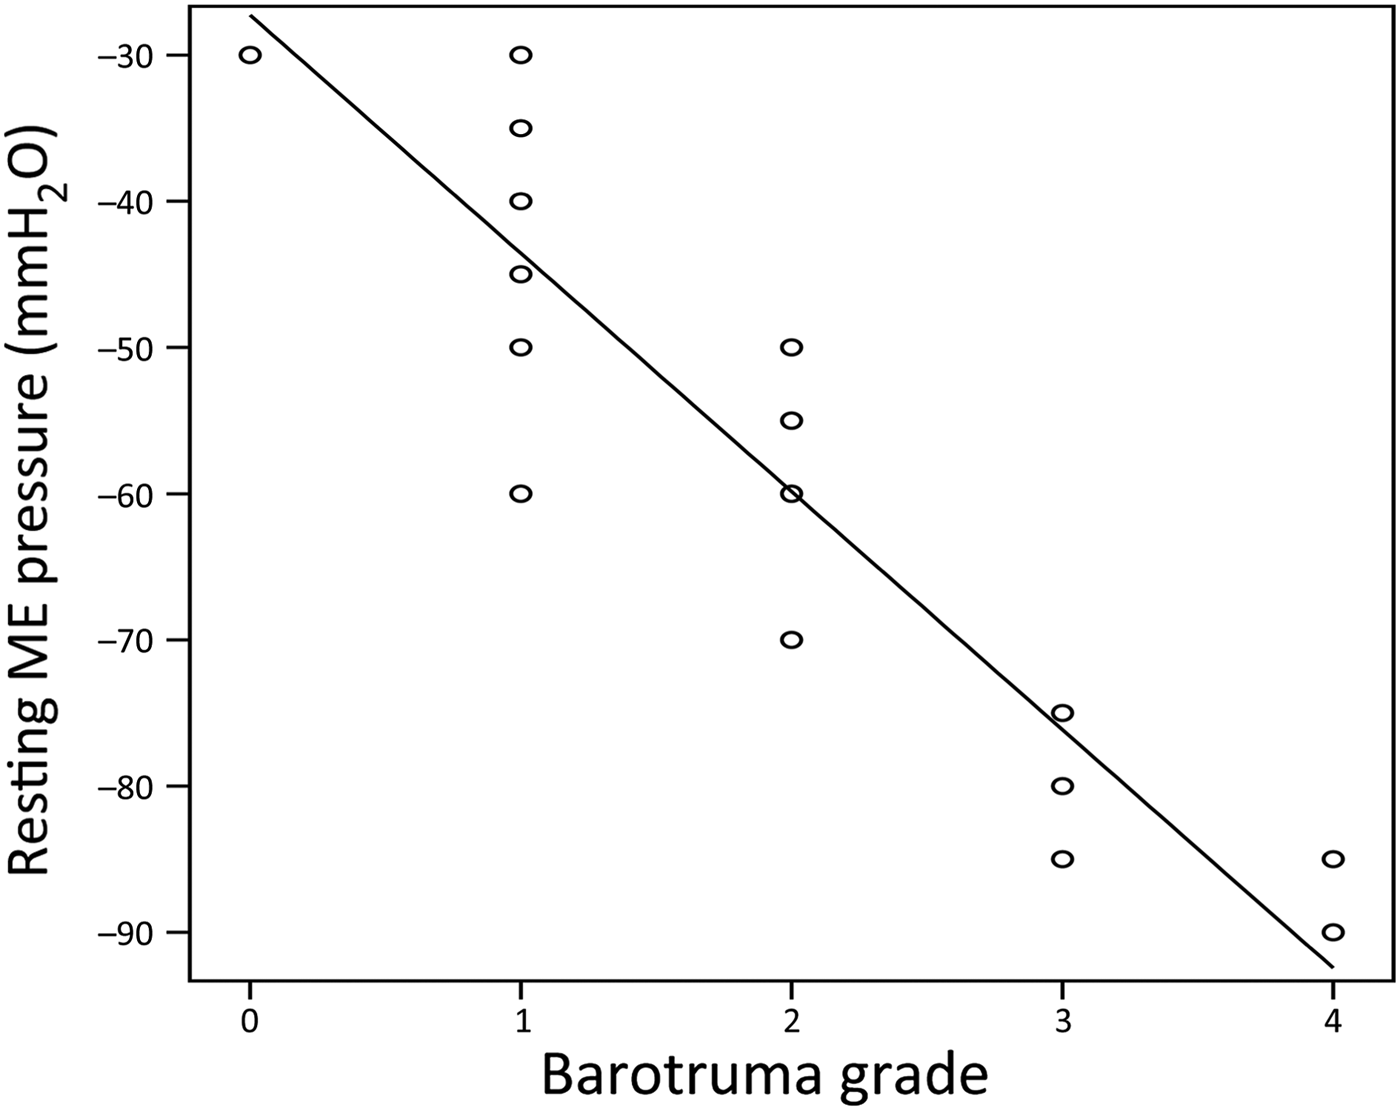
For group A subjects, a positive correlation was found between the negativity of resting middle-ear pressure and the grade of barotrauma (p < 0.001) (Figure 1). It was evident that the post-deflation test result had a higher negative predictive value (88 per cent; 23 out of 26) than the post-inflation test result (68 per cent; 23 out of 34). This same pattern was found for group B; the negative predictive value for the post-deflation test result was 100 per cent (43 out of 43), compared with the value for the post-inflation test result of 90 per cent (43 out of 48) (Tables I and II).
Correlation between barotrauma grade and resting middle-ear (ME) pressure in group A (mean resting middle-ear pressure = −61.7 mmH2O, standard deviation = 21.1; Pearson correlation = −0.94, p < 0.001).
It was observed that all subjects in this study with pressure lower than −55 mmH2O (from −60 to −90 mmH2O) had barotrauma, regardless of good or poor post-deflation test results (Figure 2). However, all subjects with negative pressure of −55 mmH2O or higher (−55 to +50 mmH2O) who passed the post-deflation test had no barotrauma (Figure 3).
Middle-ear pressure values for group A subjects with barotrauma (n = 27), indicating pass or failure of the post-deflation test.
Middle-ear pressure values for group A subjects without barotrauma (n = 23), all of whom passed the post-deflation test.
Discussion
In modern aircraft, the cabin is pressurised at cruising altitudes to raise the air pressure to approximately three-quarters (570 mmHg) of that of the ground atmospheric pressure (760 mmHg).Reference King5 This means that people on board aircraft are exposed to pressure variation of 190 mmHg during take-off and landing. During ascent, at the pressure differential of about 15 mmHg, the eustachian tube passively opens and vents off the positive pressure. This process of passive venting is rarely a problem on ascent and occurs at about every 122 metres of increasing altitudes.Reference Brown8 As an aircraft descends, the atmospheric pressure increases back to normal and therefore the gas in the middle ear contracts. As the eustachian tube behaves differently in descent than in ascent (as the air normally does not enter the middle ear passively), barotrauma tends to be more common and severe with descent.Reference Mirza and Richardson1
There is a lack of international consensus regarding the middle-ear pressure measurements considered indicative of fitness for flying. This study was conducted to determine these middle-ear pressure measurements and to detect the efficiency of the nine-step inflation/deflation test as a predictor of barotrauma in aircrew members. To the best of our knowledge, this study is the first to use the nine-step inflation/deflation test as a predictor of barotrauma in aircrew members.
The present study showed that in both groups (A and B, wherein group A comprised subjects with resting middle-ear pressure outside the range of ±25 and not exceeding ±100 mmH2O, and group B consisted of subjects with resting middle-ear pressure between −25 and +25 mmH2O), the sensitivity of the post-deflation test was higher than that of the post-inflation test. This indicates that the post-deflation test was better able to identify positive results (subjects liable to barotrauma) than the post-inflation test. The specificity of both the post-inflation and post-deflation test was the same in both groups (100 per cent). Nevertheless, the results for group B should be interpreted with caution as only a small number of subjects in that group suffered barotrauma. Overall, the specificity findings indicate that both the post-inflation and the post-deflation tests were able to rule out eustachian dysfunction in those with no barotrauma with 100 per cent accuracy. Moreover, in both groups (A and B), the sensitivity and specificity values for the entire post-inflation/deflation test were the same as those for the post-deflation part of the test (89 and 100 per cent respectively for group A, and 100 and 100 per cent respectively for group B) (Tables I and II).
A more significant parameter is the predictive value. It is logical to conclude that the test with the higher negative predictive value would be the most useful in decision-making regarding otological fitness for flying. The findings suggest that we can use the post-deflation test instead of doing the whole post-inflation/deflation test, with a higher sensitivity (89 and 100 per cent), specificity (100 and 100 per cent) and higher negative predictive value (88 and 100 per cent) for the post-deflation test than the post-inflation test for groups A and B respectively. This higher value for the post-deflation test in predicting barotrauma is logical as this part of the examination actually tests the eustachian tube at a condition simulating what happens during descent.
The aforementioned sensitivity and specificity findings for the post-inflation/deflation test in our study are somewhat different from those reported by Uzun et al. These authors employed the post-inflation/deflation test as a predictor for barotrauma in scuba divers, and reported sensitivity and specificity values of 71 and 97 per cent respectively.Reference Uzun, Adali, Tas, Koten, Karasalihoglu and Devren11 The discrepancy may be due to the fact that their study comprised only 22 subjects, whereas the present study consisted of 100 subjects. In addition, the pressure change experienced with diving is much greater than with flying.
Karahatay et al. performed the nine-step inflation/deflation test before and immediately after an initial hyperbaric oxygen therapy session.Reference Karahatay, Yilmaz, Birkent, Ay and Satar17 They found that the test results were not predictive of barotrauma. This finding could be attributed to their timing of barotrauma evaluation, which was conducted after 7 days of repeated sessions.
In the group B subjects, a resting middle-ear pressure range of ±25 mmH2O appeared to be safe for flying, as reported by Ghosh and Kumar.Reference Ghosh and Kumar15 Nevertheless, seven subjects experienced barotrauma. These seven subjects also had poor post-deflation test results, which raises the importance of the test for predicting barotrauma in aircrew members with apparently good middle-ear pressure.
In this study, a highly significant positive correlation was found between the negativity of resting middle-ear pressure and the grade of barotrauma in group A. This indicates that the ability of the eustachian tube to compensate for the pressure variation challenge becomes weaker with increased negativity of resting middle-ear pressure.
Jerger postulates that negative middle-ear pressure lower than −100 mmH2O should be considered pathological.Reference Jerger10 Internationally, the accepted range for normal middle-ear pressure is −100 to +100 mmH2O.Reference King5, Reference Jerger10, Reference Brooks18, Reference Siedentop, Lowey, Corrigan and Osenar19 Obviously, resting middle-ear pressure lower than −100 mmH2O would be considered unfit for flying. However, the resting middle-ear pressure range of −100 to +100 mmH2O that might be considered safe for flying has not gained consensus. The study by Ghosh and Kumar suggested that the accepted range of −25 to + 25 mmH2O considered safe for flying must be extended.Reference Ghosh and Kumar15 They found that many aircrew members with middle-ear pressure values outside of this range passed the ear clearance run (i.e. had no symptoms or signs of barotrauma) in the decompression chamber; the mean pressure of successful ear clearance runs was −55 mmH2O. Uzun et al. only included subjects with a pressure range of −50 to +50 daPa.Reference Uzun, Adali, Tas, Koten, Karasalihoglu and Devren11 These authors studied the efficiency of the post-inflation/deflation test versus Valsalva and Toynbee tests as predictors of barotrauma in scuba divers, but they did not mention the range of resting middle-ear pressure considered safe for diving.
In the present study, it was observed that all subjects with middle-ear pressure lower than −55 mmH2O suffered middle-ear barotrauma, regardless of the results of the post-inflation/deflation test. Three subjects with lower middle-ear pressure (−60, −70 and −75 mmH2O) passed the test, and all experienced barotrauma (Figure 2). On the contrary, all subjects with pressure equal to or higher than −55 mmH2O who did not pass the post-inflation/deflation test suffered barotrauma. It is not clear why this resting middle-ear pressure value appears to be the cut-off point for barotrauma susceptibility; however, it seems that at this gradient, the ability of the eustachian tube to compensate for the pressure variation challenge becomes weak. This issue needs further investigation using a larger number of subjects. Another factor that should be considered is the rate of descent. While the inflation/deflation test is conducted over few seconds with a pressure variation of around 200 mmH2O (i.e. about 15 mmHg (2 per cent bar)), the true flying experience puts the passenger at a pressure variation of around 2583 mmH2O (i.e. 190 mmHg (25 per cent bar)) over approximately 30 minutes.
• Regarding flying fitness standards, resting middle-ear pressure within the range of +100 and −100 mmH2O has not gained consensus
• This study indicates that resting middle-ear pressure within −55 and +50 mmH2O, together with good post-deflation test results, can be considered reliable predictors for fitness to fly
The present study involved 100 aircrew members who all partook in same-day, return flight trips; that is, they were exposed to two consecutive episodes of pressure variations. The fact that they were exposed to two episodes in the same day should not be overlooked. Further studies are needed, using larger numbers of aircrew members, with exposure to only one episode of pressure variation, to support or modify our findings regarding the predictors of barotrauma in flying.
Conclusion
The findings of the present study indicate that resting middle-ear pressure within the range of −55 and +50 mmH2O, together with good post-deflation test results, can be considered reliable predictors for an aircrew member's fitness to fly. Poor post-deflation test results, regardless of resting middle-ear pressure, should be a contraindication for flying. Resting middle-ear pressure exceeding −55 mmH2O alone needs further study to investigate whether it could be considered a sole risk factor for barotrauma.