

INTRODUCTION
This paper analyzes age and cohort changes in the occupational attainment of Blacks and Whites born in successive decades from 1910 to 1979. Occupational attainment is operationalized as “occupational returns to education” and “earnings returns to occupation.” The primary objective is to determine whether the relative occupational attainment of Blacks of the baby-boom generation, Generation X, and beyond improved over that of their great-grandparents, grandparents, and parents. A baby boomer born in 1946 who reached the age of majority in 1964 hypothetically was the offspring of parents born in 1926, grandparents born in 1906, and great-grandparents born in 1886. The great-grandparents would have reached the age of majority in 1904, when the U.S. Supreme Court had already ruled on the constitutionality of “separate but equal” in 1896, and African Americans had been assigned subordinate status to Whites on a de jure basis in the South and de facto basis in the non-South. From this backdrop, one can ask whether the socioeconomic achievement of African Americans improved over successive generations; that is, has the socioeconomic achievement of African Americans of the baby-boom generation and beyond improved, in both absolute and relative terms, over that of their great-grandparents, grandparents, and parents?
In pursuit of this objective, this paper presents an analysis of generational changes in racial inequality with respect to occupational attainment using a synthetic cohort approach. The research question addressed is whether one can observe significant changes in the relative occupational attainment of African American men and women, grouped by birth cohorts, born between 1910 through 1979, as they move through the life course, from age twenty to sixty-nine. Rephrasing this question more concretely, one can ask, given general societal changes, economic growth, and changes in race relations since WWII, has the relative occupational status of African Americans who reached adulthood in 1960 and beyond improved substantially over that of their parents and grandparents?
The analysis of changes in the relative socioeconomic fortunes of African American men and women since the close of World War II has been the focus of other empirical studies (Childers Reference Childers2014; del Rio and Alonso-Villar, Reference del Río and Alonso-Villar2015; Horton et al., Reference Horton, Lundy, Herring and Thomas2000; Kaufman Reference Kaufman2010; Kurtulus Reference Kurtulus2012; Smith and Welch, Reference Smith and Welch1989; Tomaskovic-Devey and Stainbeck, Reference Tomaskovic-Devey and Stainback2007).Footnote 1 However, this study seeks to break new ground in at least two respects. First, the research reported here builds on previous work, but changes the focus to analyses of occupational returns to education and earnings returns to occupations. How did Blacks and Whites achieve their positions, and are they similarly compensated as a result of being in similar positions? The analysis presented in this paper seeks to answer this question by focusing on long-term trends in “returns” to and from occupational status. Specifically, the paper asks whether Blacks and Whites received the same returns to educational attainment and are provided the same returns in earnings via their location in the occupational hierarchy. Second, in studying long-term trends, a life course perspective to the analysis of changes in the relative status of African Americans is applied. This approach assumes that changes in the relative status of individuals in response to external changes will be partially determined by that person’s temporal position in the life course as determined by her age and birth year. Thus, for example, young adult African American men and women entering the labor market in 1965 or later would have had access to broader occupational opportunities than those who entered the labor force before the passage of the 1964 Civil Rights Act. In addition, broader occupational opportunities may well have acted as a signal to many to seek schooling and experiences in specialty areas previously closed to African Americans.
Only a limited attempt is made to provide an empirically based substantive interpretation of the results, primarily because information bearing on the primary causes of racial inequality is not available in the data used to construct the trend analysis. For example, no information is available to assess the impact of racial attitudes, discrimination, and social networking as a source of information on job availability and hiring. However, limited empirical information on the approximate causes of racial inequality is presented and discussed. Moreover, it is important to further note that the approximate causes identified here are themselves endogenous and thus will need to be explained at some future date.
The discussion is organized as follows. First, divergent views on the extent and causes of racial inequality are presented. Second, a brief historical chronology of changes in the relative status of African Americans since the period of Reconstruction is provided. Third, data sources and measurement of variables are discussed, giving particular attention to sample selection and the construction of racial categories. Finally, results are presented, implications are drawn, and directions for future research are suggested. Anticipating the presentation of results, the findings suggest that the relative occupational attainment of African American men entering the labor market in the 1960s and beyond is little different from that of their parents and grandparents; and while the relative occupational status of African American women to White women improved over the decades, such improvements were subject to significant fluctuations. An explanation of the forces driving these trends is discussed.
DIVERGENT VIEWS ON THE STATE OF RACIAL INEQUALITY
The general public’s view of the relative status of African Americans is that they have made and continue to make significant progress toward achieving parity with Whites. Indeed, the general view of Blacks’ having greater access to most institutional and organizational arenas, increased educational attainment, and expanded occupational opportunities are suggested as evidence of Black progress. Mass media images of African Americans with successful occupational careers and their participation in a variety of activities in settings typical of a middle-class background reinforce the idea of progress. In addition, Whites’ more favorable attitudes toward Blacks provide further evidence of acceptance, in particular, the acknowledgement by a substantial majority that Blacks should be accorded the same rights, privileges, and opportunities as other American citizens (see Bobo and Charles, Reference Bobo and Charles2009).
There is also the more scholarly view, which suggests a more complicated and divergent view of African American progress. First, cross-sectional estimates of the extent of racial inequality indicate substantial improvements in the relative socioeconomic standings of African Americans from 1940 to 1980, but only marginal and fluctuating changes since 1980 (see Jaynes and Williams, Reference Jaynes and Williams1989). It has been suggested further gains in employment and occupational advancement were limited by the growing opposition to affirmative action and other race-targeted programs coupled with economic restructuring beginning in the mid-1970s (Tomaskovic-Devey and Stainbeck, Reference Tomaskovic-Devey and Stainback2007). Second, it is generally acknowledged that all segments of the African American population did not benefit from the expanded educational and occupational opportunities available in American society. Indeed, there is empirical evidence suggesting that approximately a third of the African American population is concentrated in areas of high poverty and crime, and limited educational and employment opportunities have resulted in little or no improvements in their socioeconomic circumstances. In fact, Patrick Sharkey (Reference Sharkey2013), in a recent extension of William J. Wilson’s (Reference Wilson2012b) characterization of African Americans living in central city areas of concentrated poverty and social isolation, found that African Americans living in these conditions inherited their status from previous generations. Sharkey’s findings, although based on results derived from a limited number of geographical locations, clearly reinforces the notion of a permanent underclass among African Americans living in the inner cities of major metropolitan areas (see also Alexander Reference Alexander2012; Fischer et al., Reference Fischer, Hout, Jankowski, Lucas, Swidler and Voss1996; Massey Reference Massey2007).
Moreover, a broader view of the relative socioeconomic attainment of African Americans would not limit the focus to labor market status as indicated by occupation, earnings, and employment tenure. The ability to accumulate assets derived from previous labor market activities, as in the acquisition of physical and liquid assets, and the intergenerational transmission from relatives are of great importance. These assets can cushion the impact of reductions in labor market participation and earnings during poor economic conditions, and provide resources to aid the education, career development, and material well-being of offspring. Current estimates indicate that the racial gap in net worth is far greater than any other socioeconomic indicator, and reflects the mediocre asset holdings of the majority of the African American population, not just the bottom third (Killewald Reference Killewald2013; McKernan et al., Reference McKernan, Ratcliffe, Simmons and Zhang2014).
A HISTORICAL VIEW OF THE PROGRESS OF BIRTH COHORTS
Why focus on birth cohorts, and why focus on the socioeconomic circumstances of individuals born before the Great Depression? The schooling and early labor market experiences of African Americans born prior to the Great Depression were shaped by a racial order rooted in oppression, subjugation, and segregation. This order was encased in and reinforced by rigid social customs, legal codes mostly in the South, and violence. Thus, I use the relative status of the 1910 to 1919 and 1920 to 1929 birth cohorts to reference the impact of the Jim Crow period, and as a point of reference for evaluating the socioeconomic circumstances of African Americans entering the labor market after WWII. A comparison of birth cohorts that begin schooling and enter the labor market in different time periods, marked by both period-specific and cumulative prior changes, potentially could provide the opportunity to observe progressive improvements in the attainment of African Americans over time.
A stylized historical chronology of changes in the status of African Americans follows.Footnote 2 W. E. B. Du Bois is quoted as summarizing the period of Reconstruction and the two decades succeeding it as, “[T]he slave went free, stood a brief moment in the sun; then moved back again toward slavery” (Foner Reference Foner1988, p. 602). The period of Reconstruction provided considerable opportunities for African Americans to pursue professional careers, develop independent businesses, and pursue technical and organizational innovations for the purpose of making money (see Butler Reference Butler2005; Williamson Reference Williamson1985). It became patently clear that Reconstruction was an anomaly evidenced by the emergence of a new racial order, typically described as the Jim Crow era. The gap in socioeconomic attainment between Blacks and Whites was as wide as it would ever be for generations reaching adulthood after Reconstruction. In the South, the vast majority of African Americans were tied to an agriculturally based land tenure system that socially, politically, and economically was little different from slavery. In the non-South, African Americans were limited to low-level minimal wage service occupations, such as domesticity.
The first significant opportunity for change occurred in the period after 1910 with the declining output of the Southern agricultural economy coupled with the growing demand for a substitute industrial labor supply to meet the continuing demands for manufactured goods. Many young men returned to their country of origin to participate in WWI, and others joined the military after the United States became a participant in the War. These changes contributed to African Americans leaving the rural agricultural South and migrating to the growing industrial cities in the South and non-South. Individuals born between 1880 and 1900 reached adulthood during this period, and while their socioeconomic circumstances were improvements over those of their parents, there were little or no appreciable declines in the gaps separating them from Whites. For many African Americans, particularly women, employment in industrial jobs was temporary, because of the manpower demands of WWI. Moreover, African Americans lost these jobs with the return of the traditional labor supply of manufacturing and the resumption of immigration after the war. Access to union-affiliated craft and industrial jobs was not open to Blacks until the passage of the Labor Relations Act in 1936.
The second opportunity for significant change occurred during and after WWII. As W. J. Wilson (Reference Wilson2012a) suggests, governments, particularly Federal, begin to intervene on behalf of Blacks and pursue public policy initiatives that promoted the participation of Blacks in such areas as employment, the military, schooling, and civil rights. These initiatives were possibly caused by other changes, such as the need for the United States to appear universalist in its application of democratic principles to all its citizens, given its efforts to maintain a hegemonic position in the world political economy, and a rapidly growing national economy stimulated in part by the worldwide demand for the goods it manufactured. The sage observation that “a rising tide lifts all boats” is an appropriate metaphor to describe the improved socioeconomic circumstances of Blacks and Whites during the twenty-five year period from 1940 to 1965, but little or no change occurred in racial inequality.
The 1950s also witnessed the launching of the modern era of nonviolent civil rights protests, involving the quests for equal access to public accommodations and voting rights. Although African Americans had been seeking equal rights for decades, political, social, and economic unrest in the developing world played a major role in increasing the awareness of leaders in the United States of the importance of addressing inequities in civil rights experienced by some of its citizens if it desired to maintain its leadership position in the world political and economic order (see Dudziak Reference Dudziak2000).
The 1960s ushered in another period of great change with considerably more emphasis placed on securing further civil rights and equal political participation, equality of opportunity, and equal access to public institutions and organizations. The Civil Rights and Black Power movements of the 1960s were also crucial in making these changes possible. As noted by others, this was marked by the elimination of legal restrictions in practically all spheres of public life, the erosion of the influence of social custom-based forms of exclusion directed at Blacks, and the promotion of race-targeted programs designed to correct historical injustices and provide opportunities for Blacks to participate in areas heretofore denied them. Equal opportunity laws and affirmative action programs resulted in increased access by Blacks to entry-level jobs commensurate with educational credentials and experiences, occupational upgrading, promotions, better compensation packages, and improved job tenure prospects.
It is precisely because race-related changes relevant to the education and labor market experiences of birth cohorts born since the Great Depression will occur in different time periods when they were of different ages that you would expect such public policy-initiated changes to affect the life course of each birth cohort differentially. For example, by 2010 the changes that occurred since 1950 should have had some effect on the socioeconomic level of members of each birth cohort but in different degrees and at different rates, in part because differential exposure due to age, and the time horizon for the absorption or diffusion of a policy change throughout a population. The implementation of public policy initiatives, executive orders, and equal employment laws can provide no concrete assurance that all vestiges of past discriminatory activities will disappear. Indeed, there are reasons to expect that the elimination of barriers to Blacks’ full participation will depend on the level of resistance to policy changes in the society at large and within employing organizations (see Tomaskovic-Devey and Stainback, Reference Tomaskovic-Devey and Stainback2007). If resistance to a policy change is strong, then the expected benefits to be received by the targeted group will be diminished. Nevertheless, one can anticipate an ordering of cohorts based on the timing of the introduction of the change relative to the initiation of schooling and/or entrance into the labor force.
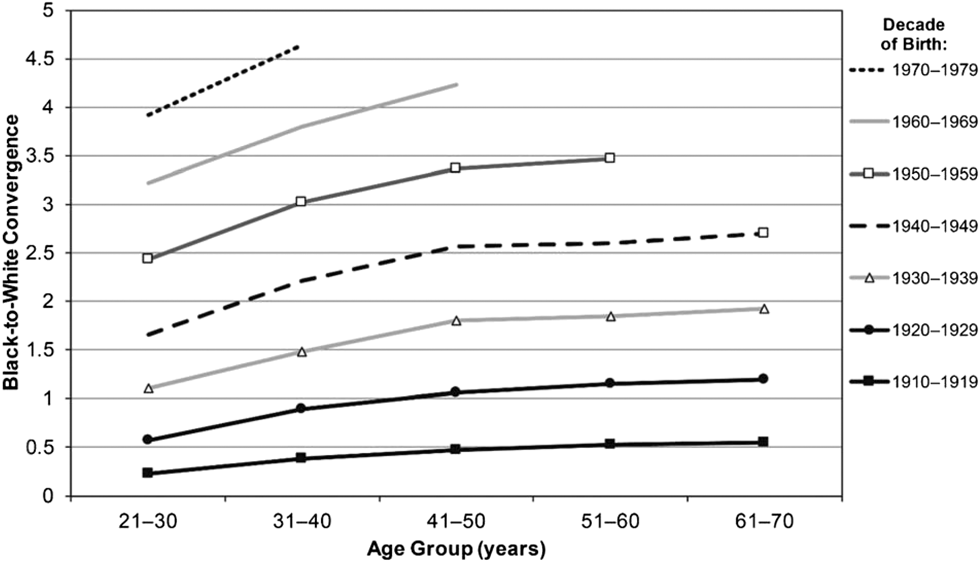
Figure A presents a hypothetical pattern of convergence in occupational attainment between Blacks and Whites over an extended period of time. It should be emphasized that this visualization is only one of several hypothetical patterns of convergence that are possible. Nevertheless, the model should provide a frame of reference for evaluating the result presented below. There are a number of assumptions underlying the hypothetical pattern. First, note that the model projects that much of the change would occur during the initial entrance of cohorts into occupational careers. Thus convergence is not an instantaneous process, but occurs over time as advances in the socioeconomic circumstances of previous cohorts accumulate and advantage subsequent cohorts. I envision this process as working in much the same way as intergenerational mobility, where offspring are able to advance relying on the opportunities and resources provided by their parents. It is expected that only marginal changes in racial inequality in occupational attainment would occur once African Americans move into the mature-worker category. Second, it assumes that barriers to participation exist in all sectors of the labor market, and discriminatory practices affecting occupational advances and the content of compensatory packages diminishes over time. It is unreasonable to assume that all barriers to African Americans’ full participation in the labor market and American society would disappear, say, within a decade. Third, it is assumed that compositional changes within the Black and White populations would only marginally affect the relative socioeconomic outcomes of group members. Similarly, the same can be said for the changing size, composition, and participation of members of other groups in the labor market. Finally, economic growth must be sufficient to allow for expanding demand for labor and wage growth.
Hypothetical View of Ratio Conversions
Source: Predicted values for one +years of post-secondary education derived from multivariate regression analysis of data from IPUMS 1950–2010 (Ruggles, et al, Reference Ruggles, Alexander, Genadek, Goeken, Schroeder and Sobek2010).

DATA AND METHODS
The primary sources of data for this study are the public use samples (PUMS) from the decennial censuses, 1940 to 2010. A secondary source of data are the March supplements to the Current Population Survey (CPS), 1970 to 2010. Both data sets were obtained from the IPUMS project at the University of Minnesota (Ruggles et al., Reference Ruggles, Alexander, Genadek, Goeken, Schroeder and Sobek2010). Each PUMS sample represents 1% of the U.S. population taken at the time of the survey. Since the objective of the analysis is to evaluate the relative progress of African Americans who are descendants of persons present in the United States at the beginning of the twentieth century and who in all-likelihood were overwhelmingly descendants of slaves, we limit the sample to that of native-born Whites and African Americans of non-Hispanic origin. This selection process does not eliminate all persons who are descendants of individuals of foreign birth from the beginning of the twentieth century to the present. For African Americans, that proportion is probably smaller than 2%. For Whites of European origin, it is entirely possible that the samples contain individuals who are second or third generation descendants of the foreign-born. Unfortunately, the requisite information needed to identify such persons on each decennial census file used in the analysis is not possible.
Because of changes in the classification of racial identity used in censuses beginning in 2000, a decision had to be made so as to establish continuity in the definition of race. In the new classification individuals are allowed to identify themselves as being members of more than one race. Hence, as of the 2000 census a person of African descent could also identify herself as being of Caucasian, American Indian, or Asian descent. This change requires transforming the information respondents provided on racial identity so that it is consistent with the operational delimitation provided in previous censuses.
A researcher can choose from several alternatives, including construction of a single racial classification based on the one-drop rule; use distinctions derived from the application of a statistical algorithm; or employ a Black/non-Black distinction if a respondent indicates she is Black in whole or in part. For the purpose of being consistent with the objective of this paper, I apply the operational definition of “Black” and “White” as derived from applying the statistical algorithm approach. In this approach individuals who provide multi-racial responses are randomly assigned to one of the single race categories to which they identify. The Black/non-Black approach compares Blacks with non-Blacks, with the latter becoming increasingly heterogeneous as a result of continuing immigration since 1965. This would not be consistent with the objective of this paper. The one-drop rule approach involves adding individuals who indicate they are part Black with those who indicate they are Black only. This approach assumes that individuals who identify as only part Black in 2000 and/or 2010 identify themselves as being Black in censuses before 2000. While it is very likely that the vast majority identify as Black in previous censuses, it is equally likely that a small number of individuals who indicated they were non-Black in a previous census could have identified as part Black in 2000 and/or 2010. In addition, the IPUMS data do not completely list all individuals who indicate they are part Black plus a member of three or more racial groups. But the key point here is that this approach also reduces to a Black-Black distinction.Footnote 3
The analyses presented below focus primarily on describing observed patterns of racial differences in two indicators of occupational status, followed by an effort to account for the observed pattern. The occupational status measures used here were developed by Robert Hauser and John Warren (1997). Occupational education (“EDSCOR90” in the IPUMS data) captures occupational returns to education (HHauser and Warren, Reference Hauser and Warren1997, p 201), while occupational earnings (“ERSCOR” in the IPUMS data) captures earnings returns to occupational status (Hauser and Warren, Reference Hauser and Warren1997, pp 201-202). These measures capture, respectively, educational input to occupation, and earnings output from occupation, two of the most important components of socioeconomic attainment.
Efforts to quantify occupational standing has a long tradition in sociology, which began with Otis D. Duncan’s, “A Socioeconomic Index for All Occupations” (Duncan Reference Duncan and Reiss1961). Duncan, and other researchers who subsequently followed him, recognized that the prestige valuation of an occupation by community members was substantially determined by the level of educational attainment associated with an occupation, and the monetary rewards derived from an occupation. These ideas led to the development of several approaches to operationalizing a socioeconomic index score that best represents the influences of prestige, education, and income. The Hauser-Warren Socioeconomic Index (HWSEI) is one of the most recent efforts in this regard (Hauser and Warren, Reference Hauser and Warren1997), and can be defined as the weighted sum of occupational education (occupational returns to education) and occupational earnings (earnings returns to occupation). These indicators are operationalized as follows. “Occupational education” is defined as “the percentage of people in the respondent’s occupational category who had completed one or more years of college.” “Occupational income” is defined as “the percentage of persons in occupations having lower standardized median earnings than the respondent’s occupation” (Hauser and Warren, Reference Hauser and Warren1997, pp. 201-202). Hauser and Warren also suggested that it would be appropriate to treat the measures as distinct variables in empirical analyses in part because their individual relationship with other variables are not always the same. However, Michael Hout and colleagues (2015) provide an alternative interpretation based on the development of SEI scores for the 2010 census using 2012 National Opinion Research Center (NORC) occupational prestige scores. These authors could not provide an explanation of why their SEI measure, which is also based on the two components, provides equal weight to the two components in its construction while the Hauser-Warren index does not. I use the Hauser and Warren’s construction because this project was initiated before the publication of Hout and colleagues and applies 1990 occupational codes to all censuses.Footnote 4
Although within-race gender differences are not a principal focus of reported analyses, gender differences within race are important and can assist in the illumination of racial differences. For example, there are historical reasons why the educational attainment of Black women has been higher than Black men; and why White men had higher educational attainment than White women until the 1960s, when subsequent birth cohorts reversed the pattern to favor women. More will be said about these findings in a subsequent section (see McDaniel et al., Reference McDaniel, DiPrete, Buchmann and Shwed2011). In addition, paraphrasing Claudia Goldin (Reference Goldin2006, Reference Goldin2014), women’s involvement in the labor force over the past century and a quarter has undergone three evolutionary phases and one revolutionary phase that have substantially contributed to the transformation of the U.S. economy and society. Pursuing these trends would shift the focus of the planned analysis. However, having said that, let me note that a summary of findings on gender differences in occupational attainment by race is provided below.
RESULTS
Using the relative (to Whites) socioeconomic status of African Americans who reached adulthood and begin their labor market careers during the Jim Crow era as a frame of reference, we can now ask, how have (are) African Americans born during and after the Great Depression fared (faring) in American society? Because members of some of the birth cohorts attended primary and/or secondary schools in integrated settings, their exposure to a broader array of educational opportunities would have been greater, and their educational experiences would have been of higher quality. Similarly, the removal of legal restrictions preventing equal access to employment opportunities and the acquisition of compatible compensation packages should have substantially improved their socioeconomic achievement levels relative to their parents and grandparents; and narrowed the gap in socioeconomic attainment with Whites of similar age and labor market experience.
Thus, we would expect that the timing of change in the occupational attainment of African Americans resulting from changes in legal statures, court rulings, executive policy decisions, changes in racial attitudes, and normative changes that affected race relations would have most benefitted members of birth cohorts who had not yet entered school or the labor market. Following this logic, the ordering of cohorts with respect to the degree of convergence toward the occupational attainment of Whites of similar ages would be, respectively, the most recent birth cohort under observation descending to the oldest cohort (Depression era) under observation. It is important to note that the analytical framework employed here is not designed to evaluate the impact of specific changes on improvement or lack thereof in the socioeconomic fortunes of African Americans. There is ample evidence that substantial changes have occurred in race relations in American society since WWII, and these changes form the basis for the claim that the relative socioeconomic standing of African Americans should also have changed.
The results reported below are derived from the estimation of standard multiple regression models separately for men and women using completion of one or more years of postsecondary schooling, occupational returns to education (log), earnings returns to occupational status (log), and whether employed the previous year. The predictors in the regression models include race, age, education, Southern residence, birth cohort (decade of birth), census year of observation, all two-way interactions between the latter variables, and the three-way interaction of race with age nested within birth cohorts. The coefficients and summary statistics from estimated models are available from the author upon request. The dummy variables used to construct the three-way interaction of race with age nested within birth cohorts are structured in such a way that they provide statistical tests of: 1) the differences between Blacks and Whites, and 2) tests of differences between age groups within each birth cohort and race.
In most instances, the purpose for estimating statistical models is to evaluate the plausibility of a conceptual model and/or test the magnitude and direction of the effects of one or more variables on an outcome measure. The primary reason for estimating multiple regression equations in this paper is to generate predicted values for use in the construction of trends in racial inequality in occupational attainment. Only variables that achieved statistical significance at the (0.05) level contribute to the construction of predicted values. Throughout, results are reported as median predicted values.
There are several reasons for the use of predicted values. First, predicted values are used to eliminate unsystematic or random sources of variation that might distort racial differences. Second, although efforts were made to standardize the operationalization of relevant variables across individual decennial censuses, the methodological challenges posed by the design and construction of each individual census—including the organization and procedures for enumeration, and the decision rules for coding data and variable construction—may be a source of variations that needs to be taken into consideration. The census year variable will capture an unknown amount of the systematic portion of this variation, but hopefully the remaining variation will be mostly random. It should also be noted that in addition to capturing design effects of decennial censuses, it may also capture period-specific changes. I organize the presentation of median predicted values by race, age, and birth cohorts in figure, rather than in table format. Given the large number of median values to be reported and discussed, a visual representation of the trends underlying values can best be represented by figures rather than a tabular format (table presentations may make it more difficult for readers to discern differences in values and patterns in the data given the large number of values to be displayed).
Occupational Attainment: Men
In this section, the associations of occupational attainment with education and earnings are considered in relation to racial inequality. The analysis presented here seeks to answer two questions. First, have occupational returns to education and/or earnings returns to occupation increased incrementally from the oldest to the youngest birth cohorts among African American men? Second, if the answer is affirmative, then have such increases resulted in the reduction of racial inequality with respect to occupational returns to education and/or earnings returns to occupation?
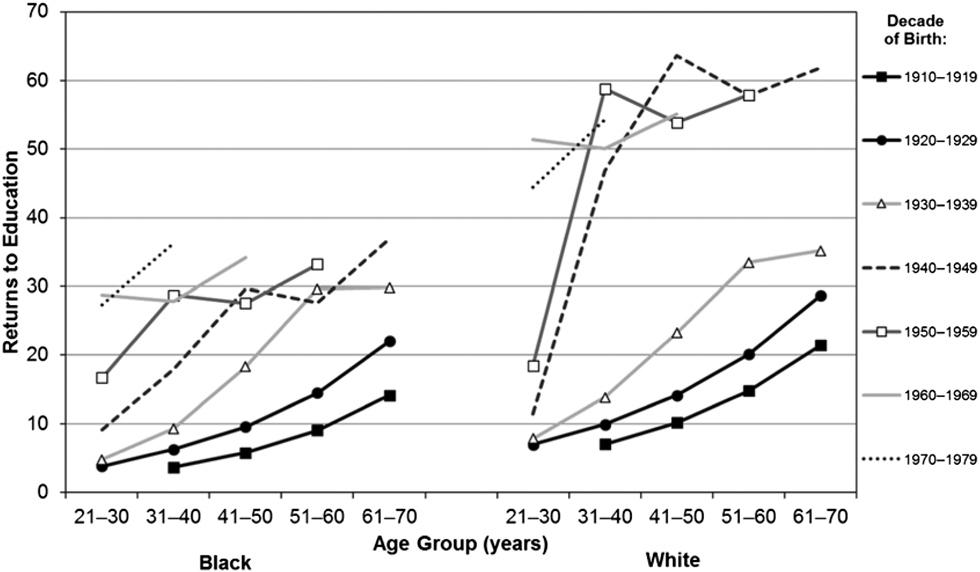
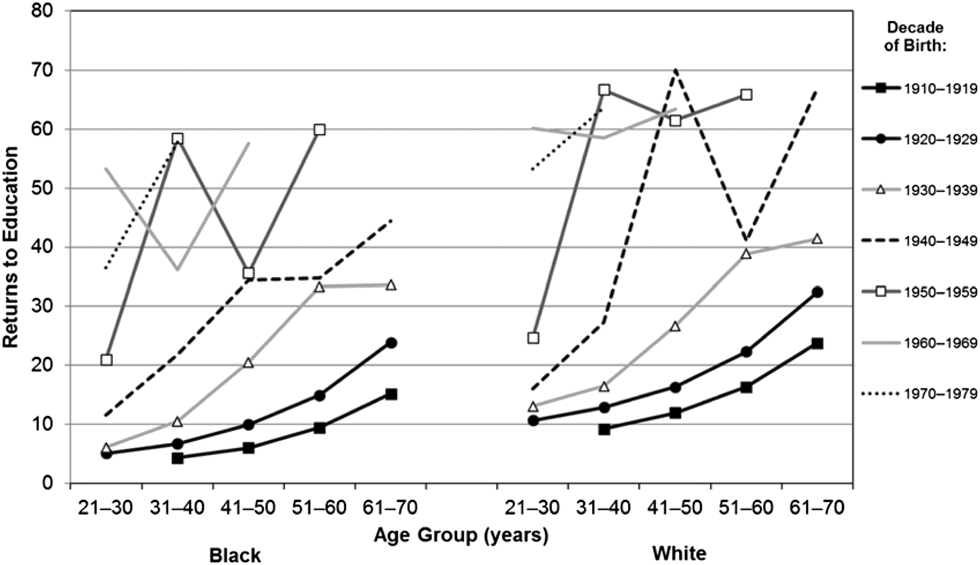
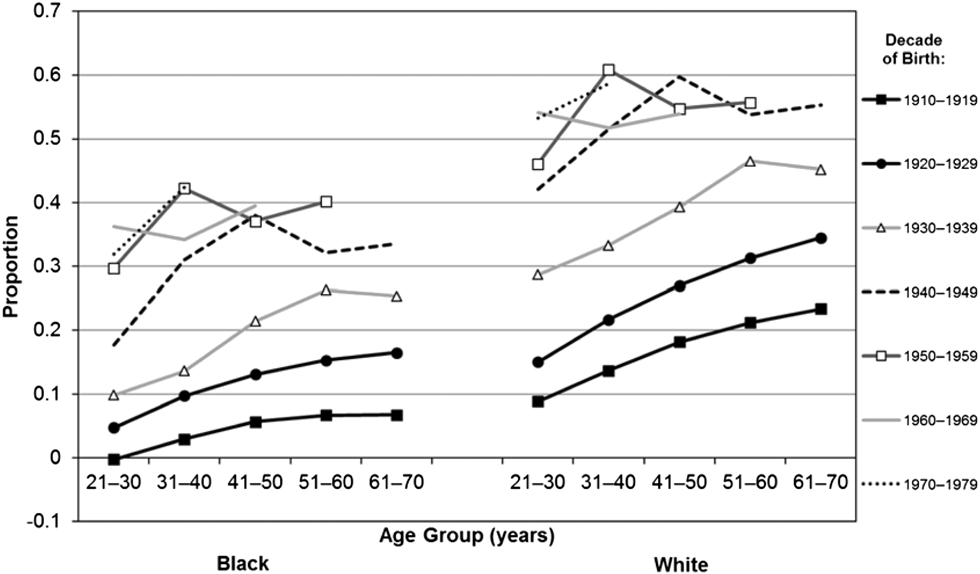
The trends reported in Figures 1 through 4 for men by age and decade of birth address the questions previously noted. Figure 1 presents trends in occupational returns to education for Black and White men by age for each birth cohort. Reported in this figure and all subsequent ones are predicted median values for individual age groups nested within birth cohorts. The trends reported in this figure provide evidence of increases in the initial level of occupational returns by birth cohorts, and increases in the value of the slopes as age increases for both Black and White men. However, there are noticeable racial differences. First, there are slight differences in the initial value of the slopes for the three older birth cohorts, and the shape of the slopes across ages for these older cohorts is very similar. Moreover, the racial gap in occupational returns accelerates and widens starting with the 1940 to 1949 birth cohorts. While change is evident for both racial groups by age, improvements in occupational returns were much greater for White men. One can note that for White men born between 1941 and 1959, occupational returns to education increased substantially from ages twenty-one to thirty to ages thirty-one to forty. Indeed, from ages thirty-one to forty there is no overlap in occupational returns between Black and White men. In sum, while African American men continued to experience increases in occupational returns from the oldest to the youngest birth cohort, such increases were considerably less than those experienced by White men, particularly in the younger cohorts born after the 1930s. An important issue these findings raise is what caused the dramatic increases in the returns to education of White men, resulting in the removal of any overlap observed between Black and White men for the three earliest birth cohorts.
Trends in Predicted Median Occupational Returns to Education by Age and Birth Cohort: Black and White Men
Note: Predicted values for occupational returns to education derived from multivariate regression analysis.
Source: IPUMS 1950–2010 (Ruggles et al., Reference Ruggles, Alexander, Genadek, Goeken, Schroeder and Sobek2010).

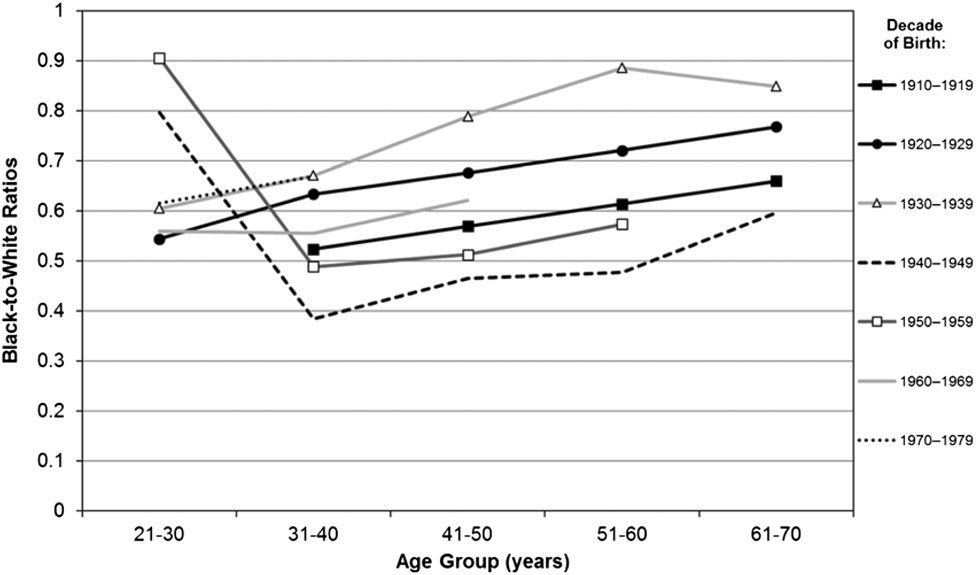
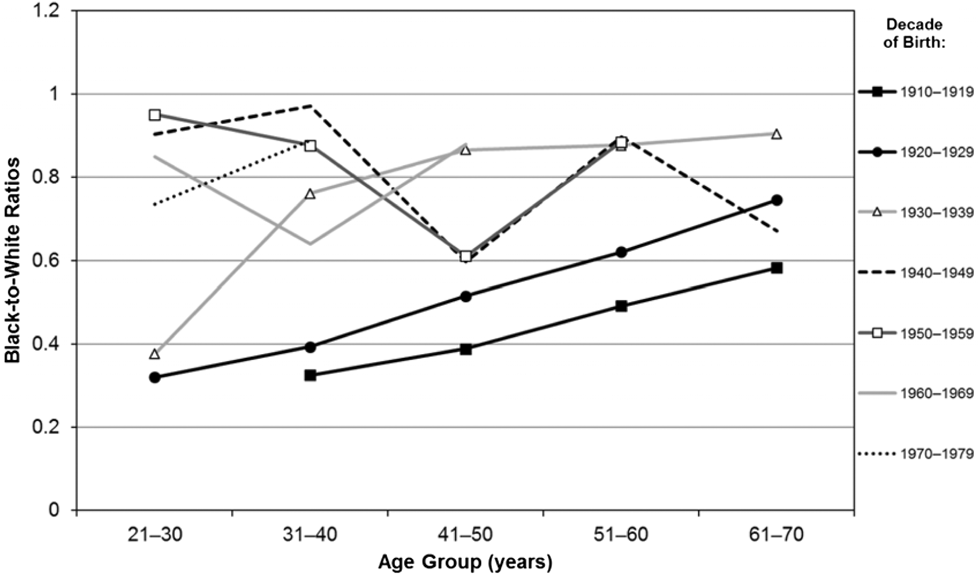
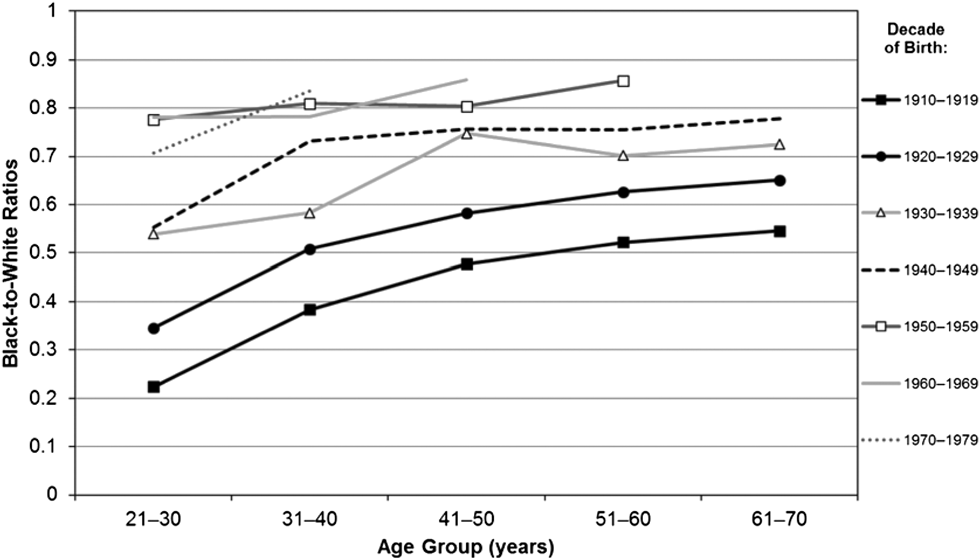
Ratios of Black to White Trends in Predicted Median Occupational Returns to Education by Age and Birth Cohort: Black and White Men
Note: Predicted values for occupational returns to education derived from multivariate regression analysis.
Source: IPUMS 1950–2010 (Ruggles et al., Reference Ruggles, Alexander, Genadek, Goeken, Schroeder and Sobek2010).

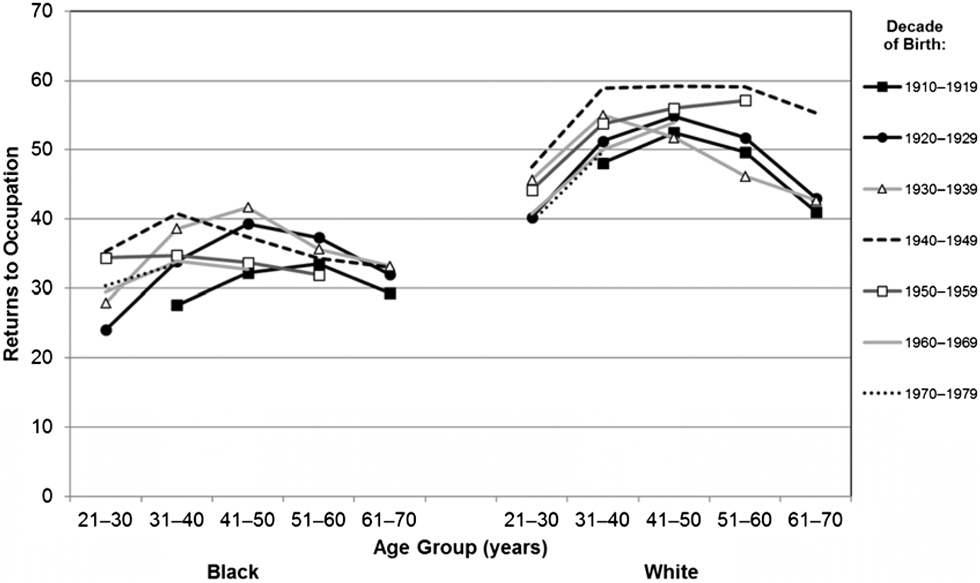
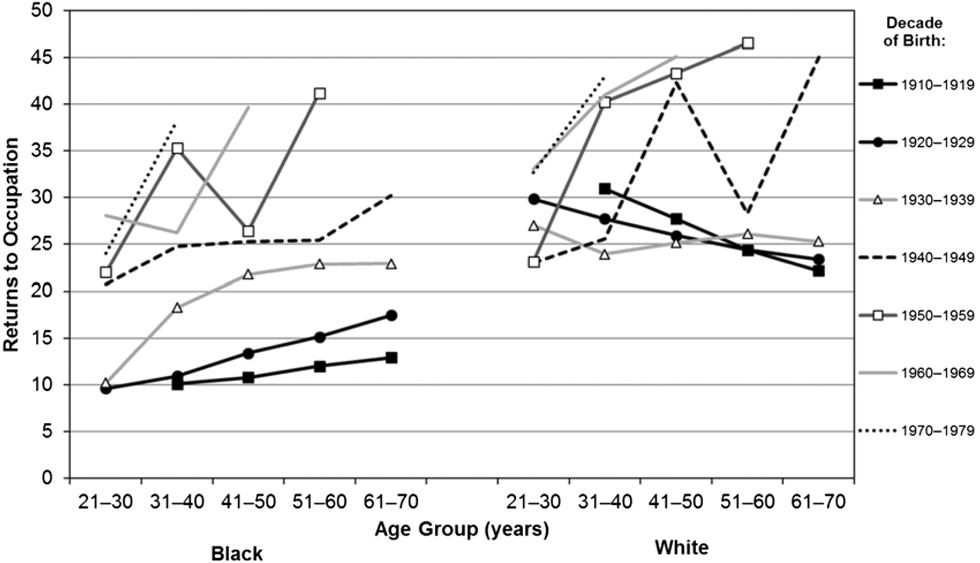
Trends in Predicted Median Earnings Returns to Occupation by Age and Birth Cohort: Black and White Men
Note: Predicted values for earnings returns to occupation derived from multivariate regression analysis.
Source: IPUMS 1950-2010 (Ruggles et al., Reference Ruggles, Alexander, Genadek, Goeken, Schroeder and Sobek2010).

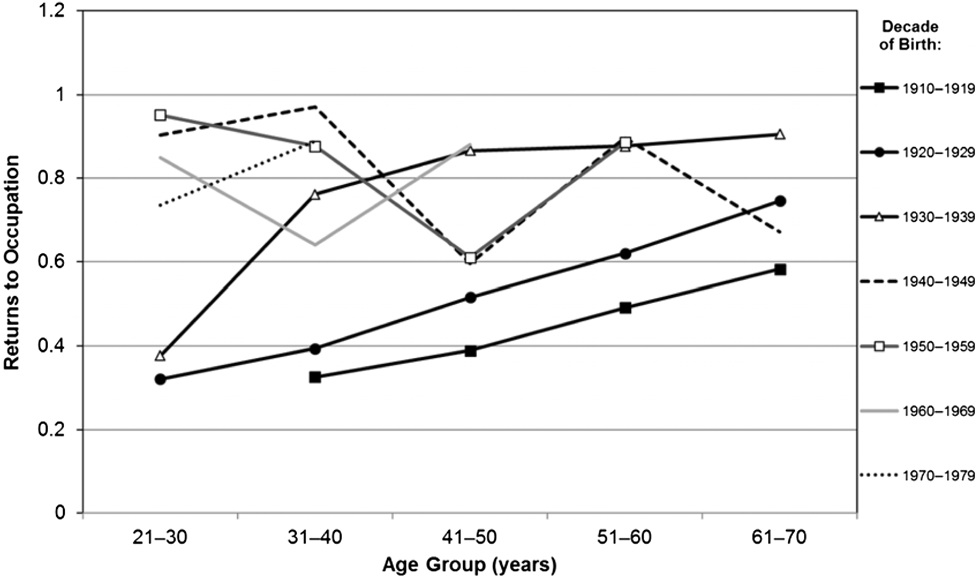
Ratios of Black-to-White Trends in Predicted Median Earnings Returns to Occupation by Age and Birth Cohort: Black and White Men
Note: Predicted values for earnings returns to occupation derived from multivariate regression analysis.
Source: IPUMS 1950–2010 (Ruggles et al., Reference Ruggles, Alexander, Genadek, Goeken, Schroeder and Sobek2010).

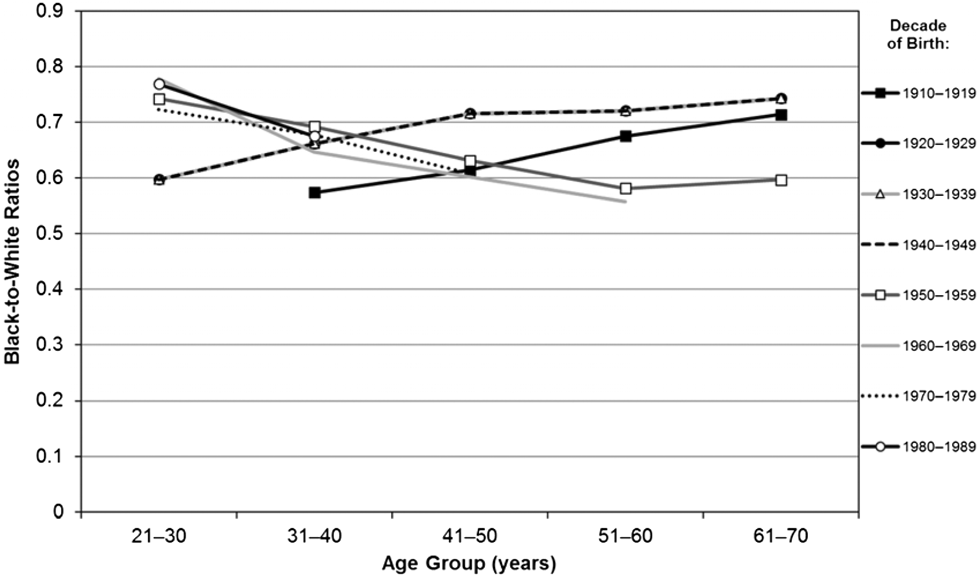
Figure 2 presents the ratio of Black to White men occupational returns to education by birth cohort and age. There is no clear ordering of birth cohorts as to the level of their respective slopes. The ratios are higher for the three oldest cohorts. These results clearly imply, at least with respect to occupational returns to education, that African American men did not benefit relatively from the societal, legal, and policy changes that occurred since the 1960s, as increases among White men were clearly greater. Thus the relevant question is, how can one account for greater changes among White men during a period when initiatives were presumably targeted toward improving the circumstances of Blacks and other racial minorities?
Figure 3 reports earnings returns to occupational status by age and birth cohorts for Black and White men. One can observe only small differences within each racial group with respect to earnings returns by age and birth cohorts. Changes in earnings returns do exhibit the typical pattern of increases then decreases at older ages. However, the sequential ordering of birth cohorts by the level of earnings returns is not from the oldest birth cohort to the youngest birth cohort as one would expect. Changes in earnings returns to occupation appear to be somewhat higher for the older cohorts for both racial groups. The most striking pattern that can be observed in Figure 3 is the clear separation of Black and White men in earnings returns by age and birth cohorts. In other words, while African American men experienced changes in earnings returns with respect to age, the changes were not sufficient to alter the relative standings of Black men to White men in earnings returns, as there is no overlap in the two distributions. The average earnings returns of White men were substantially greater than those of Black men at all ages and for each birth cohort. These results indicate that despite small changes in earnings returns to occupational status for both groups, the relative status of the racial groups remained unchanged. In addition, this pattern is very different from that observed for occupational returns to education, indicating that while occupational returns to education increased markedly, increased occupational status did not result in similar improvement in earnings returns to occupation.
Figure 4 presents ratios of Black men to White men earnings returns to occupational status by age and birth cohorts. Black men’s earnings returns are about 73–77% those of White men at the beginning of their occupational careers. More significant are the patterns of decline in the ratios with age for all birth cohorts, except the 1910 and 1940 cohorts, indicating Black men’s relative position worsens as they age (Thomas et al., Reference Thomas, Herring and Horton1994 ).Footnote 5 The key point to note, however, is that the relative status of Black men did not change particularly for the younger cohorts. Thus the hypothesis of whether Black men are converging on the occupational attainment of White men can be completely rejected. The pattern for the younger cohorts of African American men should have exhibited the most evidence of convergence toward the occupational attainment of White men, but this is clearly not the case. Figures 15 and 16, discussed below, on educational attainment are examples of convergence.
It has already been noted that the results for the two indicators of occupational status are for men who worked the week prior to the census, thus excluding individuals who were unemployed or not in the labor force. Because of these omissions, reported results may not provide an accurate estimate of the extent of racial inequality in socioeconomic attainment for the total Black and White male population. Previous research indicates substantial differences between Black and White men in joblessness since the 1940s. Employment disruptions associated with unemployment and nonparticipation are much more likely to occur among Black men, altering occupational careers and therefore career trajectories (Holzer Reference Holzer2009; Smith and Welch, Reference Smith and Welch1989; F. D. Wilson et al., Reference Wilson, Tienda and Wu1995). Thus, individuals who have experienced employment disruptions are also more likely to experience lower occupational returns to education and earnings returns to occupation relative to peers who experienced no disruptions in employment.
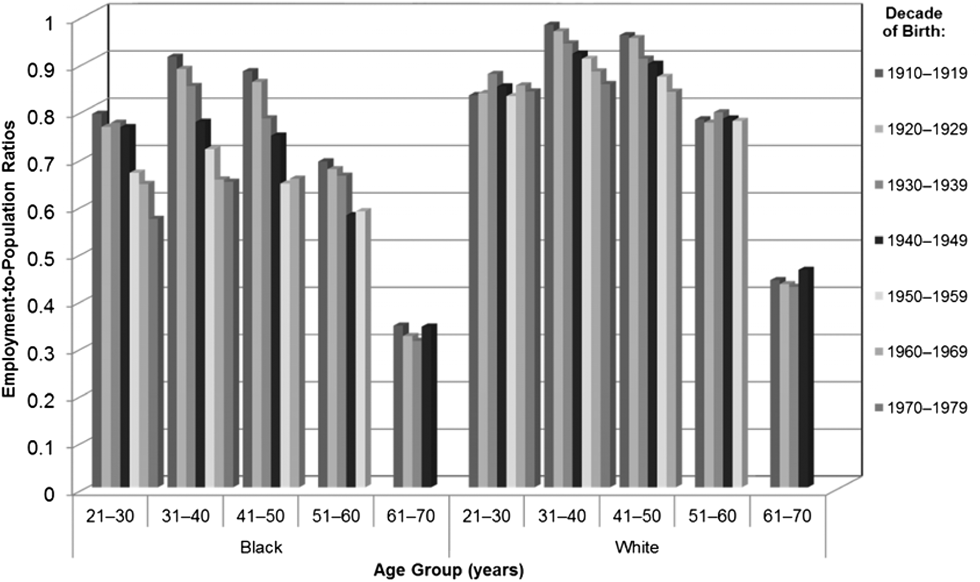
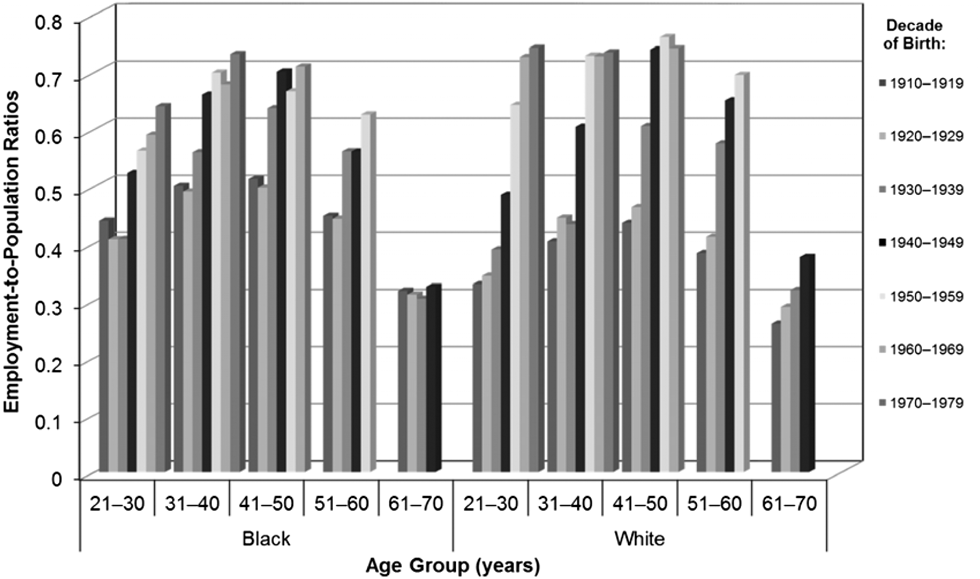
Figure 5 presents predicted employment-to-population ratios by age nested within birth cohorts for Black and White men. While the bar figure for each racial group is similar in shape overall, there are substantial differences in the proportion working by age and birth cohorts. At the youngest age, Black men have the lowest proportion employed, and while the proportion increases for the next two age groups, Black men’s employment level still lags behind that of Whites. Most disturbing of all is the acceleration in the decline in employment by age. The older cohorts entered the employment sector at a higher proportion, and the subsequent decline by age is greater for the most recent cohorts. In sum, among Black men, the youngest cohorts enter employment at a lower percentage, and over time they appear to exit employment at a higher percentage as they age. One can also observe a similar pattern for the two middle age groups for White men, but the pattern is not as pronounced. The trends exhibited in Figure 5 are very consistent with long-term trends of declining labor force participation of men in general as reported in a recent report of the president (2016).
Trends in Predicted Median in Employment-to-Population Ratios, by Age and Birth Cohorts: Black and White Men
Note: Predicted values for employment-to-population ratios derived from multivariate regression analysis.
Source: IPUMS 1950–2010 (Ruggles et al., Reference Ruggles, Alexander, Genadek, Goeken, Schroeder and Sobek2010).

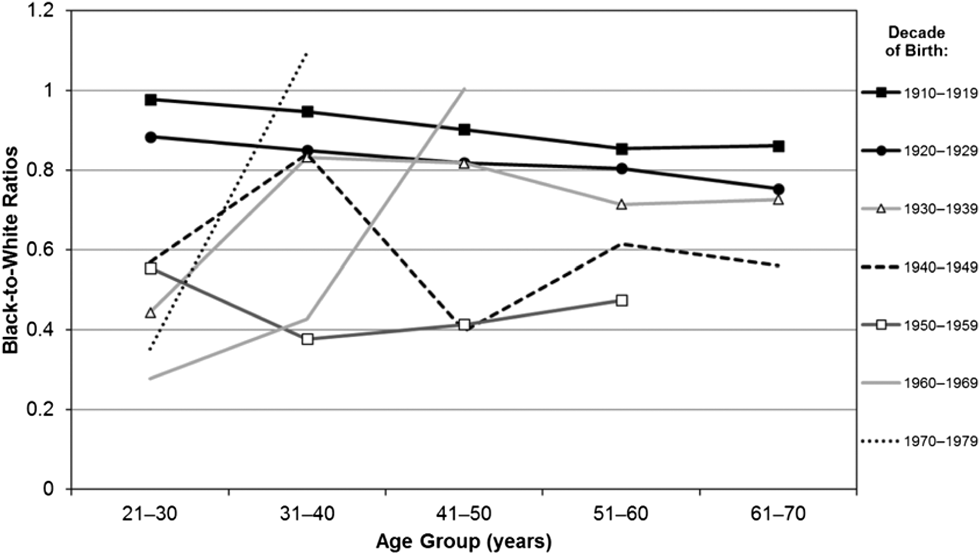
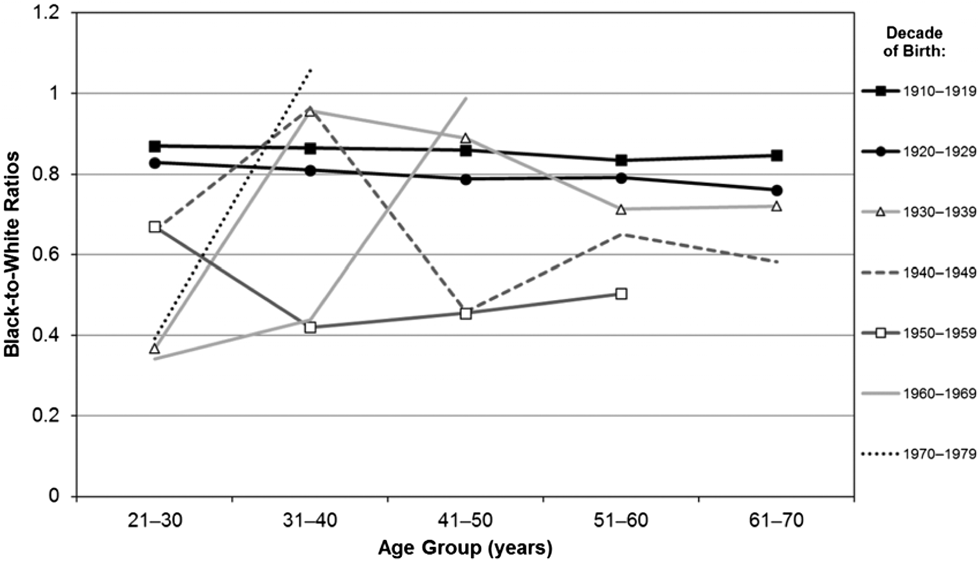
A question can be raised as to the extent to which racial differences in employment affect the overall pattern of racial inequality in socioeconomic attainment with respect to occupational returns to education, and earnings returns to occupation. To address this question, the previously discussed regression models are re-estimated such that the samples are expanded to include individuals who reported not being at work the week prior to the census. To make these estimations possible, a small constant (0.10) was added to each observation with respect to their initial value on occupational returns to education and earnings returns to occupation, whether or not they worked in the week prior to the census. As before, predicted values were estimated from the regression results, and subsequently were used to calculate Black to White ratios by age and birth cohorts for each outcome measure. These values can be interpreted as socioeconomic indicators per capita. The results are reported in Figure 6, occupational returns to education; and Figure 7, earnings returns to occupation. Hypothetically, if the proportion of Black and White men who were not employed is identical, then the trends reported in Figures 6 and 7 would be identical to those reported in Figures 2 and 4. It is important to note here, however, that Black men and White men having identical employment share would not eliminate racial differences in socioeconomic attainment, rather it only would remove that share associated with employment. The population base for these estimates consist of all men twenty to sixty-nine years of age, including individuals in group quarters.
Ratios of Black-to-White Trends in Predicted Median Occupational Returns to Education, by Age and Birth Cohorts: Black and White Men (Includes the Not Employed)
Note: Predicted values for occupational returns to education derived from multivariate regression analysis.
Source: IPUMS 1950–2010 (Ruggles et al., Reference Ruggles, Alexander, Genadek, Goeken, Schroeder and Sobek2010).

Ratios of Black-to-White Trends in Predicted Median Earnings Returns to Occupation, by Age and Birth Cohorts: Black and White Men (Includes the Not Employed)
Note: Predicted values for earnings returns to occupation derived from multivariate regression analysis.
Source: IPUMS 1950–2010 (Ruggles et al., Reference Ruggles, Alexander, Genadek, Goeken, Schroeder and Sobek2010).

The ratios presented in Figures 6 and 7 clearly show substantial increases in inequality for both occupational status indicators, demonstrating that the addition of the nonemployed increased the racial gap on a per capita basis. The results indicate that racial inequality increases with age, and the gap is widest for the cohorts born in 1940 and later. Moreover, on a per capita basis, Black men’s occupational status declined for the most recent birth cohorts due in large part to joblessness starting with members of the 1940 birth cohort, which subsequently increased progressively with each successive birth cohort. These findings merely confirm those reported in Figure 5: that the relative employment of Black men started at a lower level, reached a peak age significantly lower than that of White men, then declined continuously until retirement age is reached. For the post-WWII birth cohorts these results point to the devastating impact of diminishing blue-collar employment opportunities in inner cities and inhabiting a sociocultural environment infested with drug consumption and distribution, violence, and other criminal activities. Black men with criminal records face additional challenges in seeking employment (see Holzer Reference Holzer2009; Pager Reference Pager2007; Pager and Karefin, Reference Pager and Karafin2009; Western Reference Western2007; W. J. Wilson Reference Wilson1996). In the end, one enormous consequence of this decline in employment is the increasing gap in socioeconomic attainment between Black and White men. In other words, Black men are substantially worse off at the end of their working years.
Occupational Attainment: Women
How have African American women fared in the labor market relative to White women? In the past century, the labor force status of all women has undergone enormous changes with respect to participation rates, work effort, occupational status, wages, and commitment to labor market careers (Goldin Reference Goldin2006). This is quite different from the labor force careers of men, which, with the exception of declining participation, has been stable. Black women’s labor force status was not transformed to the same extent as that of White women.
Until recently, a much higher proportion of Black women were active participants in the paid labor force over longer periods of their working life than White women (Goldin Reference Goldin1990; Smith and Welch, Reference Smith and Welch1989). This was due more to economic necessity because of the employment instability of Black men, and the need to support their households when men were not present (Jones Reference Jones1985). However, involvement in the labor force over longer periods does not necessarily mean that Black women achieved higher occupational status based on work experience. Indeed, the tremendous surge in women’s labor force participation beginning in the 1960s contributed to a substantial divergence in the occupational composition of Black and White women in the labor market. Black women shifted away from domestic services to machine operators and clerical and sales occupations; while White women shifted from clerical and sales into the professions (Bianchi and Spain, Reference Bianchi and Spain1986; Goldin Reference Goldin2006, Reference Goldin2014; Smith and Welch, Reference Smith and Welch1989).
Here we ask the same question of the status of women that we asked of men. Namely, have occupational returns to education and earnings returns to occupation increased incrementally from the oldest to the youngest birth cohorts among African American women? If the answer is affirmative, then have such increases resulted in the reduction of racial inequality? Because the labor force status of women changed dramatically during the study period, one would expect that changes in their occupational status by birth cohort and age would very likely not mirror that of men, nor would we expect differences between Black and White women to mirror those of men.
Figure 8 reports the predicted occupational returns to education separately for Black and White women. For the three youngest birth cohorts—1910 to 1919, 1920 to 1929, and 1930 to 1939—occupational returns to education by age are very similar to those observed for men. In the case of the more recent cohorts, however, the patterns for men and women diverge substantially. Changes in returns to education are much more volatile for Black women in the case of later birth cohorts. In fact, Black women seem to have been more affected by period-specific changes than Black men. By way of contrast, the cohort and age-specific pattern for occupational returns to education are similar for White men and women, although the median values for women are greater. Despite greater sensitivity to period-specific general economic changes, Black women did experience greater changes in occupational returns to education than Black men. These results should not be interpreted to mean that women’s occupational status surpassed that of men, but merely that women experienced greater absolute increases in returns than men. The greater increases in median values for age groups reflect in part the surge in participation of women who raised their occupational status as a result of increasing educational attainment.
Predicted Trends in Median Occupational Returns to Education, by Age and Birth Cohorts: Black and White Women
Note: Predicted values for occupational returns to education derived from multivariate regression analysis.
Source: IPUMS 1950–2010 (Ruggles et al., Reference Ruggles, Alexander, Genadek, Goeken, Schroeder and Sobek2010).

Figure 9 presents the ratio of Black women to White women predicted occupational returns to education by age and birth cohort. For the three oldest birth cohorts one can observe a steady rise in the relative standings of Black women; then the impact of period-specific effects on Black women’s occupational returns to education become more evident. For example, when members of the 1940 to 1950 birth cohort entered the labor force in the 1960s, ages twenty-one to thirty, Black women’s occupational returns to education were 72% those of White women; this increased to 80% in the 1970s; declined to 49% in the 1980s at ages forty-one to forty-nine; then increased to 85% in the 1990s; and declined again in the 2000s to about 66%. The relative standing of the three youngest cohorts seems to have been affected only by the 2000 recessionary period. Moreover, it is clear that Black women are closer to parity with White women than Black men are with White men.
Ratios of Black-to-White Trends in Predicted Median Occupational Returns to Education, by Age and Birth Cohorts: Black and White Women
Note: Predicted values for occupational returns to education derived from multivariate regression analysis.
Source: IPUMS 1950–2010 (Ruggles et al., Reference Ruggles, Alexander, Genadek, Goeken, Schroeder and Sobek2010).

Figure 10 reports decade changes in earnings returns to occupation for Black and White women by age and birth cohorts. The pattern of change is similar to that reported for occupational returns to education for Black women. Earnings returns were higher for each of the four successive birth cohorts, 1910 through 1949. The three youngest cohorts experienced higher but fluctuating earnings returns. The pattern for White women is different. First, note that the differences in the age pattern of earnings returns were narrower and sloped downward with age for the three oldest birth cohorts. The 1940 to 1949 cohort provides a sharply different pattern, with raising but fluctuating returns. On the other hand, changes in earnings returns for the three youngest cohorts of White women increased by age but with little observed difference in their respective slopes. In general, the age pattern of earnings returns does not exhibit the pattern of raising earnings returns to middle age followed by declines as was clearly evident among men. This finding should not be surprising given that women’s status in the labor market was changing in such areas as labor force participation, intensity and duration of work effort, occupational position, career orientation, and wages (see Goldin Reference Goldin2006). However, given that the participation and occupational status of Black women have been decreasing in recent decades, it is not clear whether this trend will continue (see Pettit and Ewert, Reference Pettit and Ewert2009).
Trends in Predicted Median Earnings Returns to Occupation by Age and Birth Cohorts: Black and White Women
Note: Predicted values for earnings returns to occupation derived from multivariate regression analysis.
Source: IPUMS 1950–2010 (Ruggles et al., Reference Ruggles, Alexander, Genadek, Goeken, Schroeder and Sobek2010).

Figure 11 presents Black to White ratios of earnings returns to occupation. There one can observe steadily increasing slopes for the three oldest cohorts with increasing age, indicating a narrowing of the racial gap. Moreover, despite the greater fluctuation in the earnings returns for Black women in the four youngest cohorts, the direction of the trends is also toward increasing parity with White women.
Ratios of Black-to-White Trends in Predicted Median Earnings Returns to Occupation, by Age and Birth Cohorts: Black and White Women
Note: Predicted values for earnings returns to occupation derived from multivariate regression analysis.
Source: IPUMS 1950–2010 (Ruggles et al., Reference Ruggles, Alexander, Genadek, Goeken, Schroeder and Sobek2010).

As with men, it would be illuminating to determine whether racial differences in employment over the life course among women affect educational and earnings returns per capita. Figure 12 presents employment to population ratios for Black and White women by age and birth cohorts. For the two oldest birth cohorts, the proportion of Black women working remains high throughout the life course. Black women born between 1930 and 1949 had a higher proportion working up to age forty, then the share declines thereafter. Black women born between 1950 and 1979 were less likely to be working than White women.
Trends in Predicted Median Employment-to-Population Ratios, by Age and Birth Cohorts: Black and White Women
Note: Predicted values for employment-to-population ratio derived from multivariate regression analysis.

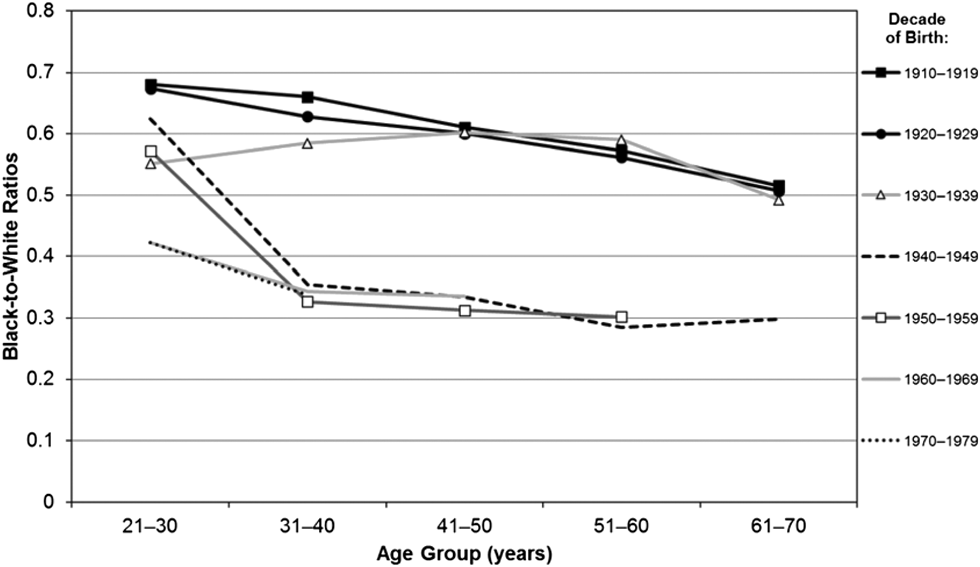
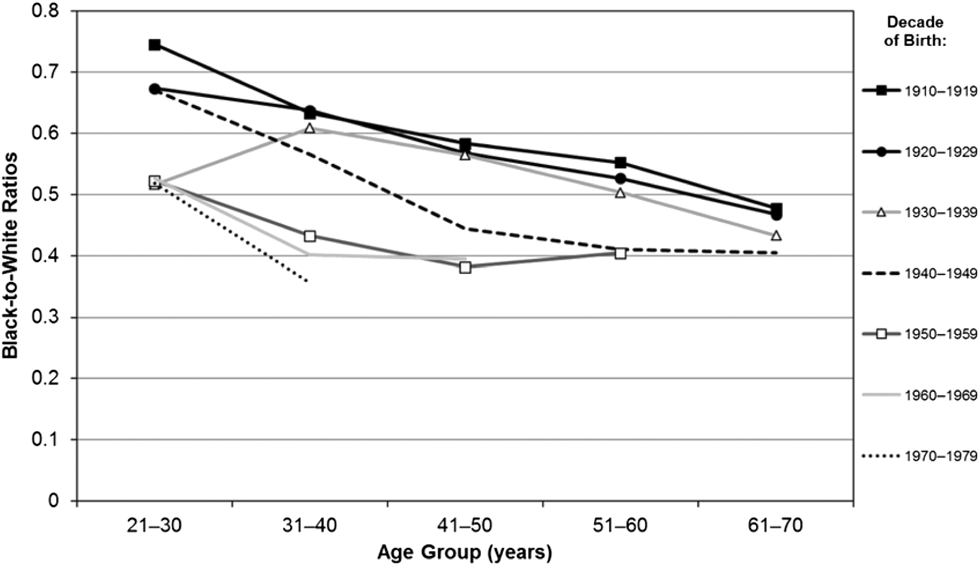
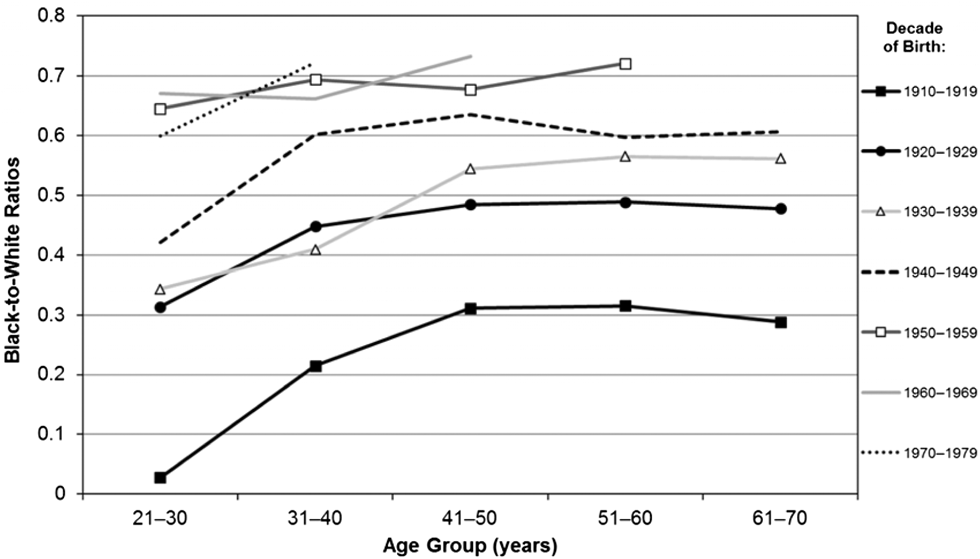
Next, as with men, an effort is made to determine the impact among women of employment on occupational status per capita. Estimates of Black women to White women ratios of per capita measures of occupational returns to education and earnings returns to occupation are presented in Figures 13 and 14, respectively. The two figures evidence cohort and age patterns for occupational returns to education and earnings returns to occupation. Overall, White women experience higher returns, particularly at ages forty plus. The Black to White ratios exhibit considerable variability at ages twenty-one to forty. This variation may reflect racial differences in the timing of childbirth and child rearing, schooling, and the initiation of labor market activities. Moreover, an important point to note is that, unlike Black men, Black women did not experience substantial declines in returns with age, and the younger cohorts are not disadvantaged relative to the pre-1940 birth cohorts.
Ratios of Black-to-White Trends in Predicted Median Occupational Returns to Education, by Age and Birth Cohorts: Black and White Women (Includes the Not Employed)
Note: Predicted values for occupational returns to education derived from multivariate regression analysis.
Source: IPUMS 1950–2010 (Ruggles et al., Reference Ruggles, Alexander, Genadek, Goeken, Schroeder and Sobek2010).

Ratios of Black-to-White Trends in Predicted Median Earnings Returns to Occupation, by Age and Birth Cohorts: Black and White Women (Includes the Not Employed)
Note: Predicted values for earnings returns to occupation derived from multivariate regression analysis.
Source: IPUMS 1950–2010 (Ruggles et al., Reference Ruggles, Alexander, Genadek, Goeken, Schroeder and Sobek2010).

Accounting for Trends in Racial Inequality in Occupational Attainment
The question that is to be addressed presently is, what factors can be advanced to account for the observed trends in racial inequality in occupational attainment? The data sources used in this study preclude an exhaustive analysis of the causes of racial inequality in occupational attainment. A more appropriate framework would be one in which it would be possible to link antecedents to outcomes in a continuous manner covering schooling and involvement in the labor force (see Killewald Reference Killewald2013; Mare Reference Mare2011). Instead, the principal focus here is on assessing the impact of changes in educational attainment and changes in employment status on changes in racial inequality in occupational attainment using cross-sectional data. To be sure, these are not the only factors contributing to racial inequality in occupational attainment (see Featherman and Hauser, Reference Featherman and Hauser1976; Hout Reference Hout1984; Kaufman Reference Kaufman2010; Massey Reference Massey2007; Reskin Reference Reskin2003, Reference Reskin2012). In addition, the effects of educational attainment and employment cannot be considered primary causes because they are also endogenous, transmitting the influences of other factors on occupational attainment.
Educational Attainment
Previous research has documented the crucial role of improvement in educational attainment as a major avenue to accessing broader occupational opportunities and higher income (Alba and Nee, Reference Alba and Nee2003; Featherman and Hauser, Reference Featherman and Hauser1976; Lieberson Reference Lieberson1980; Mare Reference Mare and Farley1995). In 1940, 26.1% of Whites and 7.7% Blacks had completed high school or more. By 2010, educational attainment levels had increased substantially. Thus high school completion or more increased to 87.6% for Whites, and 84.2% for Blacks. These are substantial increases, two-thirds of which occurred by 1980. A number of factors have been identified as contributing to increased average educational attainment levels of the U.S. population since 1940, including intergenerational mobility, mortality, international migration to and from different origins, period-specific changes associated with improved school and teacher qualities, and initiatives to increase the preparedness of pupils for learning.
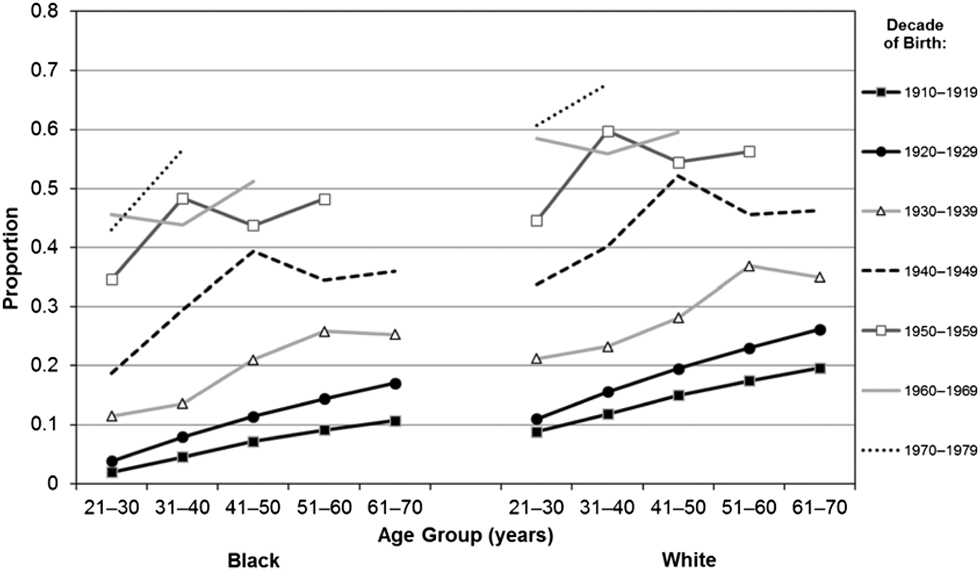
Figures 15 and 16 present Black to White ratios of the (predicted) proportion of each group completing one or more years of postsecondary schooling for men and women, arrayed by age and birth cohort, respectively. The particular arrangement of the data in each figure allows one to determine the extent to which the educational attainment of Blacks converged toward that of Whites by age and birth cohorts. The age range of cohorts born after 1959 are right-censored because the decennial census data series ends at 2010. Theoretically, movement toward convergence would imply an incremental narrowing of the attainment gap as one moves from the pre-Depression era cohorts to the 1970 to 1979 cohort.
Ratios of Black-to-White Trends in Predicted Proportion with One or More Years of Postsecondary Education, by Age and Birth Cohorts: Black and White Men
Note: Predicted values for one or more years of postsecondary education derived from multivariate regression analysis.
Source: IPUMS 1950–2010 (Ruggles et al., Reference Ruggles, Alexander, Genadek, Goeken, Schroeder and Sobek2010).

Ratios of Black-to-White Trends in Predicted Proportion with One or More Years of Postsecondary Education, by Age and Birth Cohorts: Black and White Women
Note: Predicted values for one or more years of postsecondary education derived from multivariate regression analysis.
Source: IPUMS 1950–2010 (Ruggles et al., Reference Ruggles, Alexander, Genadek, Goeken, Schroeder and Sobek2010).

For both men and women, the results clearly exhibit a pattern consistent with the convergence hypothesis, although the slopes for birth cohorts are irregular and not uniformly spaced. The educational attainment gap decreases as one moves from the oldest to the youngest birth cohorts. Specifically, the educational attainment of Black men increased from about 35% that of White men for the two oldest birth cohorts to 73% that of White men for the two youngest birth cohorts. The compatible change for women was an increase in the relative educational attainment of Black women from approximately 45% that of White women for the two oldest cohorts to about 84% that of White women for the two youngest cohorts.
Three additional observations should be made about these results. First, changes in the ratios at age forty and above are almost certainly not due to continued educational upgrading. The most likely causes of changes in the ratios include differential mortality and grade inflation by race. Second, using the thirty to thirty-nine age group as a point of reference, a substantial racial gap remains, amounting to approximately 27% for men and 15% for women. These are substantial differences in educational attainment, which clearly will affect racial differences in occupation and earnings attainment, and the net worth of individuals and households. Even if an additional ten years of data were available to track the progress of the two youngest cohorts, the racial gap would most likely not change appreciably.
Third, an important aspect of changes in racial inequality in socioeconomic attainment is that the attainment levels of Whites are also changing, indicating that Blacks are attempting to achieve parity with a moving target. This pattern is clearly displayed in Figures 17 and 18 where changes in educational attainment by age and birth cohorts are separately reported for each gender group. The pattern of changes for men by age and birth cohorts are similar except that the relative change for White men is greater, particularly for the post-Depression cohorts. In fact, the differences between Black and White men widen considerably starting with the 1940 birth cohort. In the case of women, the patterns are much more similar; that is, the age and cohort patterns are very similar, although, as with men, White women’s superior position is maintained.
Trends in Predicted Proportion with One or More Years of Postsecondary Education, by Age and Birth Cohorts: Black and White Men
Note: Predicted values for one or more years of postsecondary education derived from multivariate regression analysis.
Source: IPUMS 1950–2010 (Ruggles et al., Reference Ruggles, Alexander, Genadek, Goeken, Schroeder and Sobek2010).

Trends in Predicted Proportion with One or More Years of Postsecondary Education, by Age and Birth Cohorts: Black and White Women
Note: Predicted values for one or more years of postsecondary education derived from multivariate regression analysis.
Source: IPUMS 1950–2010 (Ruggles et al., Reference Ruggles, Alexander, Genadek, Goeken, Schroeder and Sobek2010).

The age and cohort pattern of educational attainment, here operationalized as one or more years of postsecondary education, very closely corresponds with the age and cohort pattern of median occupational returns to education observed for men. The observed rapid increase in educational attainment for White men born after 1939 corresponds to a similar increase in occupational returns to education for these men. Thus it can be concluded that White men who entered the labor market in 1960 and later experienced higher levels of occupational status because of greater educational attainment. The same can also be said of White women but to a lesser extent. The occupational returns to education for Black women experienced considerably more variability by age than those of White women. Even so, the gap between Black and White women is not nearly as great as that observed for men.
Continuous Employment and Occupational Attainment
As previously noted, disruptions in employment, whether due to a spell of unemployment, nonparticipation, or most likely both, can have serious consequences for occupational placement and occupational mobility. Two or more of these types of disruptions over the life course can alter career trajectories with respect to specific occupational pursuits and the accumulated compensation and rewards a worker acquires over her working life (F. D. Wilson et al., Reference Wilson, Tienda and Wu1995; F. D. Wilson and Wu, Reference Wilson and Wu1993). The data sources employed here do not allow a long view of employment disruptions, with respect to the number, types, and duration; nor of the effects of these disruptions on occupational careers and compensation. The use of CPS files from the Minnesota Data Project allow only a retrospective view of the labor force experiences of individuals during the previous year. Unfortunately, even in this case, the description of labor force experiences is not arrayed in a sequential manner where it would be possible to observe spells of employment, unemployment, and nonparticipation in the order in which they occurred. Here, these events can be described only as distinct states. In addition, the CPS data cover only the civilian population, excluding individuals in institutions.
Annual CPS files covering the period from 1970 to 2010, however, do provide a more detailed portrait of the labor force activities of Blacks and Whites than is possible with the decennial censuses. Here, an attempt is made to access the impact of labor force activities on racial differences in occupational attainment. As in analyses previously presented, results are presented in the form of Black to White ratios of predicted values for percentage unemployment in the previous week, and the share of jobless (unemployed + nonparticipation) who are unemployed in the previous year. The predicted values were estimated from multiple regression equations (not reported) that included age, birth cohort, race, South region, full-time employment, self-employment, education, occupation; all two-way interactions involving race; two-way interactions of birth cohorts with South, and age; two-way interactions of education with South and birth cohort; two-way interactions of occupation with South and birth cohort; two-way interactions of education and occupation; and three-way interactions between race, education, and occupation. The statistical routine used was PROC GENMOD in SAS, in which birth cohort, education, and occupation were treated as factors. Finally, the estimated effect of occupational attainment is net of the effect of educational attainment.
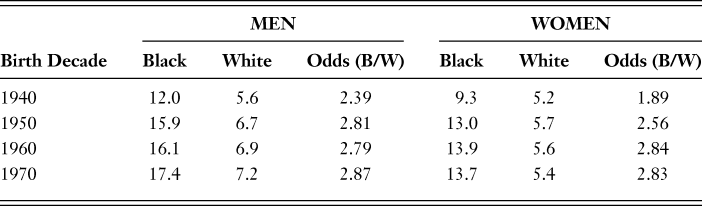
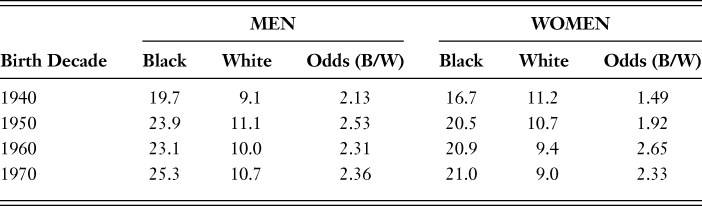
That the unemployment rate among African Americans is twice that of Whites is a well-established fact. The results reported in Table 1 are consistent with this observation (see F. D. Wilson et al., Reference Wilson, Tienda and Wu1995). Among men, the average unemployment rate for African Americans born in the 1940 decade and observed between 1970 and 2010 in the CPS is 12.0% versus 5.6% for Whites born in the same decade. On the other hand, the average unemployment rate for African American men born in the 1970 decade and observed between 2000 and 2010 in the CPS is 17.4% versus 7.2% for Whites born in the same decade. These increases in the unemployment rate translate into Black to White odds ratios of 2.39 to 2.87, for the 1940 and 1970 birth cohorts, respectively. Thus the unemployment situation for Black men worsens with respect to previous cohorts and White men.
Predicted Median Unemployment Rates by Sex and Race

Note: The predicted median values for birth decade are aggregated across varying censuses, including 1940 based on 1970 to 2010; 1950 based on 1980 to 2010; 1960 based on 1990 to 2010; and 1970 based on 2000 to 2010. Staggered years based on when individuals reached twenty-one years of age.
The unemployment rate for Black women is lower than that of Black men, and the odds of unemployment are lower for the 1940 cohort but very similar to men for the 1970 cohort. The average rate for Black women in the 1940 birth cohort observed between 1970 and 2010 is 9.3% versus an average of 13.7% for 2000 to 2010. The compatible figures for White women are 5.2% for the 1940 cohort and 5.4% for the 1970 cohort. These rates resulted in Black to White odds ratios of unemployment for women of 1.89 and 2.83, respectively.
The results for Black men and women indicate an increase in unemployment from the oldest (1940) to the youngest (1970) birth cohort during the 1970 to 2010 time period, particularly for men. In addition, the odds of unemployment relative to Whites also increased. Differences in the age composition of birth cohorts could be a major factor contributing to the increases. This is unlikely because the proportional changes in the unemployment rate for Whites from the oldest to the youngest cohort was much smaller than that observed for Blacks, which suggests that differences in the age composition of cohorts was at best only a minor contributing factor.
Unemployment is a component of joblessness which also includes individuals who are not actively seeking a job for various reasons. Unemployment constitutes a larger share of joblessness among Blacks during the previous year, and the unemployment share increased from the oldest to the youngest cohort, as reported in Table 2. Unemployment represents about 25% of joblessness for Black men versus 10% for White men during the previous year; and 21% for Black women and 9% for White women during the previous year. The racial gap in unemployment clearly has direct implications for occupational attainment as individuals move through the life course. Disruptions in employment due to spells of unemployment (and nonparticipation to a certain extent) can alter occupational careers through changes in positions, promotions, and compensation.
Unemployment Share on Jobless (percent) by Sex and Race

Note: The predicted median values for birth decade are aggregated across varying censuses, including 1940 based on 1970 to 2010; 1950 based on 1980 to 2010; 1960 based on 1990 to 2010; and 1970 based on 2000 to 2010. Staggered years based on when individuals reached twenty-one years of age.
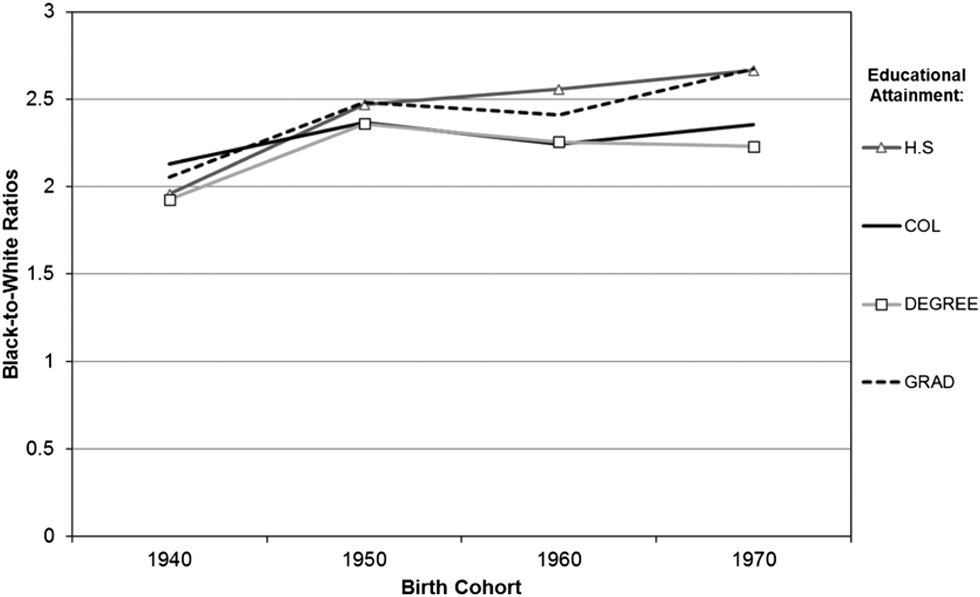
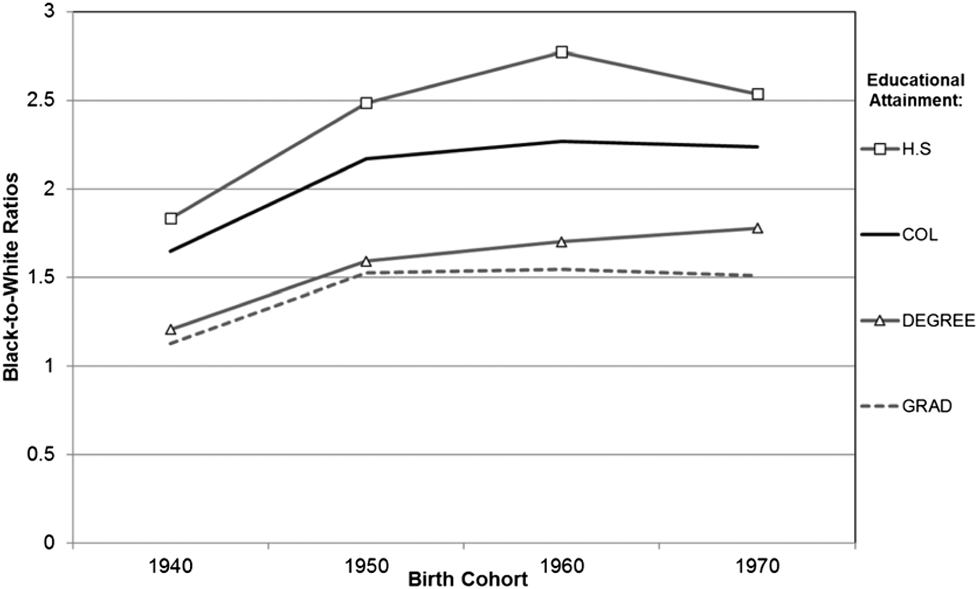
It is possible to associate both educational and occupational attainment to unemployment in the previous year, although in the case of occupation, “looking” for work may involve a wider range of positions than the position previously held. Figures 19 and 20 present ratios of Black to White odds of unemployment by birth cohort and educational attainment for men and women, respectively. Relative unemployment among college-educated Black men is as high as that for those who are not college educated. Black men are twice as likely to be unemployed as White men regardless of educational attainment. These results indicate that education has not played a role in narrowing the racial gap in unemployment for Black men, and thus contradicts the often cited observation that only less educated Black men have difficulty finding jobs relative to Whites of similar education (see F. D. Wilson et al., Reference Wilson, Tienda and Wu1995).
Ratios of Black-to-White Trends in Predicted Odds of Unemployment by Birth Cohorts and Educational Attainment: Men
Note: Predicted values for odds of unemployment derived from multivariate regression analysis.
Source: CPS 1970–2010 (Ruggles et al., Reference Ruggles, Alexander, Genadek, Goeken, Schroeder and Sobek2010).

Ratios of Black-to-White Trends in Predicted Odds of Unemployment by Birth Cohorts and Educational Attainment: Women
Note: Predicted values for odds of unemployment derived from multivariate regression analysis.
Source: CPS 1970–2010 (Ruggles et al., Reference Ruggles, Alexander, Genadek, Goeken, Schroeder and Sobek2010).

The relative unemployment of Black women is quite different. The size of the Black to White ratio is inversely related to educational attainment. The Black to White gap in unemployment is lowest for the college educated. This pattern is as one would expect, given the strong positive relationship between unemployment and education for both men and women.
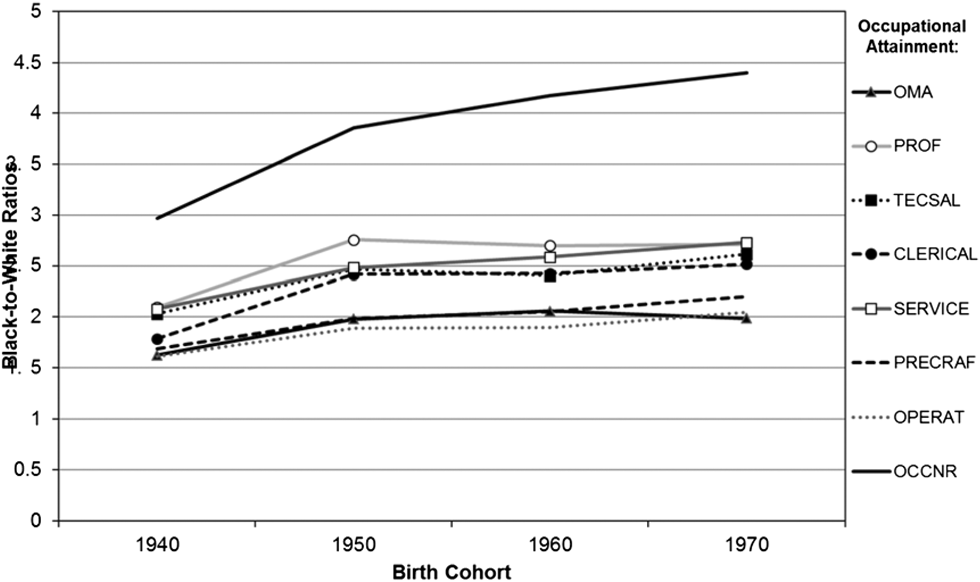
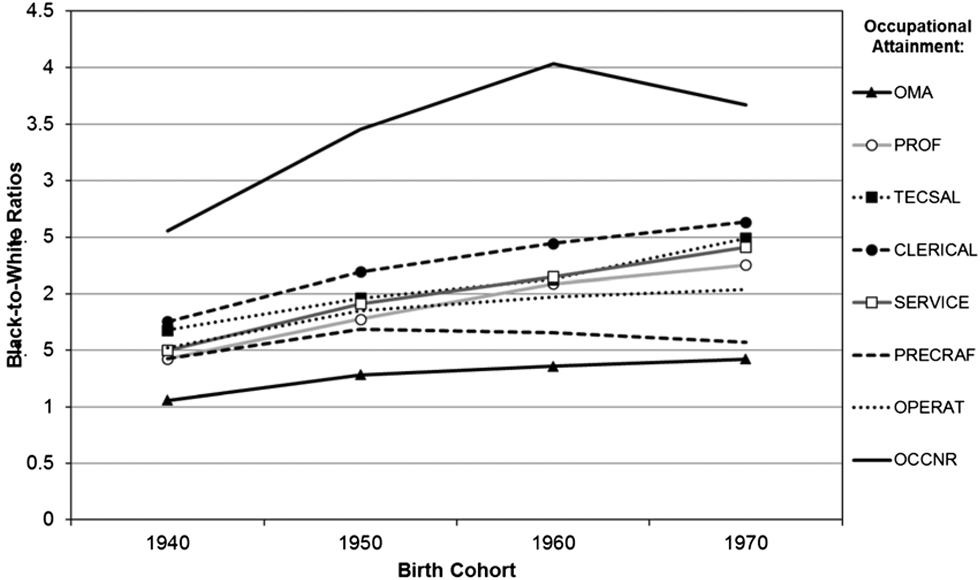
Figures 21 and 22 present ratios of Black to White unemployment odds for birth cohorts and major occupational groupings for men and women, respectively. The Black to White odds ratios for both men and women evidence a clear distinction between managers, officials, administrators, blue collar workers (precision craft, operatives, and laborers) versus other white collar (professional, technical, and sales) and pink collar (clerical, clerks, etc.) workers. The former groups have lower Black to White unemployment ratios than workers in the professional, technical, sales, and clerical worker categories. The racial gap appears less for women, but note that there is a slight upward shift in the ratios, indicating a widening unemployment gap. It would appear that Black men and women are experiencing greater difficulty in securing jobs in sectors in which employment growth has been the strongest, dynamic, and innovative—i.e., professional, technical, and sales (see Liu and Grusky, Reference Liu and Grusky2013).
Ratios of Black-to-White Trends in Predicted Odds of Unemployment by Birth Cohorts and Occupational Attainment: Men
Note: Predicted values for odds of unemployment derived from multivariate regression analysis.
Source: CPS 1970–2010 (Ruggles et al., Reference Ruggles, Alexander, Genadek, Goeken, Schroeder and Sobek2010).

Ratios of Black-to-White Trends in Predicted Odds of Unemployment by Birth Cohorts and Occupational Attainment: Women
Note: Predicted values for odds of unemployment derived from multivariate regression analysis.
Source: CPS 1970–2010 (Ruggles et al., Reference Ruggles, Alexander, Genadek, Goeken, Schroeder and Sobek2010).

DISCUSSION
The empirical analysis presented in the previous section was designed to assess the linkages of occupational returns to education and earnings returns to occupation with racial inequality. This is accomplished by analyzing changes in the relative status of birth cohorts by age born in successive decades from 1910 to 1919 to 1970 to 1979. Previous work on racial inequality in occupational attainment has focused primarily on whether Blacks and Whites occupy similar positions in the occupational hierarchy. The central focus of this work has been the measurement of the degree of segregation between Blacks and Whites in occupational positions. Findings indicate that Blacks still overwhelmingly occupy substantially lower positions in the occupational structure despite a host of executive orders, laws, and court rulings directed at eliminating discrimination and expanding opportunities for African Americans in the labor market. While there have been considerable increases in the occupational attainment level of African Americans since 1940, a substantial gap still remains between the races. In fact, much of the gains in occupational attainment of Blacks relative to Whites occurred between 1940 and 1980. The gains that have occurred since 1980 have been small and unstable (Childers Reference Childers2014; del Río and Alonso-Villar, Reference del Río and Alonso-Villar2015; Kaufman Reference Kaufman2010).
The research reported here builds on previous work, but changes the focus from occupational segregation to analyses of occupational returns to education and earnings returns to occupation. The former focuses on the nominal or categorical structure of occupations while the approach applied here transforms the nominal structure of occupations to a quantitative variable reflecting the educational attainment associated with specific occupations and the monetary rewards associated with that occupation. Thus, it should be apparent that a focus on racial differences in returns to and from occupational position is related to and reflective of racial differences in occupational position. For example, you would expect managers to be more educated and receive higher wages than a secretary.
The analyses presented in this paper seek to answer this question by focusing on long-term trends in “returns” to and from occupational status. Specifically, the question asked is, have Blacks and Whites received the same returns to educational attainment and the same returns in earnings by occupying specific occupational positions?
The answer to two questions motivated this analysis. First, have occupational returns to education and/or earnings returns to occupation increased incrementally from the oldest to the youngest birth cohorts among African Americans? Second, if the answer is affirmative, have such increases resulted in the reduction of racial inequality with respect to occupational returns to education and earnings returns to occupation? The results can be broadly summarized as follows. The analyses reported in the previous section indicate no appreciable change in racial inequality with respect to occupational status for men. Both Black and White men experienced increases in occupational returns to education, but the returns for White men were substantially greater. In contrast, neither group of men experienced noticeable changes in earnings returns to occupational status, resulting in virtually little change in inequality based on earnings returns to occupation. These results clearly indicate a pattern of stability with respect to relative returns to and from occupational status for Black men, whether they were born during the 1910 to 1919, 1940 to 1949, or the 1970 to 1979 decades, respectively. Finally, on a per capita basis, Black men’s occupational status declined for the most recent birth cohorts due in large part to joblessness starting with members of the 1940 birth cohort, which increased progressively with each successive birth cohort. The results for Black women, while more complicated, do provide some indication of narrowing the gap with White women. First, women also experienced increases in occupational attainment, but the changes were subject to greater fluctuation, particularly among Black women. In addition, occupational inequality is noticeably lower than that observed among men, although not necessarily a consequence of declines in inequality for the more recent cohorts. Women’s occupational position in the labor market still seems to be in transition (see Goldin Reference Goldin2006, Reference Goldin2014). This raises an important question: will racial inequality among women converge toward that of men, or will a distinctly different pattern emerge, such as a negotiated arrangement, perhaps reflecting differing aspirations and experiences of men and women?
Increases in educational attainment for men and women of both races contributed to increased occupational returns to education, but such increases did not alter the Black to White gap in returns for men and the gap for women did decrease but appears unstable. It still remains to be explained why the educational attainment of Whites increased to a far greater extent than that of Blacks among birth cohorts who presumably had access to greater educational opportunities supported by governmental initiatives and programs. On the other hand, it should be acknowledged that the socioeconomic standing of Whites is not fixed contemporarily, such that over time one would expect changes in their status irrespective of policy changes intended to benefit Blacks.
In addition, there are two other relevant considerations. First, there is the strong possibility that the motivations, aspirations, expectations, and behavior of Whites may have changed in ways that were a direct response to policy changes intended to benefit African Americans and other racial minorities. In other words, a significant number of Whites may have pursued further schooling to remain competitive in the labor market. Second, being situated in a socioeconomic environment with abundant resources and greater exposure to technical changes may provide the potential for pursuing opportunities in emerging areas of the economy (see Goldin and Katz, Reference Goldin and Katz2009). For example, the shift in demand favoring human capital/cognitive skills starting in the late 1970s dramatically altered the educational requirements for securing good paying jobs in an economy that was increasingly service oriented, and functioning in an increasingly global market place. Thus differentials in returns to schooling widened, favoring workers with higher educational credentials. These are the circumstances faced by African Americans. Whites were already advantaged educationally, and consequently had a firmer foundation that could be used to increase their advantage (Maralani Reference Maralani2003).
While increases in educational attainment improved the occupational status of men and women, since the 1980s and beyond, there is no direct evidence that earnings returns to occupation also responded to raising educational credentials. Clearly there are other market forces at work in setting earnings. About all that can be said is that the gap in earnings returns to occupation are preserved for men despite a structural shift in occupational opportunities, and the increased importance of cognitive/managerial skills. Earnings returns for the post-WWII cohorts of women clearly improved although it cannot be determined in this study how much a role educational advancement might have played relative to other factors, such as the removal of barriers to women’s full participation in schooling and the labor force.
Previous research indicates substantial differences between Black and White men in joblessness since the 1940s. Employment disruptions associated with unemployment and nonparticipation are much more likely to occur among Black men, altering occupational careers and therefore career trajectories (Holzer Reference Holzer2009; Smith and Welch, Reference Smith and Welch1989; F. D. Wilson et al., Reference Wilson, Tienda and Wu1995). Individuals who have experienced employment disruptions are also more likely to experience lower occupational returns to education and earnings returns to occupation relative to peers who experienced no disruptions in employment.
The data used in this analysis precludes an effort to replicate studies focusing on spells of employment and nonemployment of varying durations. However, results pointing to higher unemployment and joblessness for African Americans are certainly consistent with previous findings. Black men and women had high unemployment rates, and their rates represented a greater share of joblessness for both the 1940 and 1970 birth cohorts during the 1970 to 2010 period for the former, and 2000 to 2010 for the latter (as reported in CPS data). In addition, racial differences in unemployment by education among men is approximately the same for college-educated Blacks as noncollege-educated Black men. This finding clearly suggests that increased education among Black men has not improved their prospect of becoming employed. In the case of women, the exact opposite is true; the Black to White unemployment ratio is inversely related to education, indicating that the unemployment rate for Black women converges on that of Whites as education increases. Finally, as with education, the Black to White unemployment ratios are above 2.0 for cohorts born in 1950 or later. The ratio is higher for professional, technical, sales, and clerical occupations.
Although no attention has been given to within-race gender differences, here I summarize these differences as an aid to providing insight into other reported findings.Footnote 6 Gender differences are most striking by race. The relative status of Black women has improved to a greater extent than that of Black men. Indeed, a comparison of changes in employment status and occupational and educational attainment of Black women versus Black men indicates recent cohorts of Black women have surpassed men on all the indicators (not reported). That is, Black women have higher employment levels, much higher percentage completing at least one year of college, and receive greater occupational returns to education, and greater earnings returns to occupation. The approximate 5% advantage Black women enjoy over Black men with respect to earnings returns to occupation is of recent origin, occurring since 2000 for 1950 and later birth cohorts. With respect to employment, Black women employment is about 7% higher on average for the three most recent cohorts. While Black men employment is declining at all ages, Black women employment is rising.
By way of contrast, the employment of White women is approximately 11% lower than that of men. However, the employment of men is declining, while that of women continues to increase (Goldin Reference Goldin2006, Reference Goldin2014). In addition, there are still employment sectors where women remain underrepresented. White women recently surpassed White men in educational attainment and occupational returns to education.Footnote 7 White men continue to exceed White women in earnings returns to occupation. The gap is 35–40% in favor of men for the pre-1950 birth cohorts, but declined to about 12% for cohorts born in 1950 or later.
In light of reported findings, including those on gender, the important question to be asked at this point is, why has there been so little change in racial inequality in occupational attainment for men since 1950 among members of birth cohorts who entered the labor market in different time periods? Although there is clear evidence that the occupational attainment of Black women relative to White women improved up to the mid-1980s, changes in more recent decades have been marginal and unstable. The results make clear that Black men have the lowest standing in the labor market with respect to employment, occupational returns to education, and earnings returns to occupation. In fashioning an answer, attention will primarily focus on the circumstances of Black men. In doing so, it is certainly not my intention to suggest that Black men and women do not have similar experiences, and face similar barriers in the labor market.
While I will not build an argument based on the notion of Black male exceptionalism (see Butler Reference Butler2013), it has to be acknowledged that until the 1960s, women were not major players in the labor market. Labor market competition and conflict for jobs and compensation packages primarily involved men of different races and ethnicities (see Lieberson Reference Lieberson1980). Thus, perhaps one of the reasons Black Women appear to be doing better than Black men is because economic changes have been more favorable to the former’s employment prospects. Viewed historically, Black men and women have occupied different positions in the labor market. Since WWII, men have been concentrated in industrial/manufacturing, and increasing concentration in professional activities, while Black Women have been concentrated in domesticity, clerical, education, and increasing concentration in professional activities. Structural changes in the U.S. economy in conjunction with the increased globalization of economic activities has substantially reduced the demand for blue-collar labor. These changes adversely affected Black men, particularly those living in major industrial cities where industrial/manufacturing activities were highly concentrated (Wilson Reference Wilson2012b).
Although racial attitudes and beliefs about Black inferiority have undergone sea changes since WWII, there is still a varying number of Whites who reject racial equality in principle, and strongly oppose efforts to achieve this goal via race-targeted programs (see Bobo and Charles, Reference Bobo and Charles2009). Discrimination is still a factor limiting African Americans’ full participation in the labor market, fueled in part by beliefs and attitudes about Blacks’ appropriate place in American society (see Bobo and Charles, Reference Bobo and Charles2009; Darity and Mason, Reference Darity and Mason1998; Lang and Lehmann, Reference Lang and Lehmann2012; Massey Reference Massey2007; Reskin Reference Reskin, Berg and Kalleberg2001, Reference Reskin2012).
Another possible explanation for the limited change in racial inequality in occupational attainment may lie in the normative and organizational structure of the labor market, and the challenges this poses for implementing change. For example, there has always been opposition to race-targeted programs, but the pervasiveness and intensity of resistance have varied depending on the situational context (see Hirsh Reference Hirsh2009; Holzer and Neumark, Reference Holzer and Neumark2000; Jencks Reference Jencks1992; Tomaskovic-Devey and Stainback, Reference Tomaskovic-Devey and Stainback2007). Whites have been less resistant to race-targeted programs in the educational arena, particularly in elementary and secondary education, in part because of the recognition that minorities cannot succeed without adequate preparation (Jencks Reference Jencks1992). In addition, that the decision-making structure of schools is hierarchical and involves few key actors has played a major role in the implementation and diffusion of policy changes throughout school systems. This type of organizational structure contrasts sharply with the way in which labor markets are structured, which consist of numerous decision-making agents scattered over multiple industries and within multiple employing units. In addition, opposition to employment based on race-targeted programs has been stronger, because of the idea that given appropriate qualifications individuals should not be given preferential treatment (Bobo and Charles, Reference Bobo and Charles2009; Jencks Reference Jencks1992). Thus the increased educational attainment level achieved by Blacks since 1940 is not reflected in their occupational status.
Barbara Reskin (Reference Reskin2012) points out that individual racial disparities, such as inequality in occupational attainment, earnings, health, and incarceration, are not independent of each other, and most likely share specific underlying causes. Paraphrasing Reskin (Reference Reskin2012), a key motivating force would be efforts to maintain Whites’ superiority and dominant position in U.S. society. U.S. Associate Justice Marshall Harlan, in writing a dissent in the Plessy v. Ferguson case (1896) on the doctrine of “separate but equal” pointed out that the Court’s decision sanctioned African Americans’ inferior status and excluded them from full participation in American society as was their right as American citizens.
Historically, one can identify five interrelated mechanisms of exclusion that have substantially contributed to the persistence of racial inequality between Blacks and Whites in the labor market, including: 1) education acquisition; 2) spatial segregation and isolation; 3) participation in labor unions; 4) limited access to networks rich in social capital; and 5) civic involvement through political participation and voting. Each of these mechanisms of exclusion have affected the labor market status of African Americans, although in varying degrees and in different time periods.
Restricted access to education has long been a factor limiting Blacks’ participation in the labor market through the lack of skill and knowledge acquisition (Bulter Reference Butler2005; Curry Reference Curry1981; Fischer et al., Reference Fischer, Hout, Jankowski, Lucas, Swidler and Voss1996; Lieberson Reference Lieberson1980; Myrdal Reference Myrdal1944). The U.S. Supreme Court in Brown v. Board of Education (1954) ruled that segregation in public schools was unconstitutional. It was generally expected that over time, this would increase the attendance of Blacks and Whites in integrated school settings, and reduce racial disparities in school resources, teacher quality, and improved curriculum. These changes did not occur, as evidenced by the fact that in metropolitan areas Blacks and Whites are as segregated today as was the case in 1954. More importantly, the substantial redistribution of students from large public school systems to nonpublic and suburban schools has undermined the fiscal structure of school systems serving minority populations, and diminished their ability to obtain high-quality curriculum, teachers, and other resources necessary for quality education (Logan et al., Reference Logan, Minca and Adar2012). Efforts to desegregate public schools are a major factor contributing to White parents withdrawing their children from affected schools because desegregation actions limit parents’ ability to choose the best school environment for their children. But consistent with findings from neighborhood racial turnover, Whites withdrew their children from neighborhoods and schools even when schools are not the target of desegregation action (Massey and Denton, Reference Massey and Denton1993; F. D. Wilson Reference Wilson1985).
Racial residential segregation has been a principal mechanism of exclusion through its impact on the delivery of education services, housing, health care, access to employment opportunities, political participation, and consumer and professional services. Its role in limiting Blacks’ ability to acquire homeownership cannot be understated. While the South began to establish de jure patterns of segregation in all spheres that offer the potential for interracial contacts after Reconstruction, in the non-South, extra-legal means were used to create de facto patterns of segregation using violence, development of restrictive covenants, and the collusion involving insurance agents, real estate agents, and financial institutions to restrict Blacks’ housing search to particular areas (Duneier Reference Duneier2016; Massey and Denton, Reference Massey and Denton1993). Blacks’ inability to purchase homes, particularly in residentially stable neighborhoods, has sharply limited their ability to accumulate wealth and in turn acquire other assets through investment activities (Massey and Denton, Reference Massey and Denton1993; Myrdal Reference Myrdal1944). In addition, the restriction of residence selection primarily to central city areas resulted in the restrictions on access to and knowledge of the growing employment opportunities available in noncentral city areas (Massey and Denton, Reference Massey and Denton1993; F. D. Wilson Reference Wilson1979; W. J. Wilson Reference Wilson2012a).
African Americans were excluded from labor unions initially, gained access to industrial unions beginning in the late 1930s, then subsequently gradually gained access to craft and local building trades, and precision manufacturing unions in the 1950s (see Hill Reference Hill1996; Hill and Jones, Reference Hill and Jones1993). The struggle for union membership continued through the 1990s. Union membership was an important source of job security, promotion, and higher wages (Weeden Reference Weeden2002). As is well-known, labor unions have dramatically declined, and with this decline the diminishing influence of a very powerful mechanism through which people who aren’t White or aren’t male get good jobs (Hill Reference Hill1996).
Social networking is recognized as an important medium for transmitting information, and with the introduction of social media technology it has become even more important. Embedded within social networks is an abundance of information about the location and availability of employment opportunities. Blacks have few individuals in their networks who can be relied upon as a source of information about job availability, and who can refer them to job sites where employment is available (see DiTomaso Reference DiTomaso2013; Fernandez and Fernandez-Mateo, Reference Fernandez and Fernandez-Mateo2006). Glenn Loury (Reference Loury2003) indicates that currently, discrimination by “contract” is less important than discrimination by “contact” as a barrier to Blacks’ participation in labor markets and in securing jobs in particular employment sectors. This is because the racial composition of employment sites enhances the likelihood that information about job availability will be channeled through current workers’ networks.
Finally, one can note that restrictions on political participation and voting have played roles in limiting the access of African Americans to public policy decisions related to investment in and allocation of resources to community residents (Alexander Reference Alexander2012). In addition, the disenfranchisement of individuals with criminal records can stigmatize them, exclude them from voting, and limit their access to employment opportunities (Alexander Reference Alexander2012; Uggen and Manza, Reference Uggen and Manza2008; Western Reference Western2007).
The association of incarceration and employment is of particular importance. Incarceration, through drug and other criminal activities, disrupts current schooling and employment. After release from prison/jail another set of dynamics is set into motion that limits opportunities for further schooling and employment. As others have documented, employers are reluctant to hire individuals with criminal records, making it very difficult for those released from prison either to resume their occupational careers or secure employment in general. This is the situation faced by many Black youth who became of labor force age since the 1970s (Alexander Reference Alexander2012; Holzer Reference Holzer2009; Pager Reference Pager2007; Pager and Karafin, Reference Pager and Karafin2009; Western Reference Western2007). The high levels of joblessness among Black youth, and the low levels of occupational attainment are all reflective of Black men being disproportionately involved in the criminal justice system.
CONCLUSION
The findings reported in this paper should be considered tentative with respect to their substantive import. This is because results were derived from the analysis of the attributes of synthetic cohorts constructed from a collection of individuals who were born in the same decade but who, individually, cannot be followed in subsequent decades. It is for this reason that the analysis reported here has several shortcomings, including the inability to take account of entrances and exits from the sample as one moves from one decade to another. For example, an analysis based on a real cohort would be able to follow individuals of that cohort through their life course, noting any changes and taking account of all exits from the cohort through mortality, and all entrances and exits of individuals from the cohort resulting from international migration to and from the usual country of residence. A synthetic cohort analysis in contrast cannot control for the impact of migration or mortality on observed trends, nor can it control for enumeration errors associated with each decennial census. Thus improvement could be made in the substantive import of reported findings if real cohorts were used. Unfortunately, no longitudinal data sets exist that cover the entire period under review in this investigation. However, there are files that include data on the more recent cohorts, including the Panel Study of Income Dynamics, the National Longitudinal Study of Youth, and the panels of the Survey of Income and Program Participation.
There are several areas of inquiry that should be explored further. First, the interrelations between occupational returns to education and earnings from occupation with unemployment (nonparticipation) duration and re-employment. Since the odds of African Americans experiencing unemployment are twice those of Whites and they are unemployed over longer periods, this may result in part from Blacks experiencing lower returns to and from occupations. Second, more attention should be given to racial disparities in job search, particularly to the mechanics of job search—search methods, number of employer contacts, the use of networks as a source of information and referral, and the range of jobs that are being sought (DiTomaso Reference DiTomaso2013; Fernandez and Fernandez-Mateo, Reference Fernandez and Fernandez-Mateo2006; Holzer Reference Holzer2009; Pager and Karafin, Reference Pager and Karafin2009; Pager and Pedulla, Reference Pager and Pedulla2015). The difficulty Black youth face in securing employment (in part) because of employer preferences makes it harder for them to acquire the skills and experience necessary to advance (see Holzer Reference Holzer2009; Pager and Karafin, 2009; Pager and Pedulla, Reference Pager and Pedulla2015).
SUPPLEMENTARY MATERIAL
To view supplementary material for this article, please visit https://doi.org/10.1017/S1742058X17000170
ACKNOWLEDGMENT
This paper has benefitted from comments of colleagues at the Demography Training Seminar, UW–Madison, University of California-Los Angeles, Northwestern University, and the University of Minnesota; and benefitted from editorial assistance from Frank D. Brown, Dawn Duren, and Deborah Johnson.